Student Population at Loyola University Chicago

2023 Student PopulationUndergraduateGraduate
16,89911,7035,196
For the academic year 2022-2023, total of 16,899 students have enrolled in Loyola University Chicago with 11,703 undergraduate and 5,196 graduate students.
By gender, 5,281 male and 11,618 female students are attending the school.
It has significantly more students compared to similar colleges (10,434 students in average - private (not-for-profit) Research University (high research activity)).
2,215 students are enrolled exclusively, and 3,269 students are enrolled in some online courses.
You can check the student demographics by gender ratio, race/ethnicity, age distribution, and online enrollment.
Explore Loyola University Chicago

Student Population by Gender

Loyola University Chicago has a total of 16,899 enrolled students for the academic year 2022-2023. 11,703 students have enrolled in undergraduate programs and 5,196 students joined graduate programs.
By gender, 5,281 male and 11,618 female students (the male-female ratio is 31:69) are attending the school. The gender distribution is based on the 2022-2023 data.
Total Student Enrolled By Gender
TotalUndergraduateGraduate
Total16,89911,7035,196
Men5,2813,6491,632
Women11,6188,0543,564

Student Distribution by Race/Ethnicity

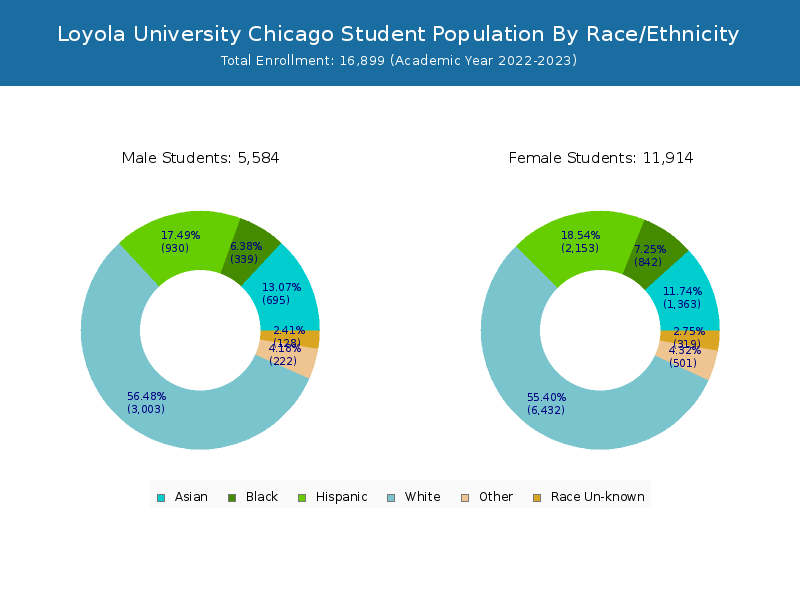
By race/ethnicity, 8,831 White, 1,196 Black, and 2,040 Asian students out of a total of 16,899 are attending at Loyola University Chicago. Comprehensive enrollment statistic data by race/ethnicity is shown in the next chart (Academic year 2022-2023 data).
Race/Ethnicity Distribution (Total)
RaceTotalMenWomen
American Indian or Native American17413
Asian2,0406741,366
Black1,196348848
Hispanic3,1229312,191
Native Hawaiian or Other Pacific Islanders1349
White8,8312,7356,096
Two or more races709202507
Race Unknown387126261
Race/Ethnicity Distribution (Undergraduate)
RaceTotalMenWomen
American Indian or Native American1239
Asian1,5225051,017
Black731211520
Hispanic2,4267441,682
Native Hawaiian or Other Pacific Islanders1046
White5,9531,8334,120
Two or more races572158414
Race Unknown1535895
Race/Ethnicity Distribution (Graduate)
RaceTotalMenWomen
American Indian or Native American514
Asian518169349
Black465137328
Hispanic696187509
Native Hawaiian or Other Pacific Islanders303
White2,8789021,976
Two or more races1374493
Race Unknown23468166

Student Age Distribution

By age, Loyola University Chicago has 138 students under 18 years old and 48 students over 65 years old. There are 12,545 students under 25 years old, and 4,354 students over 25 years old out of 16,899 total students.
In undergraduate programs, 138 students are younger than 18 and 5 students are older than 65. Loyola University Chicago has 10,987 undergraduate students aged under 25 and 716 students aged 25 and over.
It has 1,558 graduate students aged under 25 and 3,638 students aged 25 and over.
Student Age Distribution (Total)
AgeTotalMenWomen
Under 1813810632
18-195,2713,7261,545
20-214,5173,0601,457
22-242,6191,799820
25-292,1371,414723
30-34786517269
35-39462302160
40-49577409168
50-6434425787
Over 65482820
Student Age Distribution (Undergraduate)
AgeTotalMenWomen
Under 1813810632
18-195,2713,7261,545
20-214,4583,0141,444
22-241,120720400
25-29391258133
30-341279037
35-39614021
40-49876720
50-64453015
Over 65532
Student Age Distribution (Graduate)
AgeTotalMenWomen

Online Student Enrollment

Distance learning, also called online education, is very attractive to students, especially who want to continue education and work in field. At Loyola University Chicago, 2,215 students are enrolled exclusively in online courses and 3,269 students are enrolled in some online courses.
1,137 students lived in Illinois or jurisdiction in which the school is located are enrolled exclusively in online courses and 1,078 students live in other State or outside of the United States.
Online Student Population
All StudentsEnrolled Exclusively Online CoursesEnrolled in Some Online Courses
All Students16,8992,2153,269
Undergraduate11,7032201,825
Graduate5,1961,9951,444
Online Student Population by Locality
Illinois ResidentsOther States in U.S.Outside of U.S.
All Students1,1371,03345
Undergraduate168502
Graduate96998343

Transfer-in Students (Undergraduate)

Among 11,703 enrolled in undergraduate programs, 435 students have transferred-in from other institutions. The percentage of transfer-in students is 3.72%.410 students have transferred in as full-time status and 25 students transferred in as part-time status.
Transfer-in Students (Undergraduate)
Number of Students
Regular Full-time10,764
Transfer-in Full-time410
Regular Part-time504
Transfer-in Part-time25
Related Articles and Ads