Student Population at Quincy University

2023 Student PopulationUndergraduateGraduate
1,3071,147160
For the academic year 2022-2023, total of 1,307 students have enrolled in Quincy University with 1,147 undergraduate and 160 graduate students.
By gender, 683 male and 624 female students are attending the school.
It has relatively many students compared to similar colleges (1,143 students in average - private (not-for-profit) Baccalaureate College - Diverse Fields).
107 students are enrolled exclusively, and 715 students are enrolled in some online courses.
You can check the student demographics by gender ratio, race/ethnicity, age distribution, and online enrollment.
Explore Quincy University

Student Population by Gender

Quincy University has a total of 1,307 enrolled students for the academic year 2022-2023. 1,147 students have enrolled in undergraduate programs and 160 students joined graduate programs.
By gender, 683 male and 624 female students (the male-female ratio is 52:48) are attending the school. The gender distribution is based on the 2022-2023 data.
Total Student Enrolled By Gender
TotalUndergraduateGraduate
Total1,3071,147160
Men68359885
Women62454975

Student Distribution by Race/Ethnicity

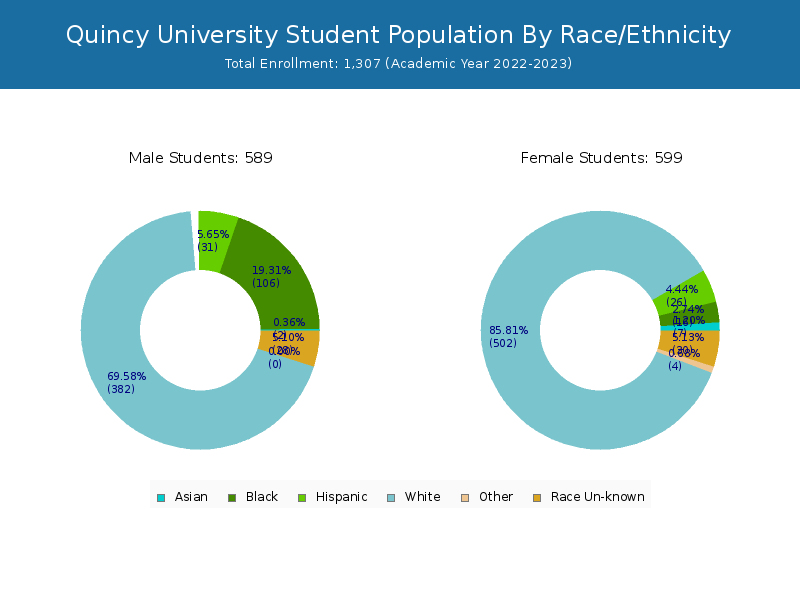
By race/ethnicity, 973 White, 117 Black, and 17 Asian students out of a total of 1,307 are attending at Quincy University. Comprehensive enrollment statistic data by race/ethnicity is shown in the next chart (Academic year 2022-2023 data).
Race/Ethnicity Distribution (Total)
RaceTotalMenWomen
American Indian or Native American110
Asian17512
Black1179819
Hispanic734231
Native Hawaiian or Other Pacific Islanders---
White973455518
Two or more races303
Race Unknown573423
Race/Ethnicity Distribution (Undergraduate)
RaceTotalMenWomen
American Indian or Native American110
Asian14410
Black1099316
Hispanic683929
Native Hawaiian or Other Pacific Islanders---
White845393452
Two or more races303
Race Unknown512922
Race/Ethnicity Distribution (Graduate)
RaceTotalMenWomen
American Indian or Native American---
Asian312
Black853
Hispanic532
Native Hawaiian or Other Pacific Islanders---
White1286266
Two or more races---
Race Unknown651

Student Age Distribution

By age, Quincy has 87 students under 18 years old and 6 students over 65 years old. There are 1,135 students under 25 years old, and 171 students over 25 years old out of 1,307 total students.
In undergraduate programs, 87 students are younger than 18 and 5 students are older than 65. Quincy has 1,068 undergraduate students aged under 25 and 79 students aged 25 and over.
It has 67 graduate students aged under 25 and 92 students aged 25 and over.
Student Age Distribution (Total)
AgeTotalMenWomen
Under 18874740
18-19472184288
20-21371193178
22-2420590115
25-29462521
30-34463214
35-3929209
40-49281810
50-6416106
Over 65651
Student Age Distribution (Undergraduate)
AgeTotalMenWomen
Under 18874740
18-19472184288
20-21370193177
22-241396871
25-2926179
30-3415105
35-3912102
40-491183
50-641073
Over 65550
Student Age Distribution (Graduate)
AgeTotalMenWomen

Online Student Enrollment

Distance learning, also called online education, is very attractive to students, especially who want to continue education and work in field. At Quincy University, 107 students are enrolled exclusively in online courses and 715 students are enrolled in some online courses.
84 students lived in Illinois or jurisdiction in which the school is located are enrolled exclusively in online courses and 23 students live in other State or outside of the United States.
Online Student Population
All StudentsEnrolled Exclusively Online CoursesEnrolled in Some Online Courses
All Students1,307107715
Undergraduate1,14726676
Graduate1608139
Online Student Population by Locality
Illinois ResidentsOther States in U.S.Outside of U.S.
All Students84212
Undergraduate2510
Graduate59202

Transfer-in Students (Undergraduate)

Among 1,147 enrolled in undergraduate programs, 100 students have transferred-in from other institutions. The percentage of transfer-in students is 8.72%.99 students have transferred in as full-time status and 1 students transferred in as part-time status.
Transfer-in Students (Undergraduate)
Number of Students
Regular Full-time890
Transfer-in Full-time99
Regular Part-time157
Transfer-in Part-time1
Related Articles and Ads