How many students at UIS? For the academic year 2023-2024, total of 4,661 students have enrolled in University of Illinois Springfield with 2,342 undergraduate and 2,319 graduate students.
By gender, 2,267 male and 2,394 female students are attending the school.
It has much fewer students compared to similar colleges (9,905 students in average - public Master's College and University (larger programs)).
2,161 students are enrolled exclusively, and 1,698 students are enrolled in some online courses.
You can check the student demographics by gender ratio, race/ethnicity, age distribution, and online enrollment.
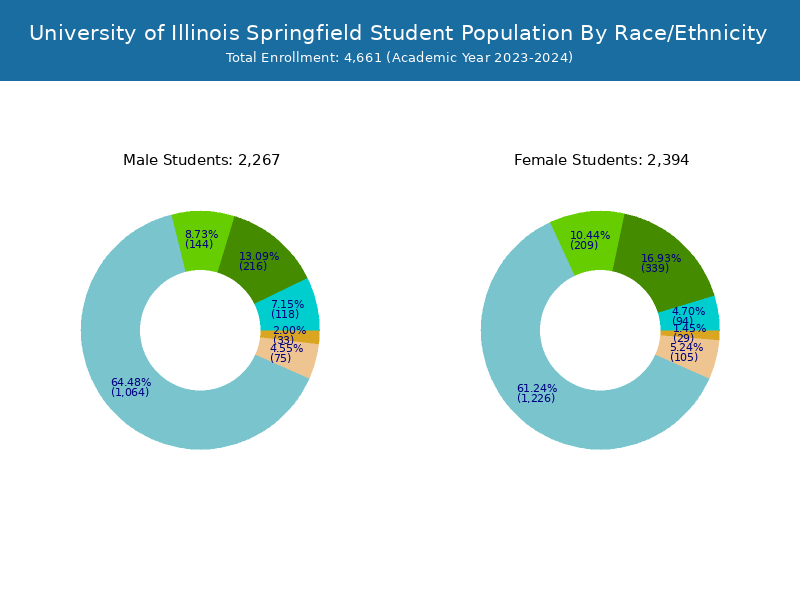
University of Illinois Springfield has a total of 4,661 enrolled students for the academic year 2023-2024. 2,342 students have enrolled in undergraduate programs and 2,319 students joined graduate programs.
By gender, 2,267 male and 2,394 female students (the male-female ratio is 49:51) are attending the school. The gender distribution is based on the 2023-2024 data.
Total | Undergraduate | Graduate | |
---|---|---|---|
Total | 4,661 | 2,342 | 2,319 |
Men | 2,267 | 1,043 | 1,224 |
Women | 2,394 | 1,299 | 1,095 |
By race/ethnicity, 2,290 White, 555 Black, and 212 Asian students out of a total of 4,661 are attending at University of Illinois Springfield. Comprehensive enrollment statistic data by race/ethnicity is shown in chart below (academic year 2023-2024 data).
Race | Total | Men | Women |
---|---|---|---|
American Indian or Native American | 5 | 3 | 2 |
Asian | 212 | 118 | 94 |
Black | 555 | 216 | 339 |
Hispanic | 353 | 144 | 209 |
Native Hawaiian or Other Pacific Islanders | 8 | 1 | 7 |
White | 2,290 | 1,064 | 1,226 |
Two or more races | 167 | 71 | 96 |
Race Unknown | 62 | 33 | 29 |
Race | Total | Men | Women |
---|---|---|---|
American Indian or Native American | 2 | 1 | 1 |
Asian | 93 | 50 | 43 |
Black | 296 | 116 | 180 |
Hispanic | 249 | 94 | 155 |
Native Hawaiian or Other Pacific Islanders | 7 | 0 | 7 |
White | 1,444 | 674 | 770 |
Two or more races | 124 | 47 | 77 |
Race Unknown | 37 | 21 | 16 |
Race | Total | Men | Women |
---|---|---|---|
American Indian or Native American | 3 | 2 | 1 |
Asian | 119 | 68 | 51 |
Black | 259 | 100 | 159 |
Hispanic | 104 | 50 | 54 |
Native Hawaiian or Other Pacific Islanders | 1 | 1 | 0 |
White | 846 | 390 | 456 |
Two or more races | 43 | 24 | 19 |
Race Unknown | 25 | 12 | 13 |
By age, UIS has 8 students under 18 years old and 20 students over 65 years old. There are 2,315 students under 25 years old, and 2,346 students over 25 years old out of 4,661 total students.
In undergraduate programs, 8 students are younger than 18 and 4 students are older than 65. UIS has 1,573 undergraduate students aged under 25 and 769 students aged 25 and over.
It has 742 graduate students aged under 25 and 1,577 students aged 25 and over.
Age | Total | Men | Women |
---|---|---|---|
Under 18 | 8 | 6 | 2 |
18-19 | 469 | 301 | 168 |
20-21 | 697 | 413 | 284 |
22-24 | 1,141 | 532 | 609 |
25-29 | 872 | 394 | 478 |
30-34 | 471 | 218 | 253 |
35-39 | 366 | 182 | 184 |
40-49 | 407 | 221 | 186 |
50-64 | 210 | 117 | 93 |
Over 65 | 20 | 10 | 10 |
Age | Total | Men | Women |
---|---|---|---|
Under 18 | 8 | 6 | 2 |
18-19 | 468 | 301 | 167 |
20-21 | 642 | 385 | 257 |
22-24 | 455 | 222 | 233 |
25-29 | 266 | 130 | 136 |
30-34 | 182 | 90 | 92 |
35-39 | 135 | 65 | 70 |
40-49 | 115 | 62 | 53 |
50-64 | 67 | 36 | 31 |
Over 65 | 4 | 2 | 2 |
Age | Total | Men | Women |
---|---|---|---|
18-19 | 1 | 0 | 1 |
20-21 | 55 | 28 | 27 |
22-24 | 686 | 310 | 376 |
25-29 | 606 | 264 | 342 |
30-34 | 289 | 128 | 161 |
35-39 | 231 | 117 | 114 |
40-49 | 292 | 159 | 133 |
50-64 | 143 | 81 | 62 |
Over 65 | 16 | 8 | 8 |
Distance learning, also called online education, is very attractive to students, especially who want to continue education and work in field. At University of Illinois Springfield, 2,161 students are enrolled exclusively in online courses and 1,698 students are enrolled in some online courses.
1,615 students lived in Illinois or jurisdiction in which the school is located are enrolled exclusively in online courses and 546 students live in other State or outside of the United States.
All Students | Enrolled Exclusively Online Courses | Enrolled in Some Online Courses | |
---|---|---|---|
All Students | 4,661 | 2,161 | 1,698 |
Undergraduate | 2,342 | 996 | 917 |
Graduate | 2,319 | 1,165 | 781 |
Illinois Residents | Other States in U.S. | Outside of U.S. | |
---|---|---|---|
All Students | 1,615 | 453 | 93 |
Undergraduate | 847 | 125 | 24 |
Graduate | 768 | 328 | 69 |
Among 2,342 enrolled in undergraduate programs, 448 students have transferred-in from other institutions. The percentage of transfer-in students is 19.13%.299 students have transferred in as full-time status and 149 students transferred in as part-time status.
Number of Students | |
---|---|
Regular Full-time | 1,354 |
Transfer-in Full-time | 299 |
Regular Part-time | 540 |
Transfer-in Part-time | 149 |
Share your experiences and thoughts about University of Illinois Springfield. It will be a great help to applicants and prospective students!