Student Population at Loyola University New Orleans

2023 Student PopulationUndergraduateGraduate
4,3973,2891,108
For the academic year 2022-2023, total of 4,397 students have enrolled in Loyola University New Orleans with 3,289 undergraduate and 1,108 graduate students.
By gender, 1,480 male and 2,917 female students are attending the school.
It has relatively fewer students compared to similar colleges (5,463 students in average - private (not-for-profit) Doctoral / Research University).
534 students are enrolled exclusively, and 1,166 students are enrolled in some online courses.
You can check the student demographics by gender ratio, race/ethnicity, age distribution, and online enrollment.
Explore Loyola University New Orleans

Student Population by Gender

Loyola University New Orleans has a total of 4,397 enrolled students for the academic year 2022-2023. 3,289 students have enrolled in undergraduate programs and 1,108 students joined graduate programs.
By gender, 1,480 male and 2,917 female students (the male-female ratio is 34:66) are attending the school. The gender distribution is based on the 2022-2023 data.
Total Student Enrolled By Gender
TotalUndergraduateGraduate
Total4,3973,2891,108
Men1,4801,097383
Women2,9172,192725

Student Distribution by Race/Ethnicity

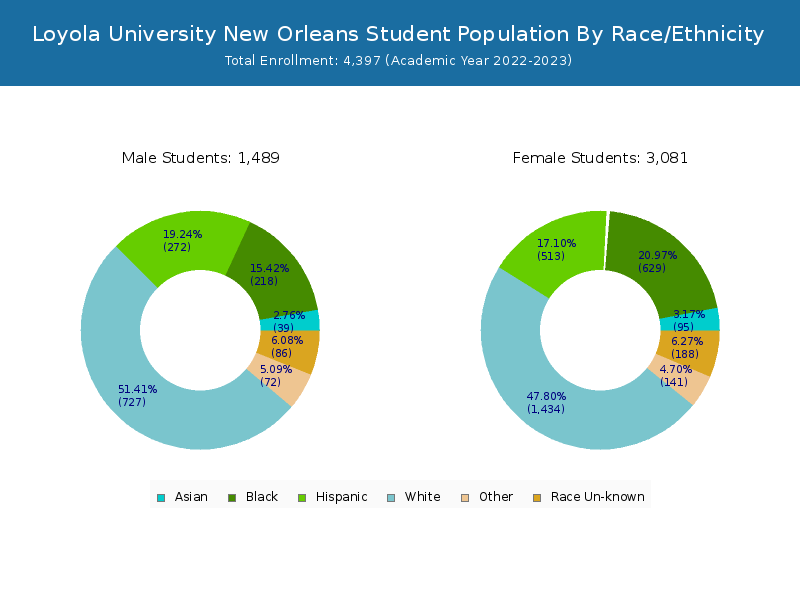
By race/ethnicity, 2,109 White, 801 Black, and 135 Asian students out of a total of 4,397 are attending at Loyola University New Orleans. Comprehensive enrollment statistic data by race/ethnicity is shown in the next chart (Academic year 2022-2023 data).
Race/Ethnicity Distribution (Total)
RaceTotalMenWomen
American Indian or Native American18513
Asian13530105
Black801217584
Hispanic808278530
Native Hawaiian or Other Pacific Islanders422
White2,1097581,351
Two or more races19054136
Race Unknown16750117
Race/Ethnicity Distribution (Undergraduate)
RaceTotalMenWomen
American Indian or Native American1129
Asian962373
Black616168448
Hispanic688235453
Native Hawaiian or Other Pacific Islanders312
White1,475514961
Two or more races16448116
Race Unknown923062
Race/Ethnicity Distribution (Graduate)
RaceTotalMenWomen
American Indian or Native American734
Asian39732
Black18549136
Hispanic1204377
Native Hawaiian or Other Pacific Islanders110
White634244390
Two or more races26620
Race Unknown752055

Student Age Distribution

By age, Loyola University New Orleans has 89 students under 18 years old and 8 students over 65 years old. There are 3,494 students under 25 years old, and 901 students over 25 years old out of 4,397 total students.
In undergraduate programs, 88 students are younger than 18 and 2 students are older than 65. Loyola University New Orleans has 3,085 undergraduate students aged under 25 and 203 students aged 25 and over.
In graduate schools at Loyola University New Orleans, 1 students are younger than 18 and 6 students are older than 65. It has 409 graduate students aged under 25 and 698 students aged 25 and over.
Student Age Distribution (Total)
AgeTotalMenWomen
Under 18896326
18-191,432985447
20-211,267832435
22-24706432274
25-29387243144
30-3415610254
35-391187939
40-4913510431
50-64977126
Over 65853
Student Age Distribution (Undergraduate)
AgeTotalMenWomen
Under 18886226
18-191,432985447
20-211,249820429
22-24316192124
25-29654322
30-34382018
35-39342410
40-4930228
50-64342311
Over 65211
Student Age Distribution (Graduate)
AgeTotalMenWomen
Under 18110

Online Student Enrollment

Distance learning, also called online education, is very attractive to students, especially who want to continue education and work in field. At Loyola University New Orleans, 534 students are enrolled exclusively in online courses and 1,166 students are enrolled in some online courses.
298 students lived in Louisiana or jurisdiction in which the school is located are enrolled exclusively in online courses and 236 students live in other State or outside of the United States.
Online Student Population
All StudentsEnrolled Exclusively Online CoursesEnrolled in Some Online Courses
All Students4,3975341,166
Undergraduate3,2892101,109
Graduate1,10832457
Online Student Population by Locality
Louisiana ResidentsOther States in U.S.Outside of U.S.
All Students2982351
Undergraduate128811
Graduate1701540

Transfer-in Students (Undergraduate)

Among 3,289 enrolled in undergraduate programs, 126 students have transferred-in from other institutions. The percentage of transfer-in students is 3.83%.100 students have transferred in as full-time status and 26 students transferred in as part-time status.
Transfer-in Students (Undergraduate)
Number of Students
Regular Full-time2,900
Transfer-in Full-time100
Regular Part-time263
Transfer-in Part-time26
Related Articles and Ads