Student Population at Notre Dame of Maryland University

2023 Student PopulationUndergraduateGraduate
1,7336601,073
For the academic year 2022-2023, total of 1,733 students have enrolled in Notre Dame of Maryland University with 660 undergraduate and 1,073 graduate students.
By gender, 251 male and 1,482 female students are attending the school.
It has much fewer students compared to similar colleges (6,139 students in average - private (not-for-profit) Master's College and University (larger programs)).
915 students are enrolled exclusively, and 332 students are enrolled in some online courses.
You can check the student demographics by gender ratio, race/ethnicity, age distribution, and online enrollment.
Explore Notre Dame of Maryland University

Student Population by Gender

Notre Dame of Maryland University has a total of 1,733 enrolled students for the academic year 2022-2023. 660 students have enrolled in undergraduate programs and 1,073 students joined graduate programs.
By gender, 251 male and 1,482 female students (the male-female ratio is 14:86) are attending the school. The gender distribution is based on the 2022-2023 data.
Total Student Enrolled By Gender
TotalUndergraduateGraduate
Total1,7336601,073
Men25125226
Women1,482635847

Student Distribution by Race/Ethnicity

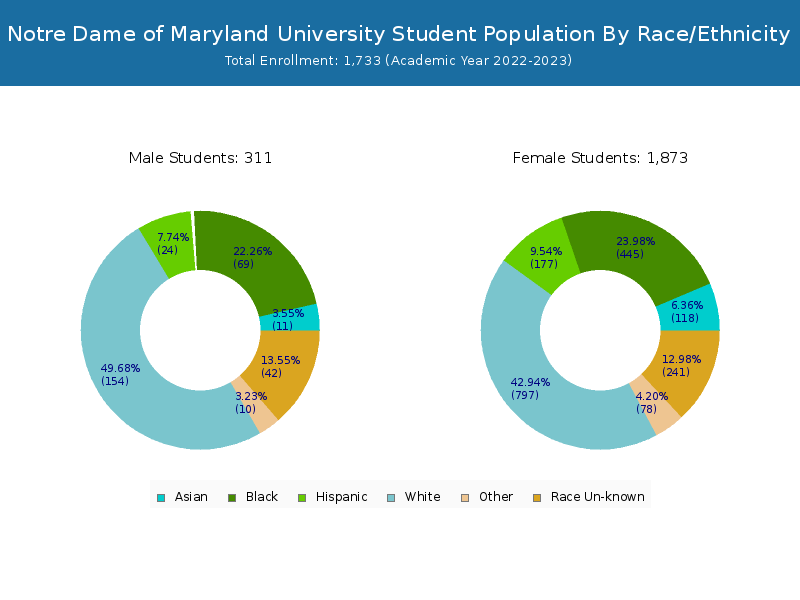
By race/ethnicity, 733 White, 433 Black, and 88 Asian students out of a total of 1,733 are attending at Notre Dame of Maryland University. Comprehensive enrollment statistic data by race/ethnicity is shown in the next chart (Academic year 2022-2023 data).
Race/Ethnicity Distribution (Total)
RaceTotalMenWomen
American Indian or Native American101
Asian88880
Black43371362
Hispanic16117144
Native Hawaiian or Other Pacific Islanders202
White733118615
Two or more races69564
Race Unknown23432202
Race/Ethnicity Distribution (Undergraduate)
RaceTotalMenWomen
American Indian or Native American101
Asian40337
Black1929183
Hispanic88385
Native Hawaiian or Other Pacific Islanders101
White19510185
Two or more races28028
Race Unknown1110111
Race/Ethnicity Distribution (Graduate)
RaceTotalMenWomen
American Indian or Native American---
Asian48543
Black24162179
Hispanic731459
Native Hawaiian or Other Pacific Islanders101
White538108430
Two or more races41536
Race Unknown1233291

Student Age Distribution

By age, Notre Dame of Maryland has 8 students under 18 years old and 13 students over 65 years old. There are 478 students under 25 years old, and 1,253 students over 25 years old out of 1,733 total students.
In undergraduate programs, 8 students are younger than 18 and 1 students are older than 65. Notre Dame of Maryland has 373 undergraduate students aged under 25 and 287 students aged 25 and over.
It has 105 graduate students aged under 25 and 966 students aged 25 and over.
Student Age Distribution (Total)
AgeTotalMenWomen
Under 18880
18-191111110
20-211161160
22-2424322023
25-2937231557
30-3421015852
35-3915912930
40-4930725453
50-6419215933
Over 6513103
Student Age Distribution (Undergraduate)
AgeTotalMenWomen
Under 18880
18-191111110
20-211111110
22-241431394
25-2911510510
30-3460555
35-3941401
40-4949454
50-6421201
Over 65110
Student Age Distribution (Graduate)
AgeTotalMenWomen

Online Student Enrollment

Distance learning, also called online education, is very attractive to students, especially who want to continue education and work in field. At Notre Dame of Maryland University, 915 students are enrolled exclusively in online courses and 332 students are enrolled in some online courses.
806 students lived in Maryland or jurisdiction in which the school is located are enrolled exclusively in online courses and 109 students live in other State or outside of the United States.
Online Student Population
All StudentsEnrolled Exclusively Online CoursesEnrolled in Some Online Courses
All Students1,733915332
Undergraduate660140207
Graduate1,073775125
Online Student Population by Locality
Maryland ResidentsOther States in U.S.Outside of U.S.
All Students8061081
Undergraduate13640
Graduate6701041

Transfer-in Students (Undergraduate)

Among 660 enrolled in undergraduate programs, 89 students have transferred-in from other institutions. The percentage of transfer-in students is 13.48%.73 students have transferred in as full-time status and 16 students transferred in as part-time status.
Transfer-in Students (Undergraduate)
Number of Students
Regular Full-time424
Transfer-in Full-time73
Regular Part-time147
Transfer-in Part-time16
Related Articles and Ads