At Central Michigan University, the graduation rate is 62 % within 150% normal time, the retention rate is 74 %, as of August 31, 2024.
Its graduation rate is relatively higher than the average rate when comparing similar colleges' rate of 55.64% (public Research University with high research activity).
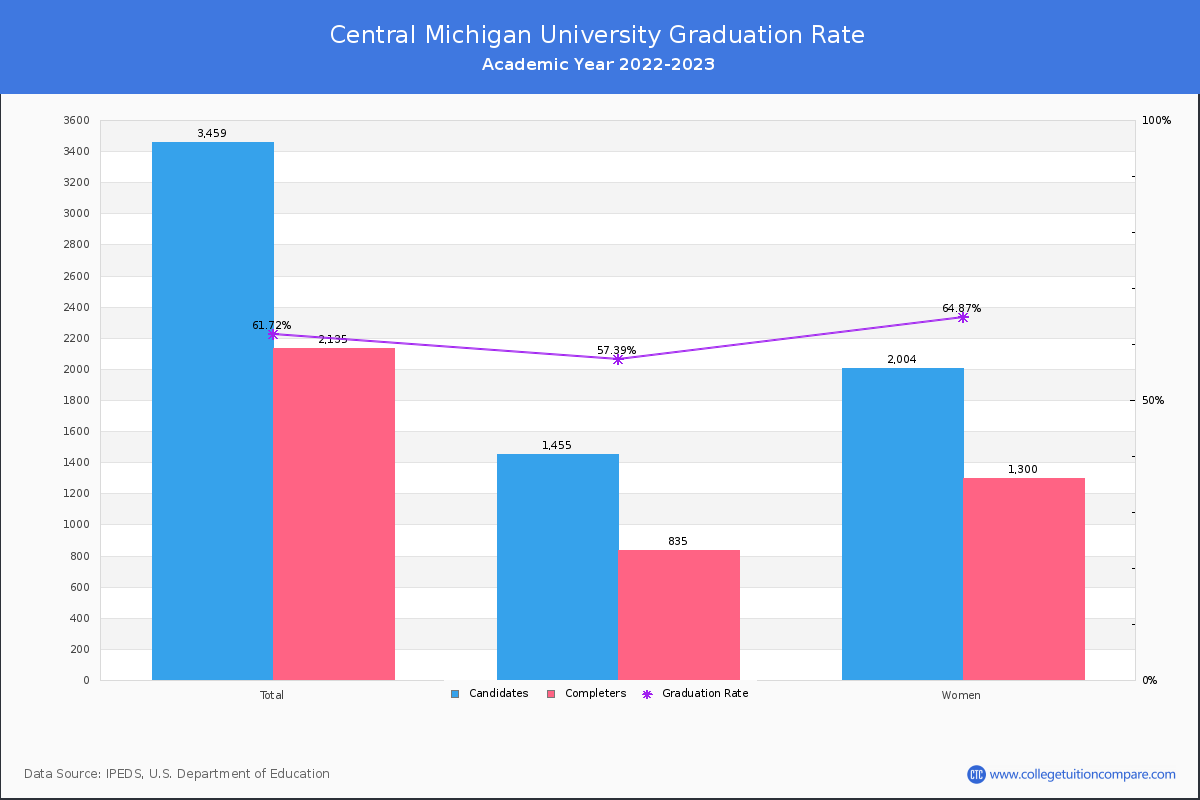
For the academic year 2023-2024, 1,883 students out of 3,045 candidates have completed their courses within 150% normal time (i.e. in 6 years for 4-year BS degree) at Central Michigan University.
By gender, 721 male and 1,162 female students graduated the school last year completing their jobs in the period.
Candidates | Completers | Graduation Rates | |
---|---|---|---|
Total | 3,045 | 1,883 | 61.84% |
Men | 1,282 | 721 | 56.24% |
Women | 1,763 | 1,162 | 65.91% |
The following table shows graduation rate by race and at Central Michigan University.
Total | Male | Female | |
---|---|---|---|
American Indian or Alaska Native | 27.78%(5/18) | 12.50%(1/8) | 40.00%(4/10) |
Asian | 61.90%(26/42) | 57.14%(12/21) | 66.67%(14/21) |
Black (Non-Hispanic) | 46.39%(154/332) | 40.38%(63/156) | 51.70%(91/176) |
Hispanic | 57.59%(91/158) | 53.42%(39/73) | 61.18%(52/85) |
White | 64.87%(1,514/2,334) | 59.21%(572/966) | 68.86%(942/1,368) |
Native Hawaiian or Other Pacific Islander | 33.33%(1/3) | 50.00%(1/2) | - |
Two or More Race | 53.23%(66/124) | 50.00%(20/40) | 54.76%(46/84) |
Unknown | 75.00%(15/20) | 77.78%(7/9) | 72.73%(8/11) |
A non-resident alien student is not a US citizen/green card holder and studies with a student visa, such as an F visa, in the United States. At Central Michigan University, 11 of 14 non-resident alien students completed their studies and the graduation rate was 41.71%.
Share your experiences and thoughts about Central Michigan University. It will be a great help to applicants and prospective students!