Student Population at Citadel Military College of South Carolina

2023 Student PopulationUndergraduateGraduate
3,7212,6951,026
For the academic year 2022-2023, total of 3,721 students have enrolled in Citadel Military College of South Carolina with 2,695 undergraduate and 1,026 graduate students.
By gender, 2,831 male and 890 female students are attending the school.
It has much fewer students compared to similar colleges (9,858 students in average - public Master's College and University (larger programs)).
616 students are enrolled exclusively, and 610 students are enrolled in some online courses.
You can check the student demographics by gender ratio, race/ethnicity, age distribution, and online enrollment.
Explore Citadel Military College of South Carolina

Student Population by Gender

Citadel Military College of South Carolina has a total of 3,721 enrolled students for the academic year 2022-2023. 2,695 students have enrolled in undergraduate programs and 1,026 students joined graduate programs.
By gender, 2,831 male and 890 female students (the male-female ratio is 76:24) are attending the school. The gender distribution is based on the 2022-2023 data.
Total Student Enrolled By Gender
TotalUndergraduateGraduate
Total3,7212,6951,026
Men2,8312,297534
Women890398492
Citadel Military College of South Carolina 2023 Student Population by Gender and Race chart

Student Distribution by Race/Ethnicity

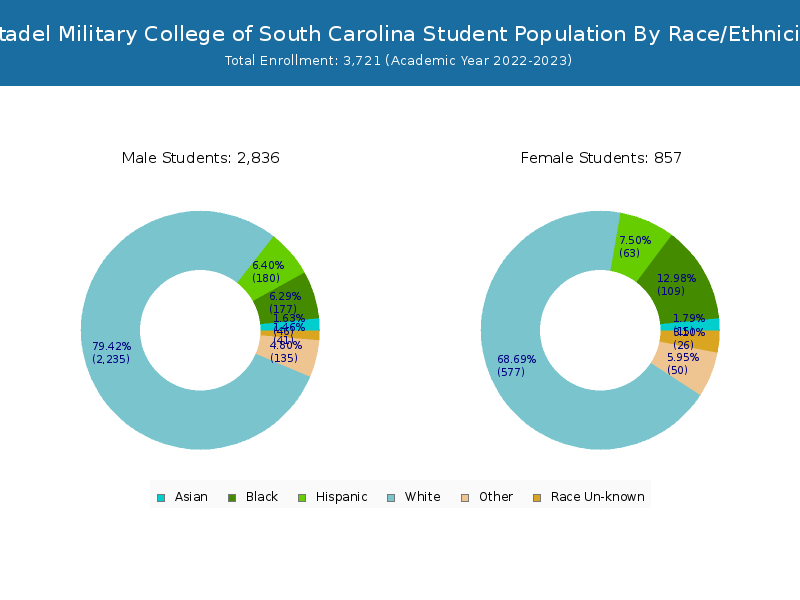
By race/ethnicity, 2,776 White, 325 Black, and 70 Asian students out of a total of 3,721 are attending at Citadel Military College of South Carolina. Comprehensive enrollment statistic data by race/ethnicity is shown in the next chart (Academic year 2022-2023 data).
Race/Ethnicity Distribution (Total)
RaceTotalMenWomen
American Indian or Native American880
Asian705416
Black325197128
Hispanic25718572
Native Hawaiian or Other Pacific Islanders862
White2,7762,200576
Two or more races17712552
Race Unknown593623
Race/Ethnicity Distribution (Undergraduate)
RaceTotalMenWomen
American Indian or Native American440
Asian54468
Black19414648
Hispanic20615749
Native Hawaiian or Other Pacific Islanders550
White2,0231,785238
Two or more races13610630
Race Unknown453015
Race/Ethnicity Distribution (Graduate)
RaceTotalMenWomen
American Indian or Native American440
Asian1688
Black1315180
Hispanic512823
Native Hawaiian or Other Pacific Islanders312
White753415338
Two or more races411922
Race Unknown1468

Student Age Distribution

By age, Citadel has 12 students under 18 years old and 18 students over 65 years old. There are 2,628 students under 25 years old, and 1,093 students over 25 years old out of 3,721 total students.
In undergraduate programs, 12 students are younger than 18 and 4 students are older than 65. Citadel has 2,413 undergraduate students aged under 25 and 282 students aged 25 and over.
It has 215 graduate students aged under 25 and 811 students aged 25 and over.
Student Age Distribution (Total)
AgeTotalMenWomen
Under 181239
18-191,046151895
20-211,072145927
22-24498162336
25-29369154215
30-3421782135
35-3917353120
40-4920590115
50-641114665
Over 6518414
Student Age Distribution (Undergraduate)
AgeTotalMenWomen
Under 181239
18-191,046151895
20-211,062138924
22-2429347246
25-2912620106
30-34691653
35-3938632
40-4928919
50-6417611
Over 65422
Student Age Distribution (Graduate)
AgeTotalMenWomen

Online Student Enrollment

Distance learning, also called online education, is very attractive to students, especially who want to continue education and work in field. At Citadel Military College of South Carolina, 616 students are enrolled exclusively in online courses and 610 students are enrolled in some online courses.
406 students lived in South Carolina or jurisdiction in which the school is located are enrolled exclusively in online courses and 210 students live in other State or outside of the United States.
Online Student Population
All StudentsEnrolled Exclusively Online CoursesEnrolled in Some Online Courses
All Students3,721616610
Undergraduate2,695132262
Graduate1,026484348
Online Student Population by Locality
South Carolina ResidentsOther States in U.S.Outside of U.S.
All Students4062082
Undergraduate97350
Graduate3091732

Transfer-in Students (Undergraduate)

Among 2,695 enrolled in undergraduate programs, 110 students have transferred-in from other institutions. The percentage of transfer-in students is 4.08%.81 students have transferred in as full-time status and 29 students transferred in as part-time status.
Transfer-in Students (Undergraduate)
Number of Students
Regular Full-time2,388
Transfer-in Full-time81
Regular Part-time197
Transfer-in Part-time29
Related Articles and Ads