CCU's Graduation Rate
At Colorado Christian University, the graduation rate is 55 % within 150% normal time, the retention rate is 79 %, as of August 31, 2024.
Its graduation rate is around the average rate when comparing similar colleges' rate of 57.43% (private (not-for-profit) Master's College and University with larger programs).
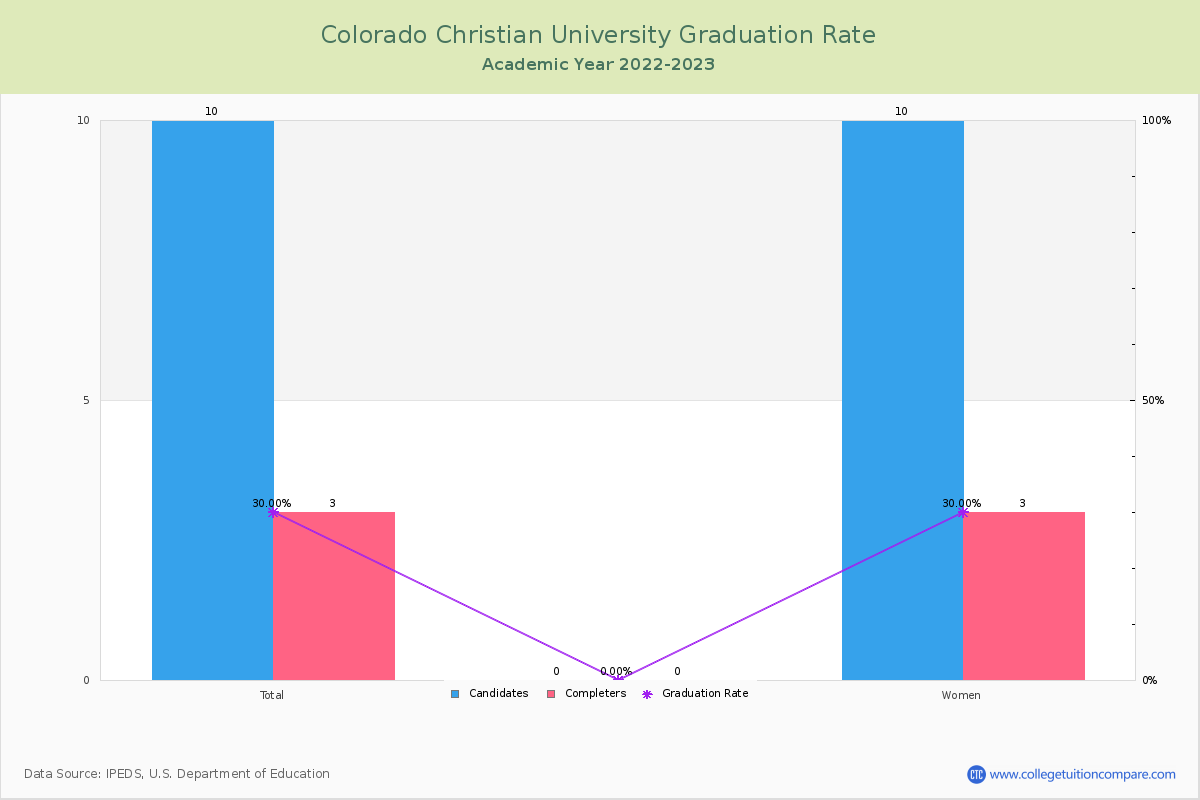
Graduation Rates in Reasonable Completion Time
For the academic year 2023-2024, 213 students out of 385 candidates have completed their courses within 150% normal time (i.e. in 6 years for 4-year BS degree) at Colorado Christian University.
By gender, 71 male and 142 female students graduated the school last year completing their jobs in the period.
| Candidates | Completers | Graduation Rates | |
|---|---|---|---|
| Total | 385 | 213 | 55.32% |
| Men | 140 | 71 | 50.71% |
| Women | 245 | 142 | 57.96% |
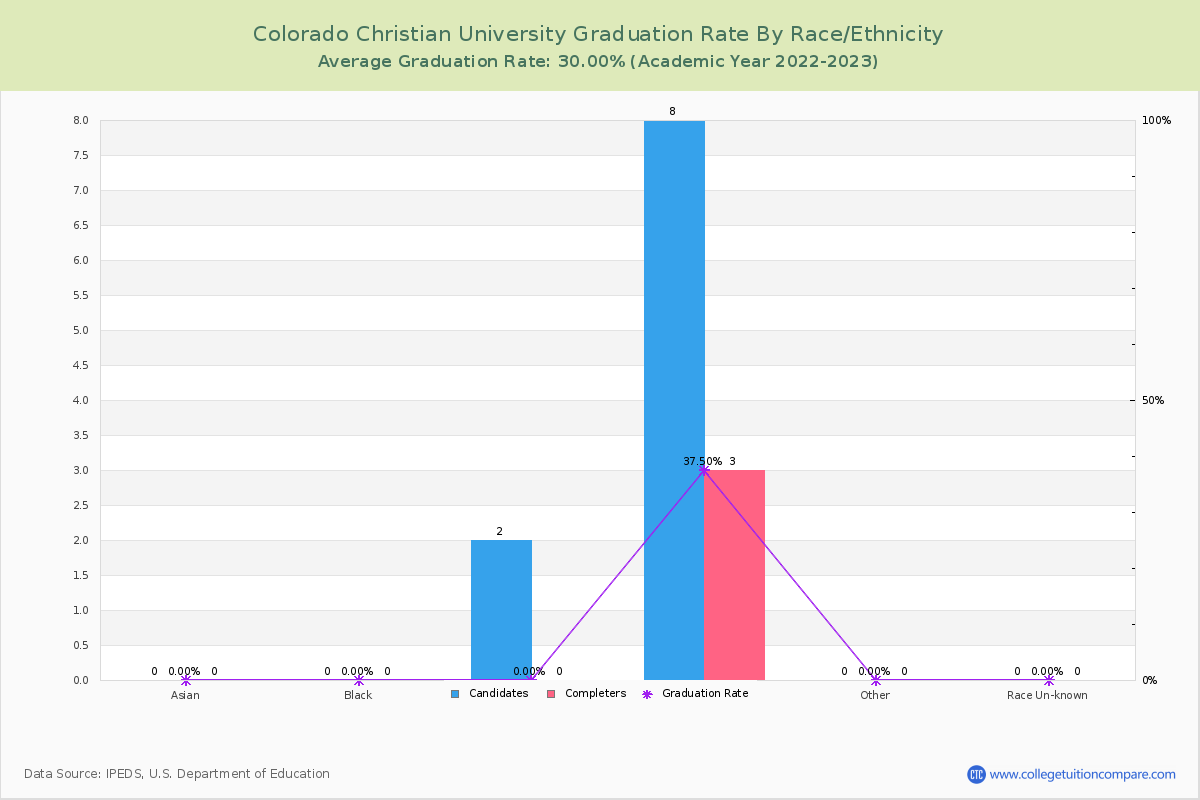
Graduation Rate By Race/Ethnicity
The following table shows graduation rate by race and at Colorado Christian University.
- American Indian or Alaska Native: 0.00%
- Asian: 71.43%
- Black (Non-Hispanic): 33.33%
- Hispanic: 44.00%
- White: 57.79%
- Two or More Race: 40.00%
- Unknown: 66.67%
| Total | Male | Female | |
|---|---|---|---|
| American Indian or Alaska Native | 0.00%(-/1) | - | - |
| Asian | 71.43%(5/7) | 80.00%(4/5) | 50.00%(1/2) |
| Black (Non-Hispanic) | 33.33%(2/6) | 40.00%(2/5) | - |
| Hispanic | 44.00%(22/50) | 42.11%(8/19) | 45.16%(14/31) |
| White | 57.79%(178/308) | 52.38%(55/105) | 60.59%(123/203) |
| Two or More Race | 40.00%(4/10) | 25.00%(1/4) | 50.00%(3/6) |
| Unknown | 66.67%(2/3) | 100.00%(1/1) | 50.00%(1/2) |
Ratings & Review
Share your experiences and thoughts about Colorado Christian University. It will be a great help to applicants and prospective students!