How many students at FLC? For the academic year 2023-2024, total of 3,413 students have enrolled in Fort Lewis College with 3,313 undergraduate and 100 graduate students.
By gender, 1,585 male and 1,828 female students are attending the school.
It has relatively many students compared to similar colleges (3,091 students in average - public Baccalaureate College - Diverse Fields).
2 students are enrolled exclusively, and 262 students are enrolled in some online courses.
You can check the student demographics by gender ratio, race/ethnicity, age distribution, and online enrollment.
Student Population by Gender
Fort Lewis College has a total of 3,413 enrolled students for the academic year 2023-2024. 3,313 students have enrolled in undergraduate programs and 100 students joined graduate programs.
By gender, 1,585 male and 1,828 female students (the male-female ratio is 46:54) are attending the school. The gender distribution is based on the 2023-2024 data.
| Total | Undergraduate | Graduate | |
|---|---|---|---|
| Total | 3,413 | 3,313 | 100 |
| Men | 1,585 | 1,565 | 20 |
| Women | 1,828 | 1,748 | 80 |
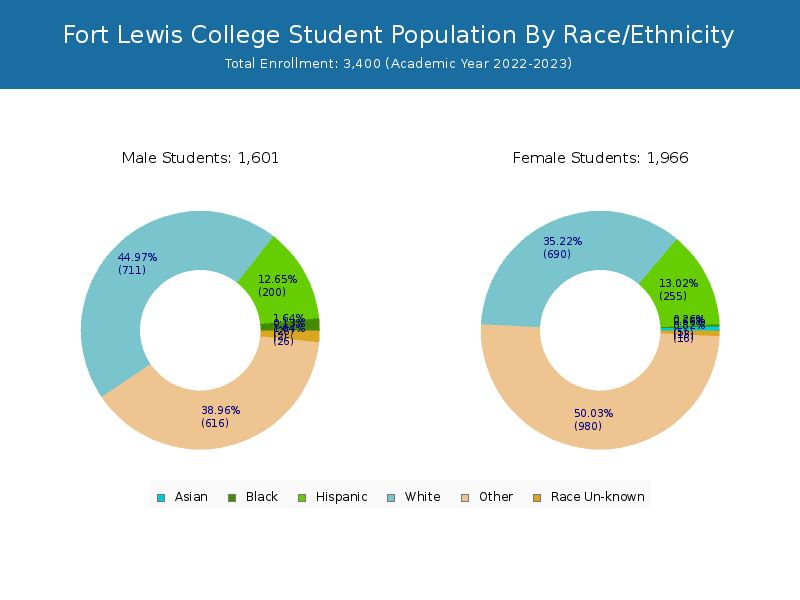
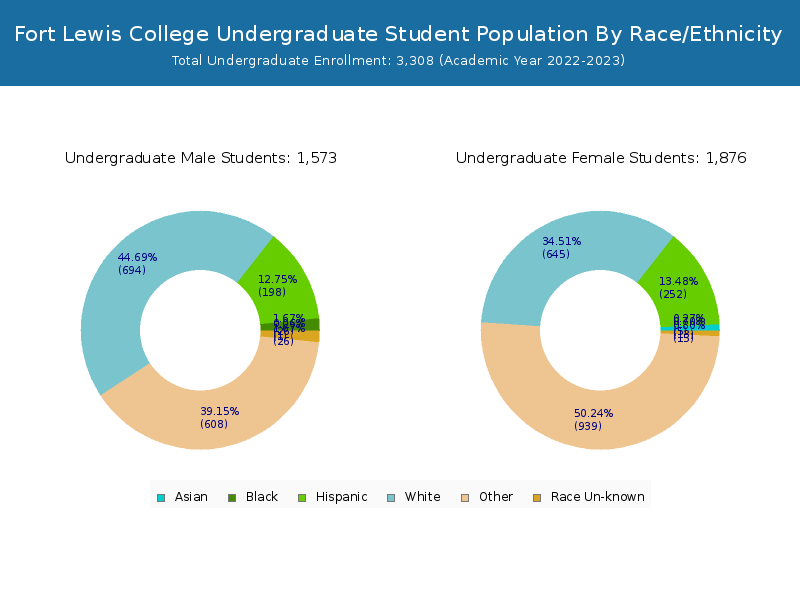
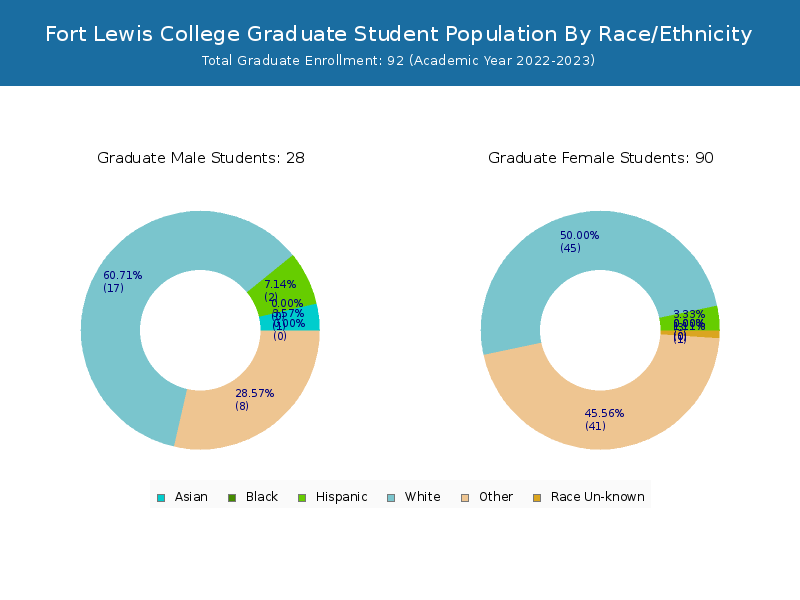
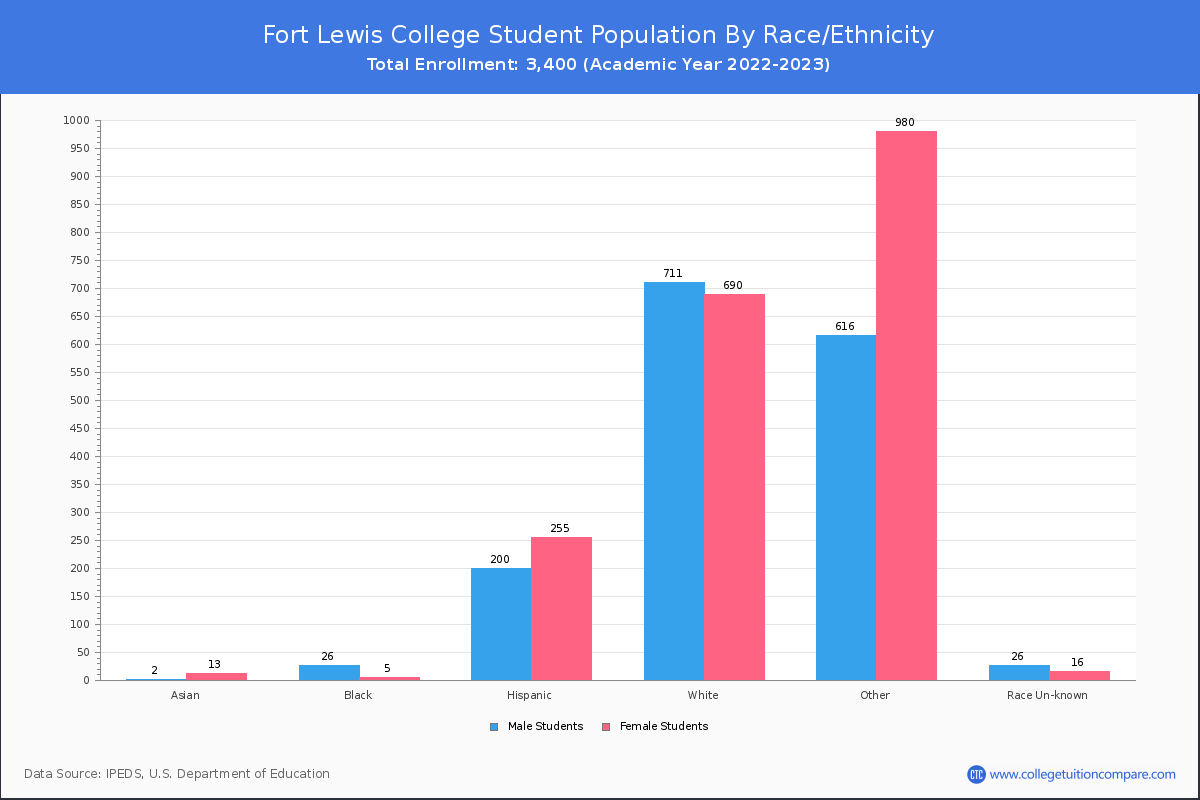
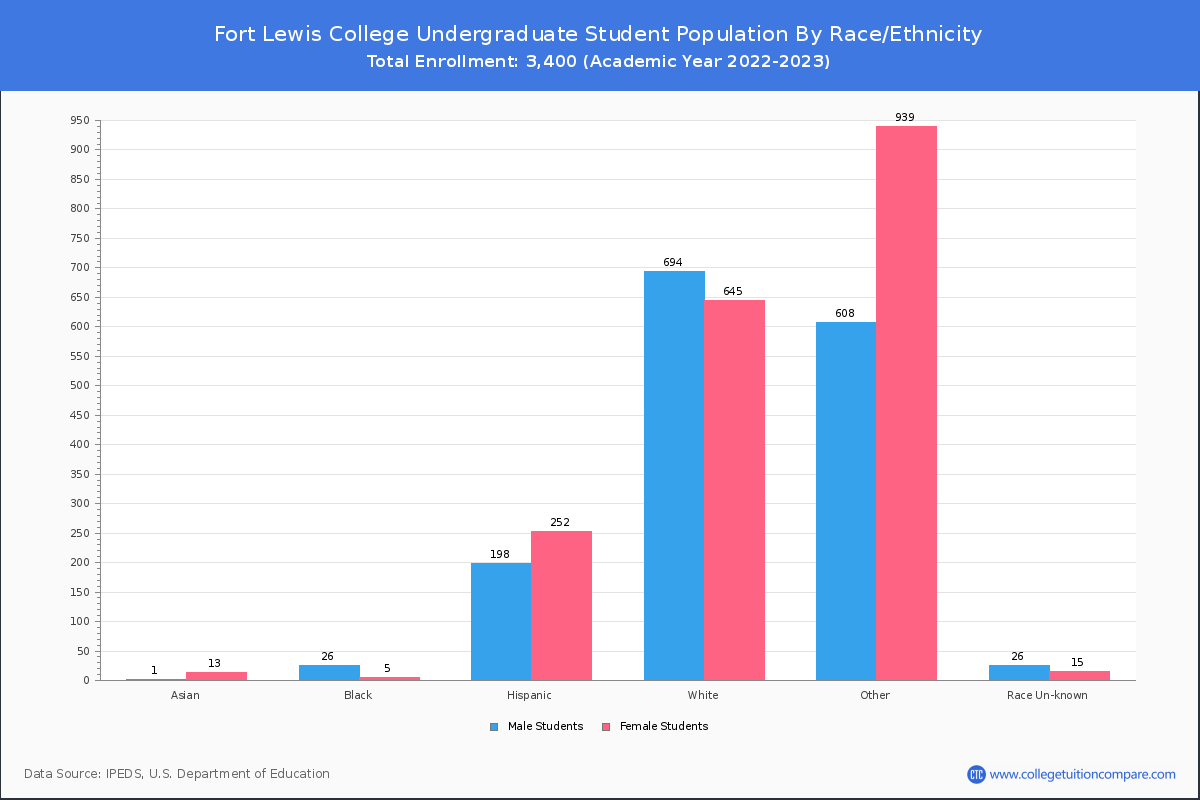
Student Distribution by Race/Ethnicity
By race/ethnicity, 1,504 White, 41 Black, and 16 Asian students out of a total of 3,413 are attending at Fort Lewis College. Comprehensive enrollment statistic data by race/ethnicity is shown in chart below (academic year 2023-2024 data).
| Race | Total | Men | Women |
|---|---|---|---|
| American Indian or Native American | 922 | 358 | 564 |
| Asian | 16 | 8 | 8 |
| Black | 41 | 37 | 4 |
| Hispanic | 492 | 219 | 273 |
| Native Hawaiian or Other Pacific Islanders | 5 | 5 | 0 |
| White | 1,504 | 739 | 765 |
| Two or more races | 387 | 191 | 196 |
| Race Unknown | 13 | 8 | 5 |
| Race | Total | Men | Women |
|---|---|---|---|
| American Indian or Native American | 887 | 351 | 536 |
| Asian | 16 | 8 | 8 |
| Black | 39 | 35 | 4 |
| Hispanic | 483 | 219 | 264 |
| Native Hawaiian or Other Pacific Islanders | 5 | 5 | 0 |
| White | 1,459 | 728 | 731 |
| Two or more races | 379 | 191 | 188 |
| Race Unknown | 13 | 8 | 5 |
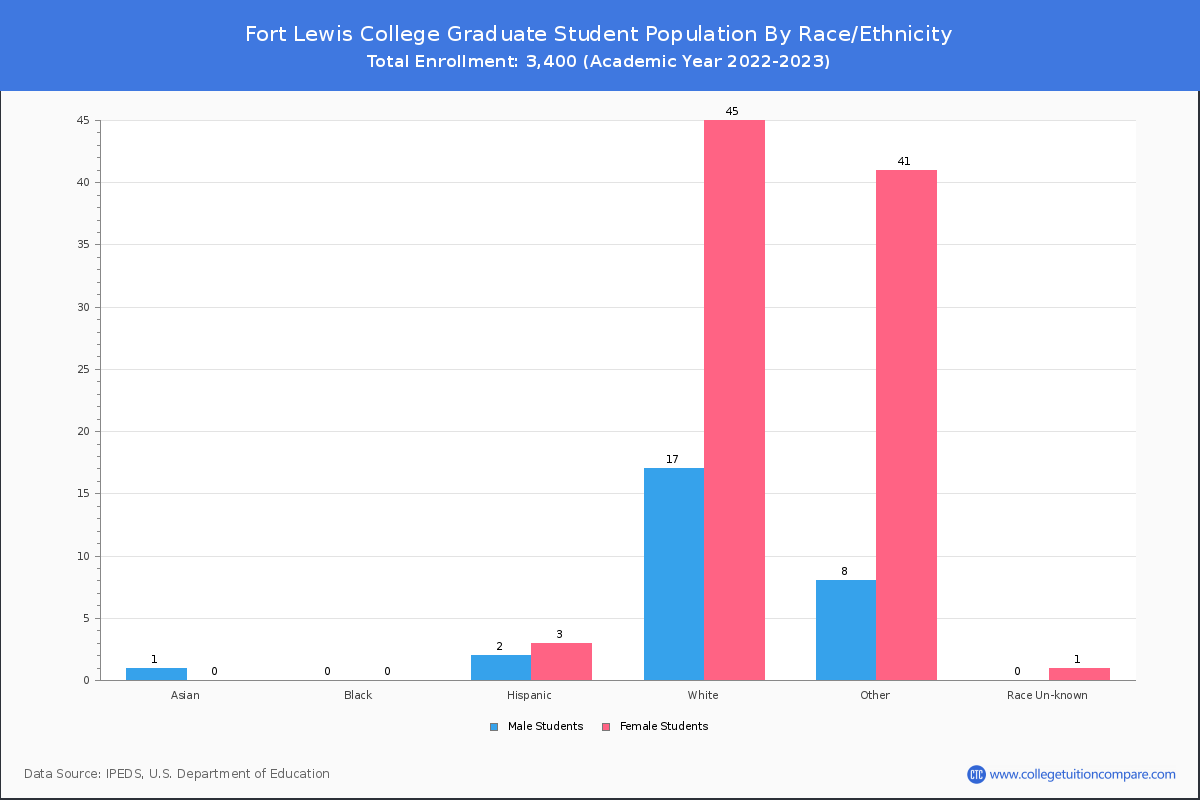
| Race | Total | Men | Women |
|---|---|---|---|
| American Indian or Native American | 35 | 7 | 28 |
| Asian | - | - | - |
| Black | 2 | 2 | 0 |
| Hispanic | 9 | 0 | 9 |
| Native Hawaiian or Other Pacific Islanders | - | - | - |
| White | 45 | 11 | 34 |
| Two or more races | 8 | 0 | 8 |
| Race Unknown | - | - | - |
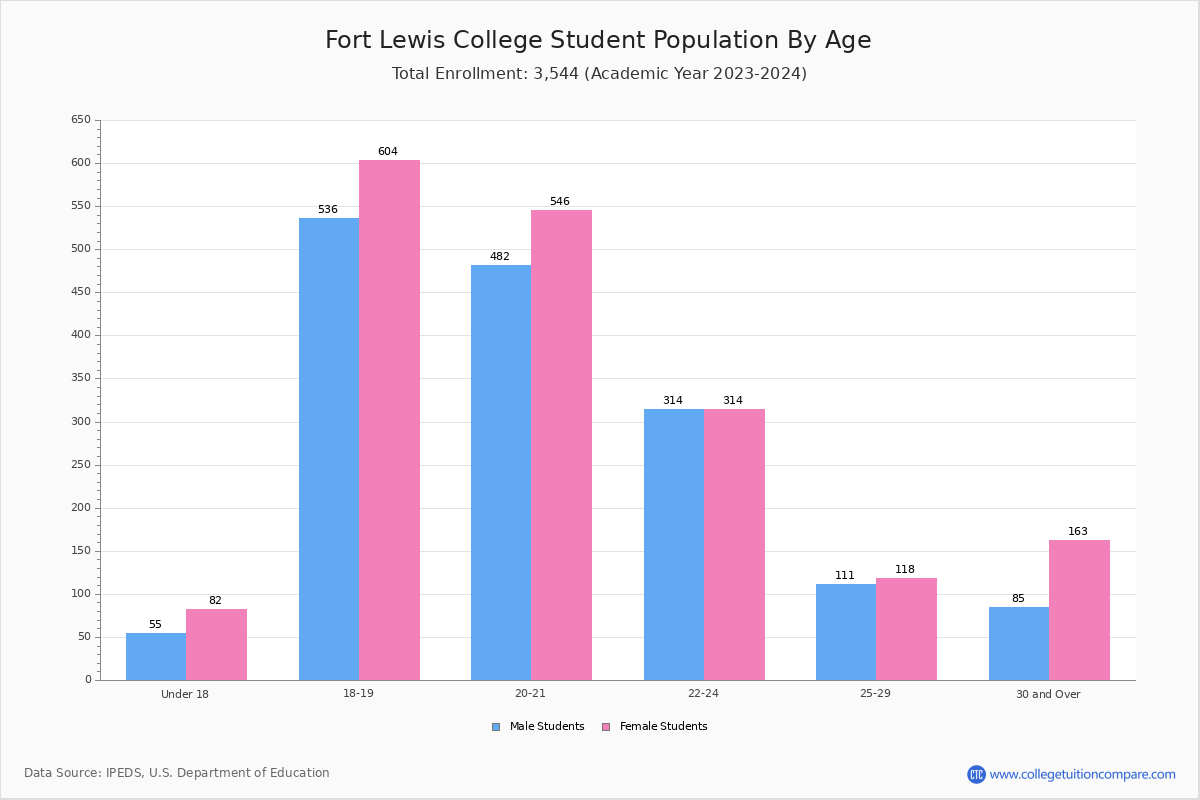
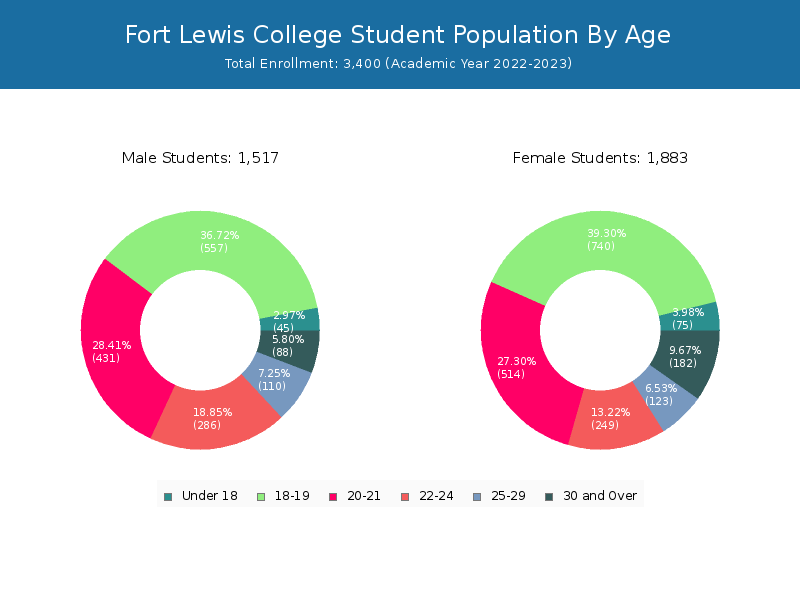
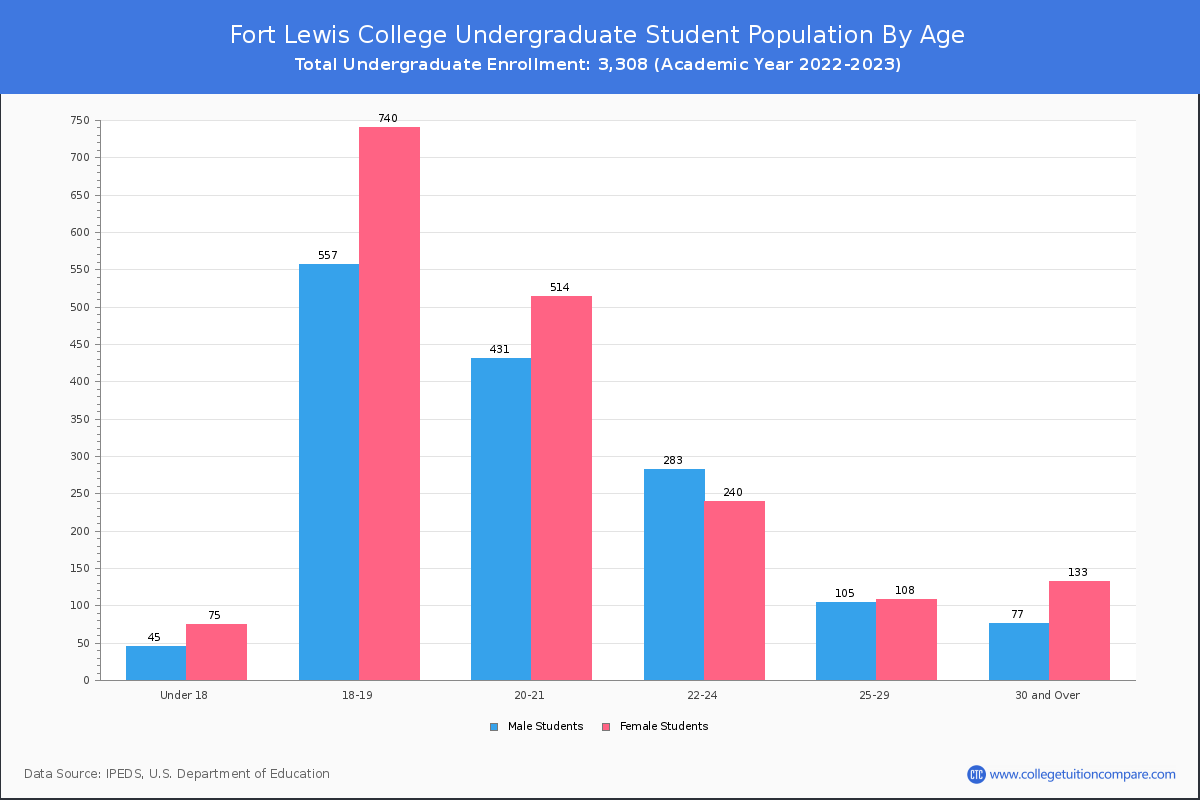
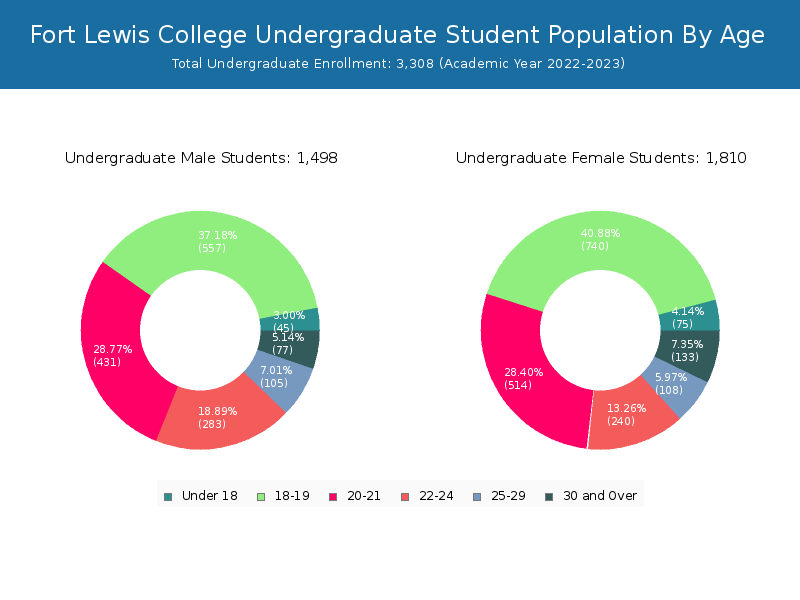
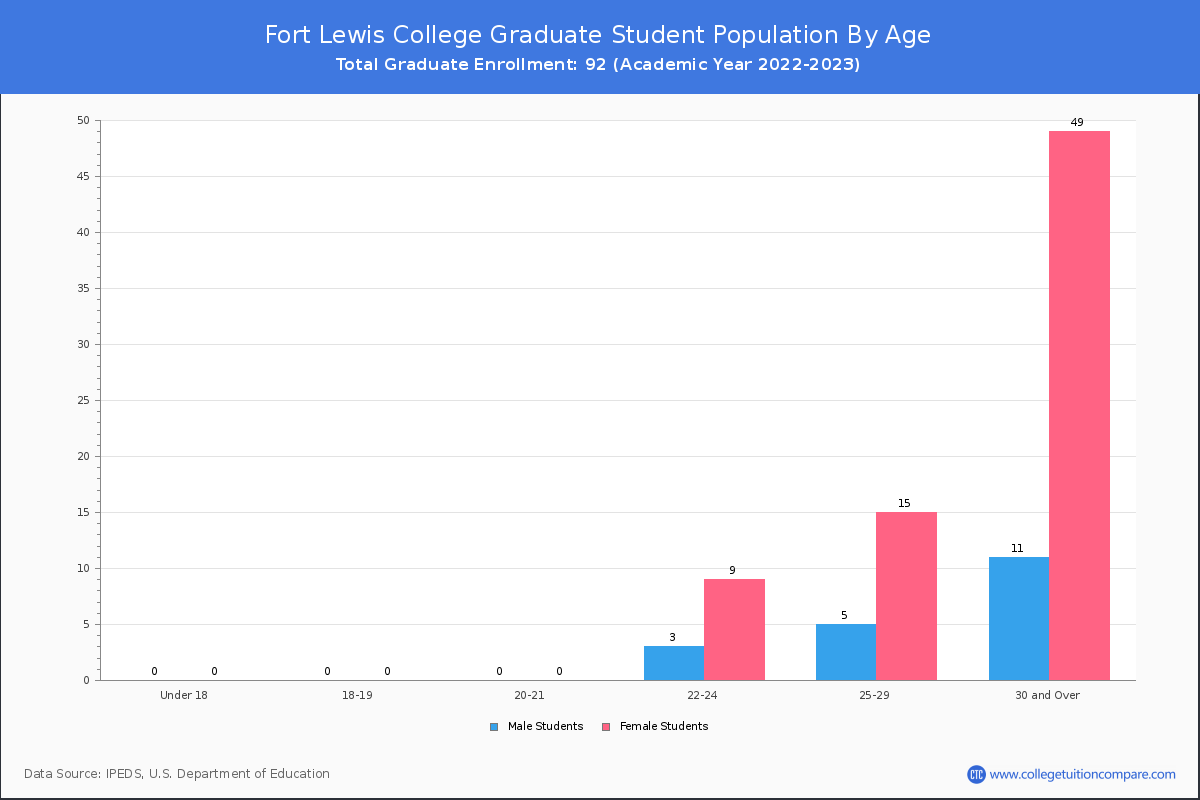
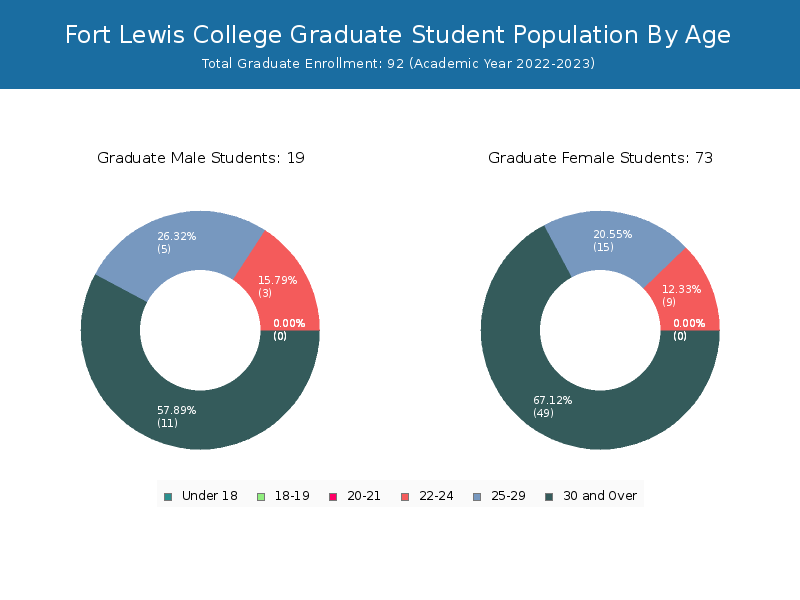
Student Age Distribution
By age, FLC has 137 students under 18 years old and 4 students over 65 years old. There are 2,933 students under 25 years old, and 477 students over 25 years old out of 3,413 total students.
In undergraduate programs, 137 students are younger than 18 and 2 students are older than 65. FLC has 2,923 undergraduate students aged under 25 and 387 students aged 25 and over.
It has 10 graduate students aged under 25 and 90 students aged 25 and over.
| Age | Total | Men | Women |
|---|---|---|---|
| Under 18 | 137 | 82 | 55 |
| 18-19 | 1,140 | 604 | 536 |
| 20-21 | 1,028 | 546 | 482 |
| 22-24 | 628 | 314 | 314 |
| 25-29 | 229 | 118 | 111 |
| 30-34 | 84 | 51 | 33 |
| 35-39 | 57 | 36 | 21 |
| 40-49 | 65 | 44 | 21 |
| 50-64 | 38 | 28 | 10 |
| Over 65 | 4 | 4 | 0 |
| Age | Total | Men | Women |
|---|---|---|---|
| Under 18 | 137 | 82 | 55 |
| 18-19 | 1,140 | 604 | 536 |
| 20-21 | 1,028 | 546 | 482 |
| 22-24 | 618 | 306 | 312 |
| 25-29 | 204 | 102 | 102 |
| 30-34 | 70 | 41 | 29 |
| 35-39 | 48 | 27 | 21 |
| 40-49 | 46 | 27 | 19 |
| 50-64 | 17 | 10 | 7 |
| Over 65 | 2 | 2 | 0 |
| Age | Total | Men | Women |
|---|---|---|---|
| 22-24 | 10 | 8 | 2 |
| 25-29 | 25 | 16 | 9 |
| 30-34 | 14 | 10 | 4 |
| 35-39 | 9 | 9 | 0 |
| 40-49 | 19 | 17 | 2 |
| 50-64 | 21 | 18 | 3 |
| Over 65 | 2 | 2 | 0 |
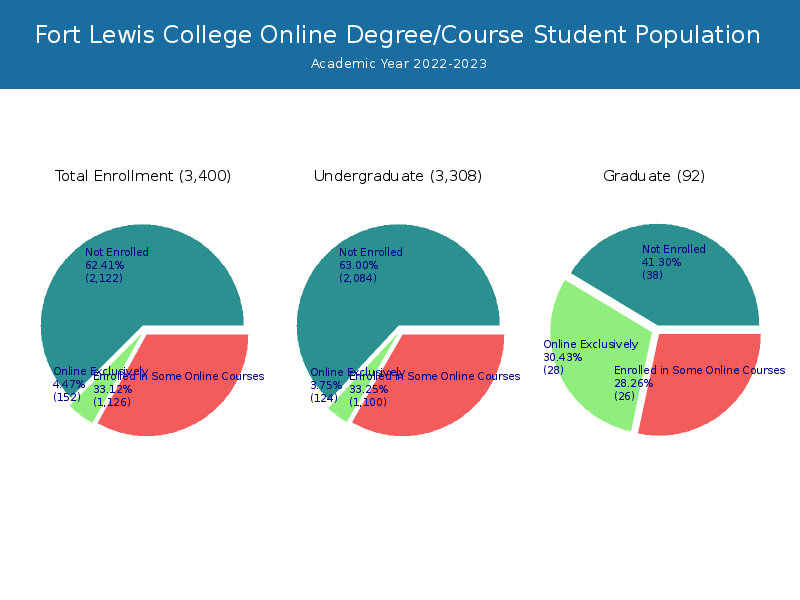
Online Student Enrollment
Distance learning, also called online education, is very attractive to students, especially who want to continue education and work in field. At Fort Lewis College, 2 students are enrolled exclusively in online courses and 262 students are enrolled in some online courses.
| All Students | Enrolled Exclusively Online Courses | Enrolled in Some Online Courses | |
|---|---|---|---|
| All Students | 3,413 | 2 | 262 |
| Undergraduate | 3,313 | 2 | 262 |
| Graduate | 100 | 0 | 0 |
| Colorado Residents | Other States in U.S. | Outside of U.S. | |
|---|---|---|---|
| All Students | 0 | 2 | 0 |
| Undergraduate | 0 | 2 | 0 |
| Graduate | - | - | - |
Transfer-in Students (Undergraduate)
Among 3,313 enrolled in undergraduate programs, 199 students have transferred-in from other institutions. The percentage of transfer-in students is 6.01%.185 students have transferred in as full-time status and 14 students transferred in as part-time status.
| Number of Students | |
|---|---|
| Regular Full-time | 2,641 |
| Transfer-in Full-time | 185 |
| Regular Part-time | 473 |
| Transfer-in Part-time | 14 |
Ratings & Review
Share your experiences and thoughts about Fort Lewis College. It will be a great help to applicants and prospective students!