How many students at Naropa? For the academic year 2023-2024, total of 1,117 students have enrolled in Naropa University with 368 undergraduate and 749 graduate students.
By gender, 298 male and 819 female students are attending the school.
It has much fewer students compared to similar colleges (1,993 students in average - private (not-for-profit) Master's College and University (medium programs)).
379 students are enrolled exclusively, and 154 students are enrolled in some online courses.
You can check the student demographics by gender ratio, race/ethnicity, age distribution, and online enrollment.
Student Population by Gender
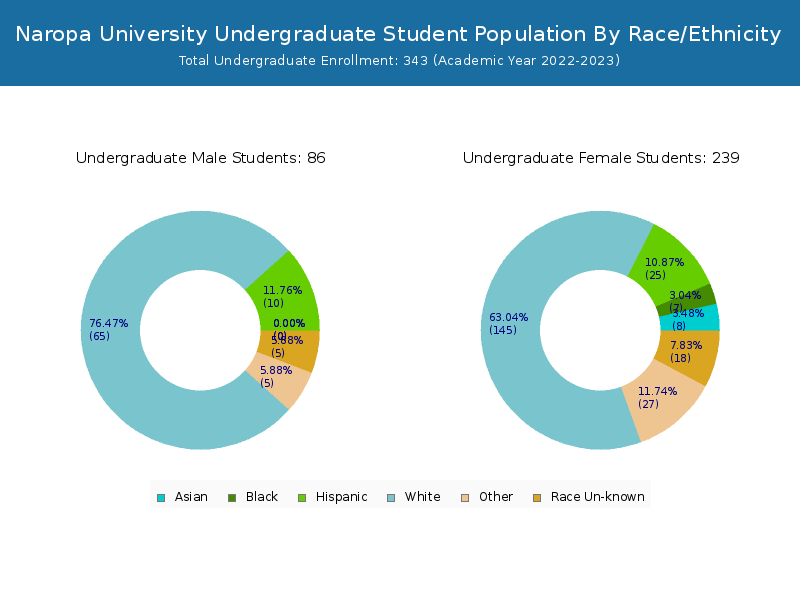
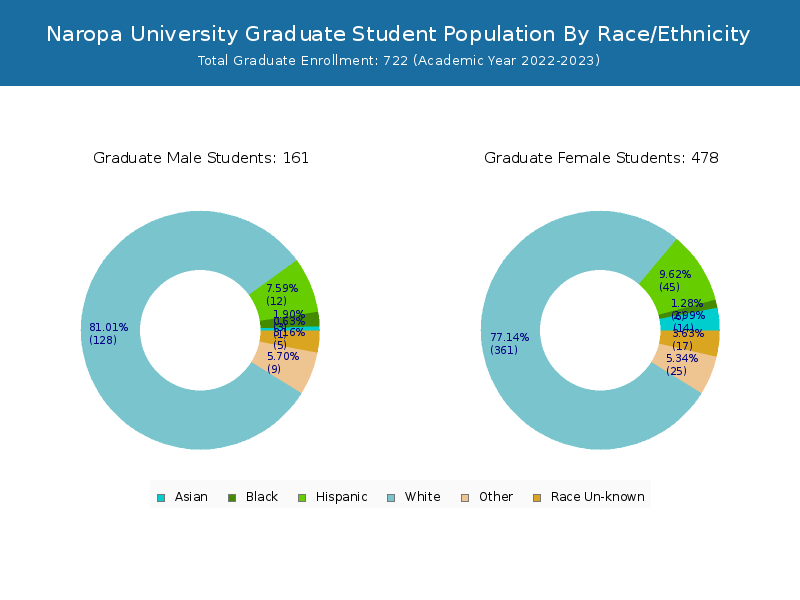
Naropa University has a total of 1,117 enrolled students for the academic year 2023-2024. 368 students have enrolled in undergraduate programs and 749 students joined graduate programs.
By gender, 298 male and 819 female students (the male-female ratio is 27:73) are attending the school. The gender distribution is based on the 2023-2024 data.
| Total | Undergraduate | Graduate | |
|---|---|---|---|
| Total | 1,117 | 368 | 749 |
| Men | 298 | 106 | 192 |
| Women | 819 | 262 | 557 |
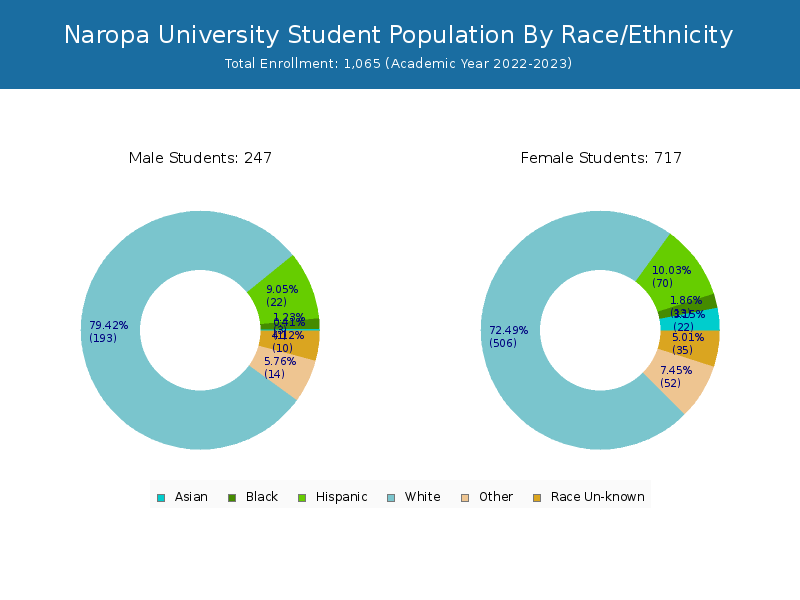
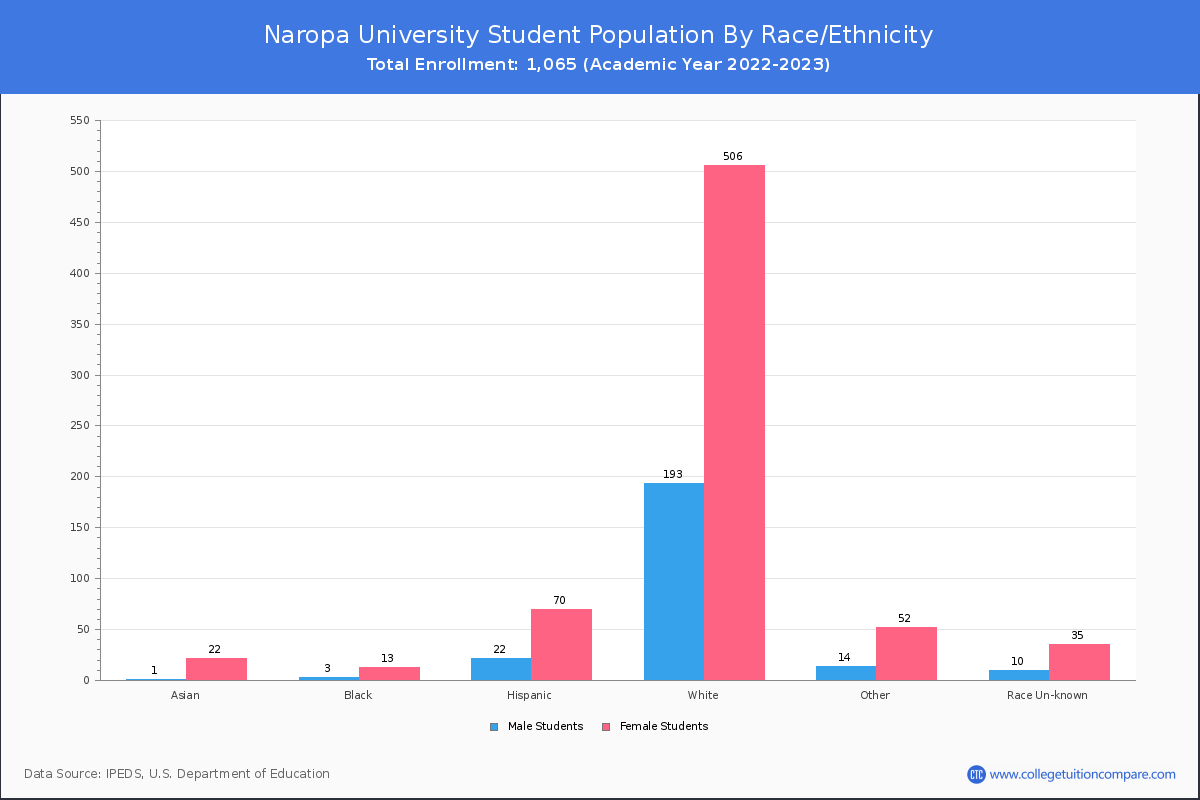
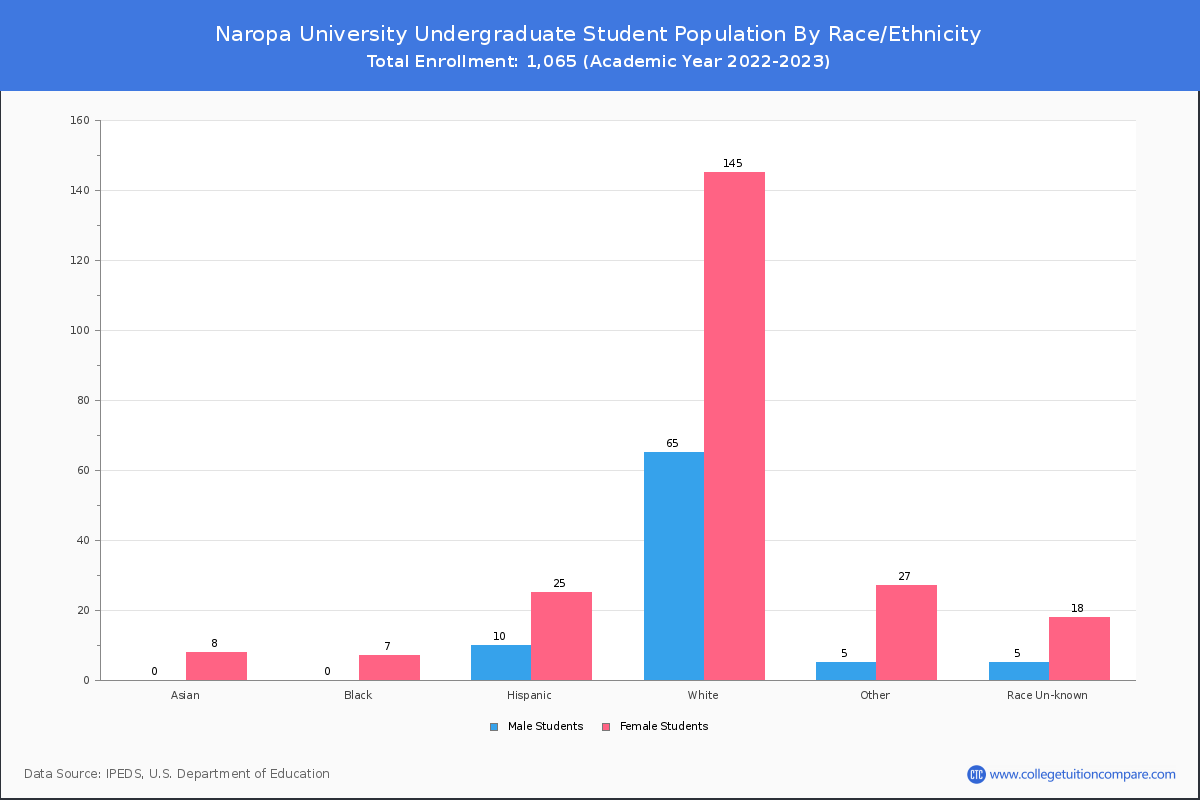
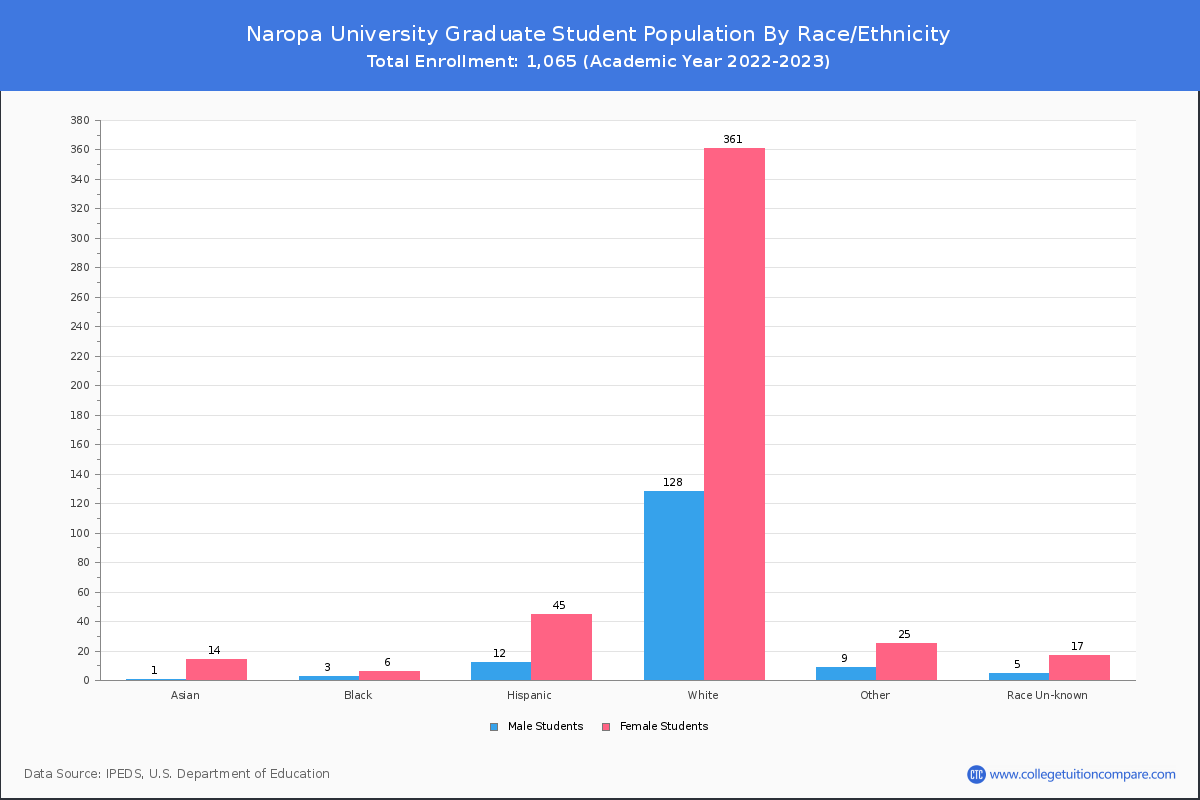
Student Distribution by Race/Ethnicity
By race/ethnicity, 780 White, 23 Black, and 29 Asian students out of a total of 1,117 are attending at Naropa University. Comprehensive enrollment statistic data by race/ethnicity is shown in chart below (academic year 2023-2024 data).
| Race | Total | Men | Women |
|---|---|---|---|
| American Indian or Native American | 1 | 0 | 1 |
| Asian | 29 | 4 | 25 |
| Black | 23 | 6 | 17 |
| Hispanic | 103 | 26 | 77 |
| Native Hawaiian or Other Pacific Islanders | 1 | 0 | 1 |
| White | 780 | 211 | 569 |
| Two or more races | 65 | 17 | 48 |
| Race Unknown | 86 | 28 | 58 |
| Race | Total | Men | Women |
|---|---|---|---|
| American Indian or Native American | 1 | 0 | 1 |
| Asian | 9 | 1 | 8 |
| Black | 8 | 2 | 6 |
| Hispanic | 44 | 13 | 31 |
| Native Hawaiian or Other Pacific Islanders | - | - | - |
| White | 239 | 65 | 174 |
| Two or more races | 28 | 11 | 17 |
| Race Unknown | 29 | 11 | 18 |
| Race | Total | Men | Women |
|---|---|---|---|
| American Indian or Native American | - | - | - |
| Asian | 20 | 3 | 17 |
| Black | 15 | 4 | 11 |
| Hispanic | 59 | 13 | 46 |
| Native Hawaiian or Other Pacific Islanders | 1 | 0 | 1 |
| White | 541 | 146 | 395 |
| Two or more races | 37 | 6 | 31 |
| Race Unknown | 57 | 17 | 40 |
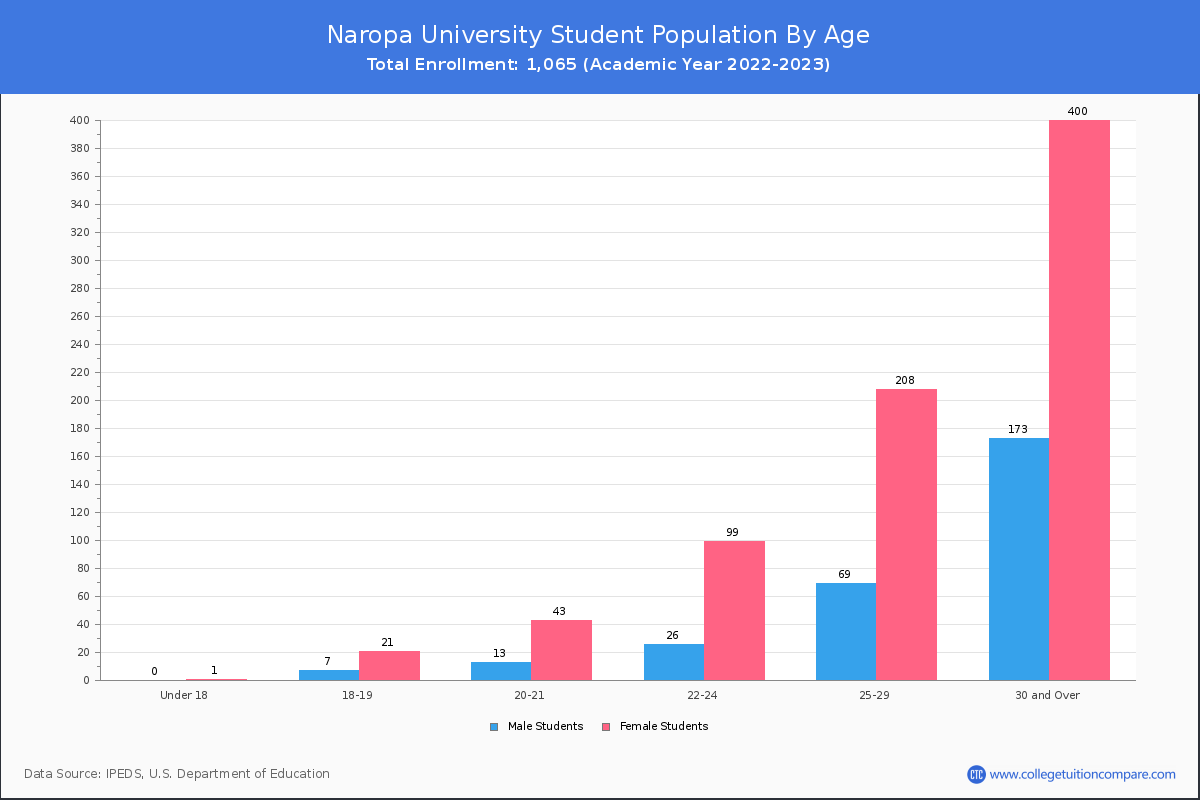
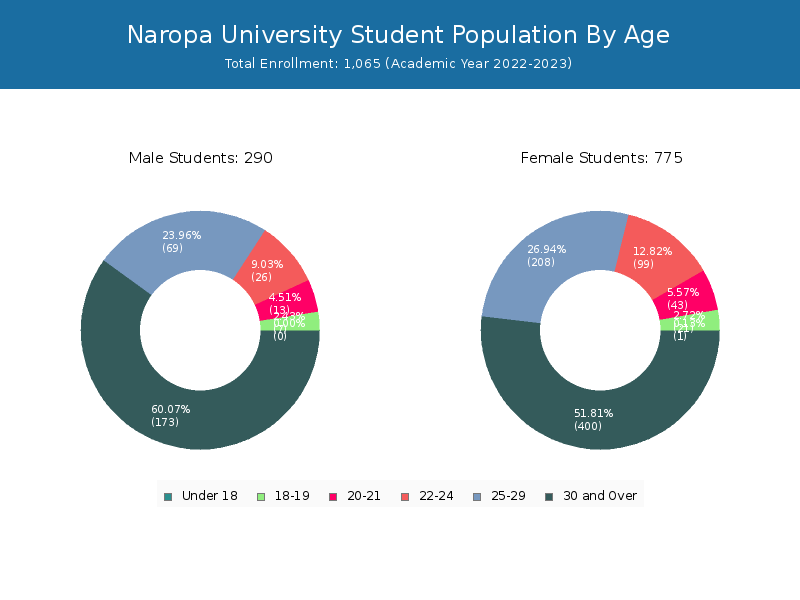
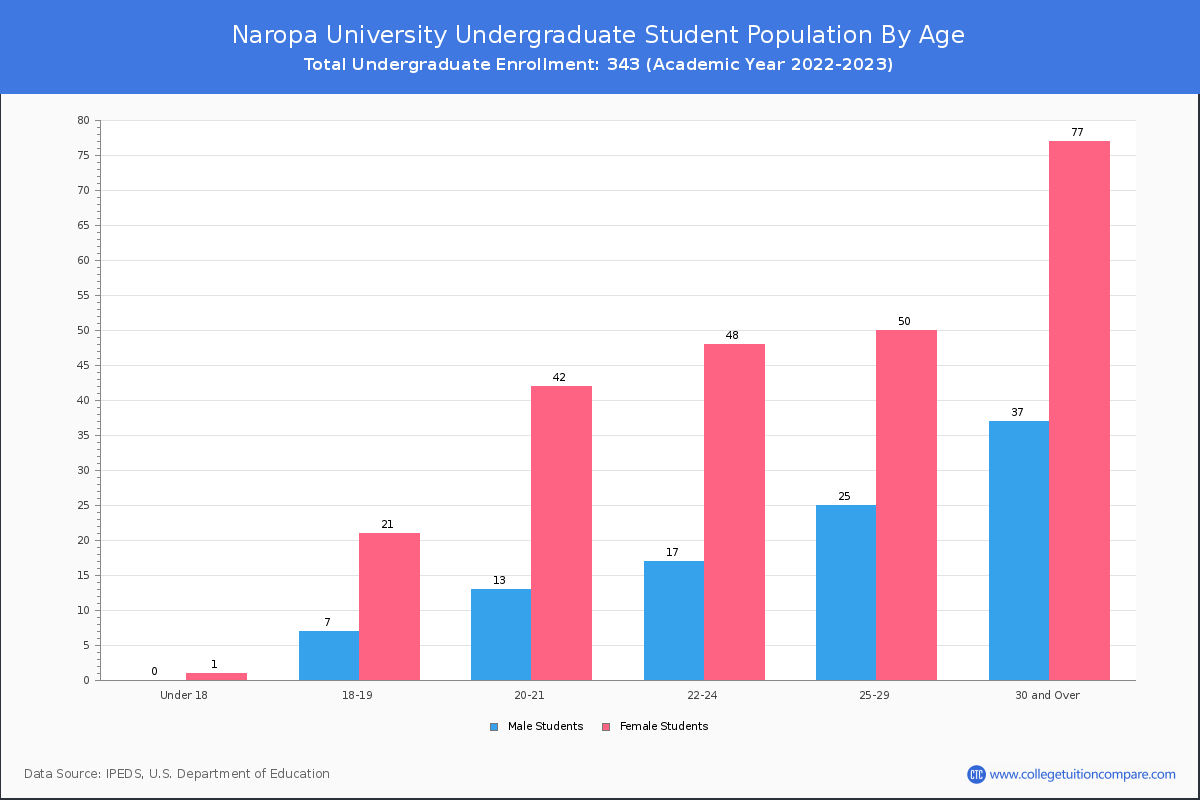
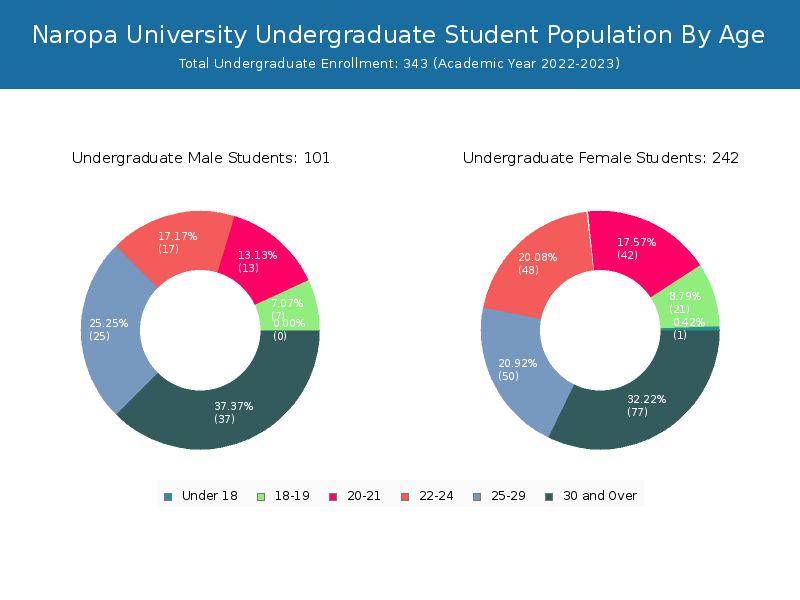
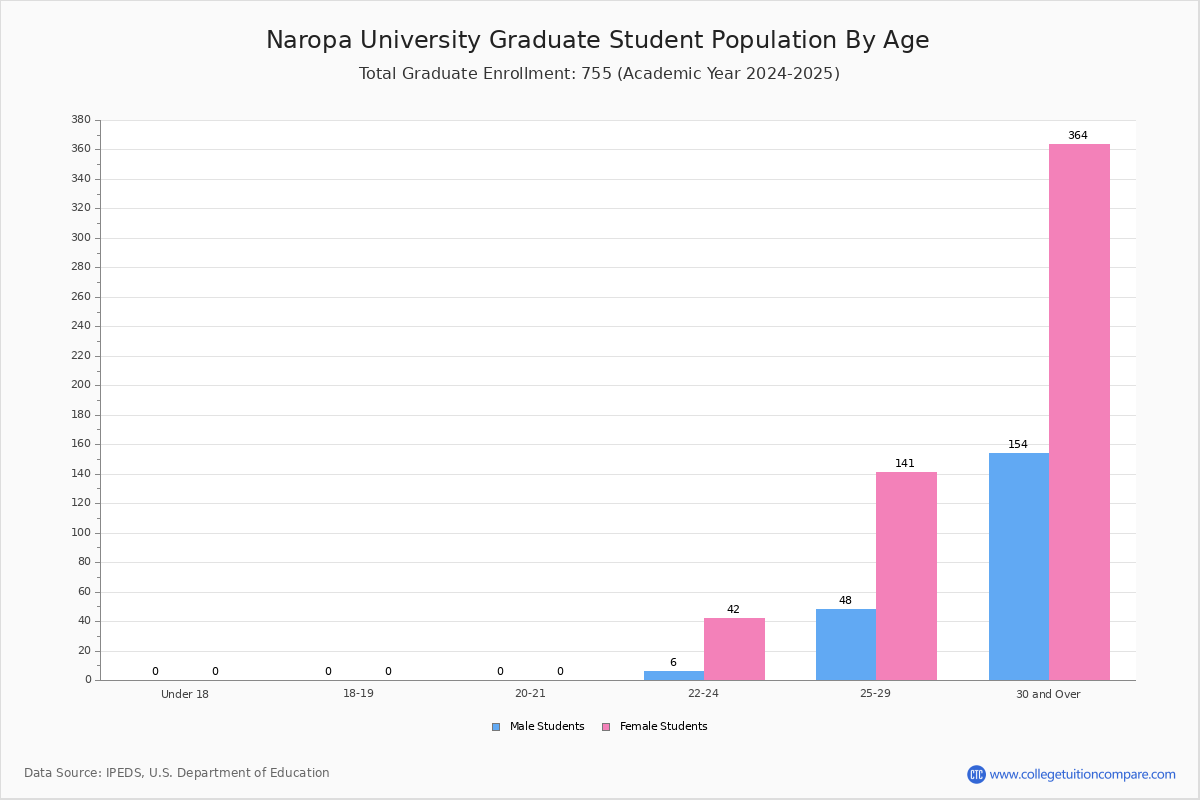
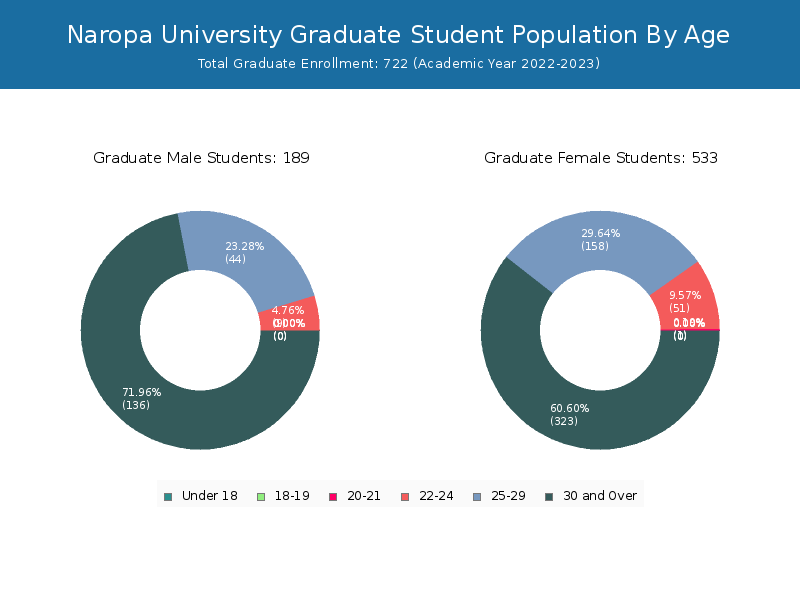
Student Age Distribution
By age, Naropa has 1 students under 18 years old and 1 students over 65 years old. There are 205 students under 25 years old, and 912 students over 25 years old out of 1,117 total students.
Naropa has 149 undergraduate students aged under 25 and 219 students aged 25 and over.
It has 56 graduate students aged under 25 and 693 students aged 25 and over.
| Age | Total | Men | Women |
|---|---|---|---|
| Under 18 | 1 | 1 | 0 |
| 18-19 | 18 | 14 | 4 |
| 20-21 | 66 | 48 | 18 |
| 22-24 | 120 | 97 | 23 |
| 25-29 | 272 | 209 | 63 |
| 30-34 | 241 | 169 | 72 |
| 35-39 | 150 | 94 | 56 |
| 40-49 | 161 | 118 | 43 |
| 50-64 | 87 | 68 | 19 |
| Over 65 | 1 | 1 | 0 |
| Age | Total | Men | Women |
|---|---|---|---|
| Under 18 | 1 | 1 | 0 |
| 18-19 | 18 | 14 | 4 |
| 20-21 | 64 | 46 | 18 |
| 22-24 | 66 | 50 | 16 |
| 25-29 | 71 | 52 | 19 |
| 30-34 | 63 | 42 | 21 |
| 35-39 | 33 | 19 | 14 |
| 40-49 | 31 | 20 | 11 |
| 50-64 | 21 | 18 | 3 |
| Age | Total | Men | Women |
|---|---|---|---|
| 20-21 | 2 | 2 | 0 |
| 22-24 | 54 | 47 | 7 |
| 25-29 | 201 | 157 | 44 |
| 30-34 | 178 | 127 | 51 |
| 35-39 | 117 | 75 | 42 |
| 40-49 | 130 | 98 | 32 |
| 50-64 | 66 | 50 | 16 |
| Over 65 | 1 | 1 | 0 |
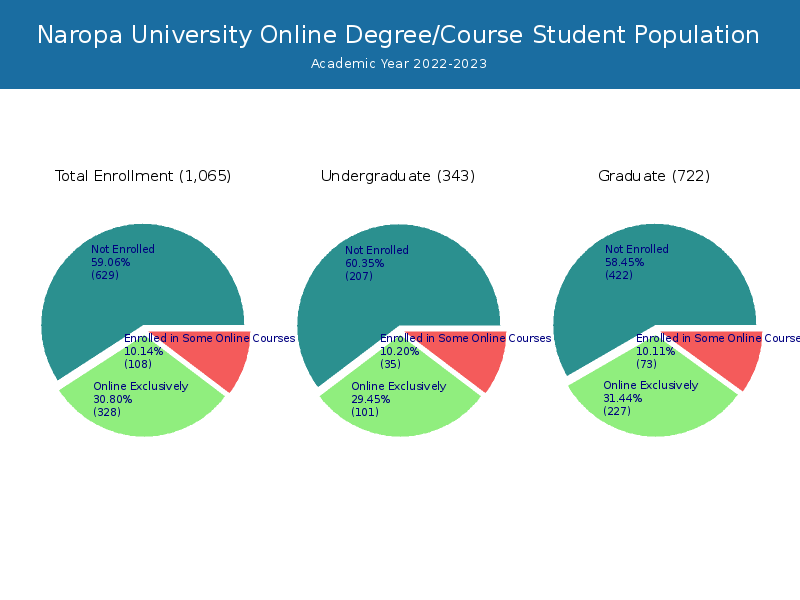
Online Student Enrollment
Distance learning, also called online education, is very attractive to students, especially who want to continue education and work in field. At Naropa University, 379 students are enrolled exclusively in online courses and 154 students are enrolled in some online courses.
121 students lived in Colorado or jurisdiction in which the school is located are enrolled exclusively in online courses and 258 students live in other State or outside of the United States.
| All Students | Enrolled Exclusively Online Courses | Enrolled in Some Online Courses | |
|---|---|---|---|
| All Students | 1,117 | 379 | 154 |
| Undergraduate | 368 | 139 | 67 |
| Graduate | 749 | 240 | 87 |
| Colorado Residents | Other States in U.S. | Outside of U.S. | |
|---|---|---|---|
| All Students | 121 | 255 | 3 |
| Undergraduate | 38 | 98 | 3 |
| Graduate | 83 | 157 | 0 |
Transfer-in Students (Undergraduate)
Among 368 enrolled in undergraduate programs, 83 students have transferred-in from other institutions. The percentage of transfer-in students is 22.55%.73 students have transferred in as full-time status and 10 students transferred in as part-time status.
| Number of Students | |
|---|---|
| Regular Full-time | 260 |
| Transfer-in Full-time | 73 |
| Regular Part-time | 25 |
| Transfer-in Part-time | 10 |
Ratings & Review
Share your experiences and thoughts about Naropa University. It will be a great help to applicants and prospective students!