How many students at GWU? For the academic year 2023-2024, total of 25,568 students have enrolled in George Washington University with 11,387 undergraduate and 14,181 graduate students.
By gender, 9,745 male and 15,823 female students are attending the school.
It has significantly more students compared to similar colleges (19,542 students in average - private (not-for-profit) Research University (very high research activity)).
4,508 students are enrolled exclusively, and 1,747 students are enrolled in some online courses.
You can check the student demographics by gender ratio, race/ethnicity, age distribution, and online enrollment.
Student Population by Gender
George Washington University has a total of 25,568 enrolled students for the academic year 2023-2024. 11,387 students have enrolled in undergraduate programs and 14,181 students joined graduate programs.
By gender, 9,745 male and 15,823 female students (the male-female ratio is 38:62) are attending the school. The gender distribution is based on the 2023-2024 data.
| Total | Undergraduate | Graduate | |
|---|---|---|---|
| Total | 25,568 | 11,387 | 14,181 |
| Men | 9,745 | 4,140 | 5,605 |
| Women | 15,823 | 7,247 | 8,576 |
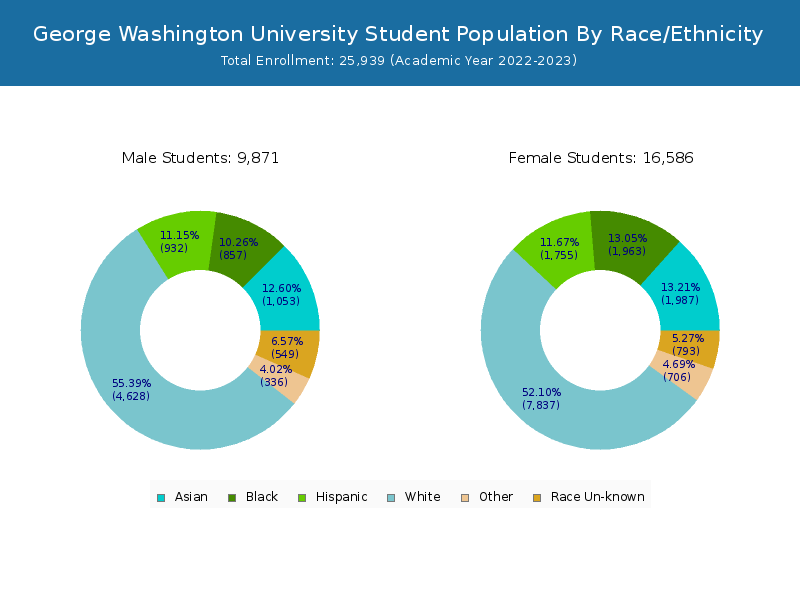
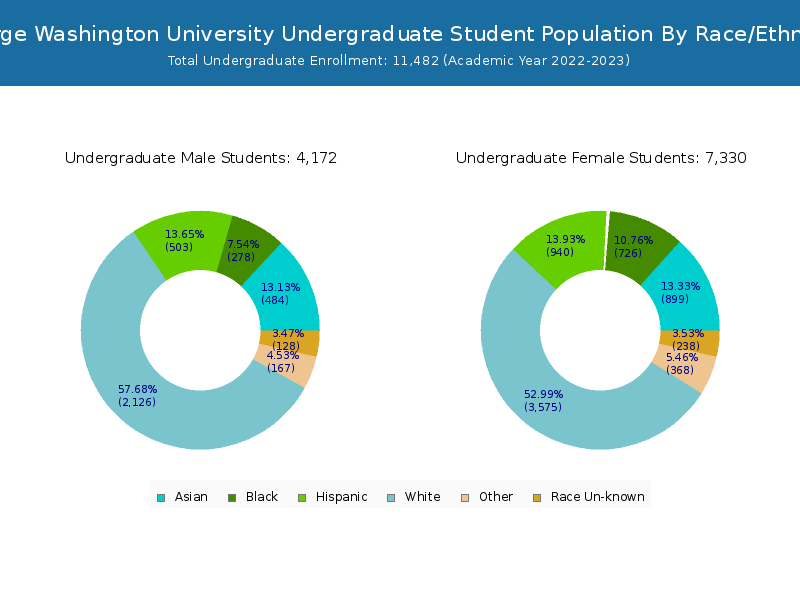
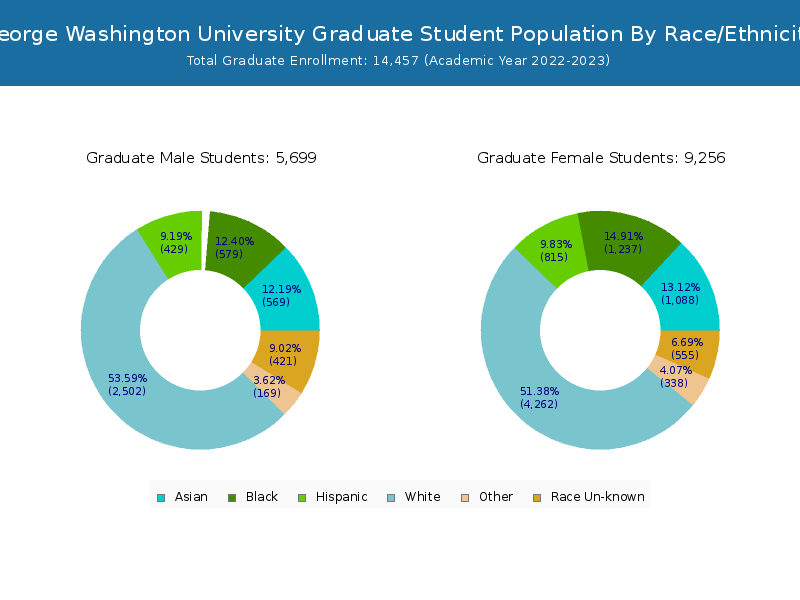
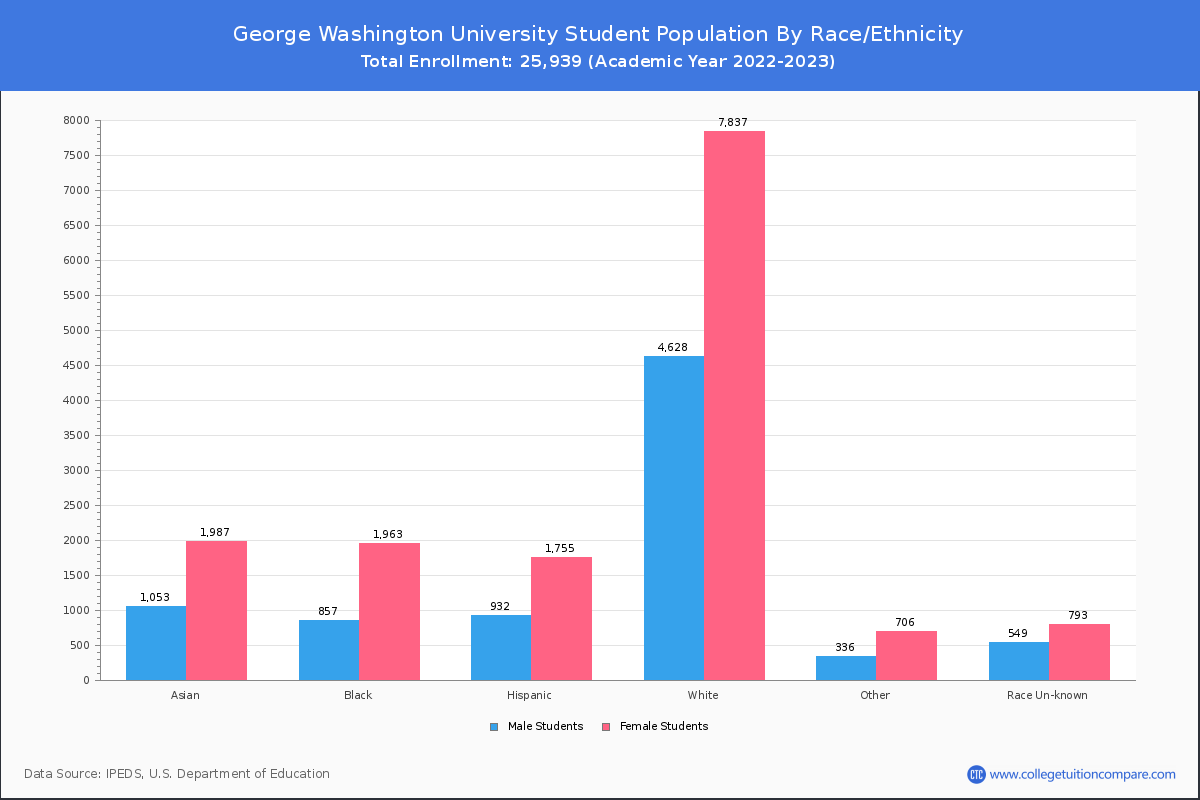
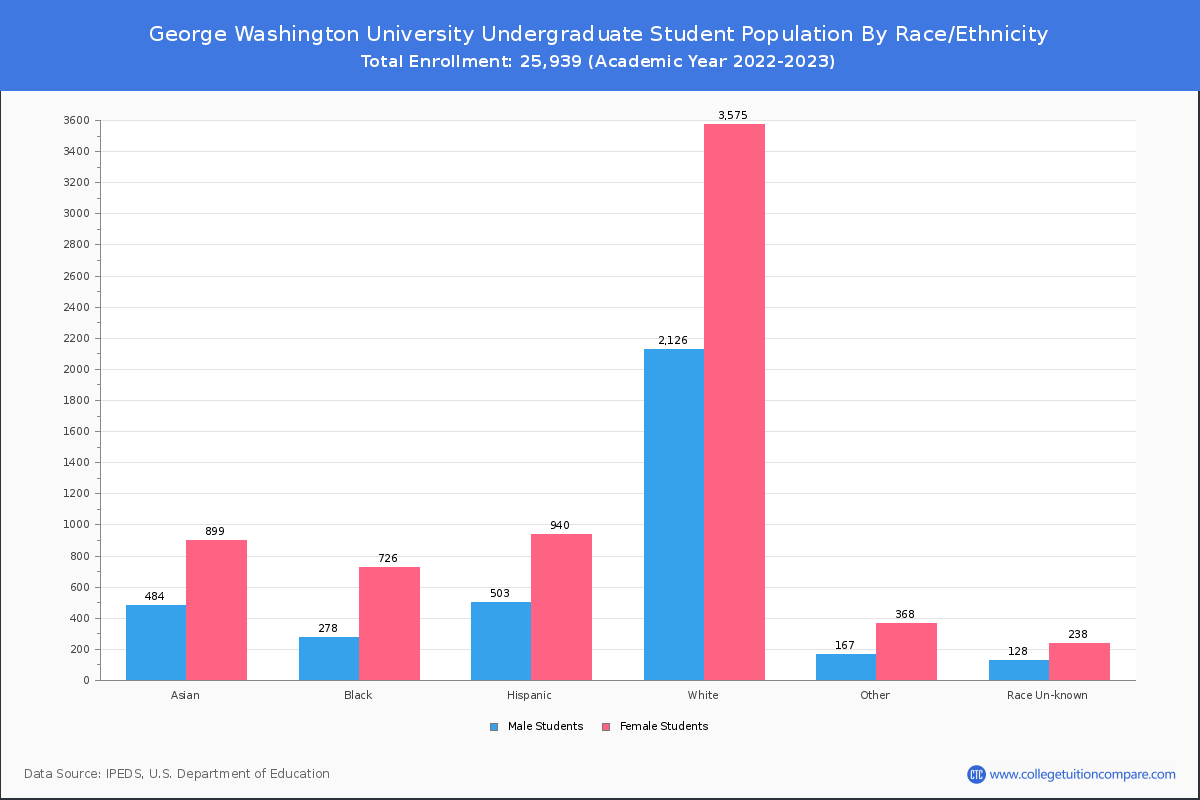
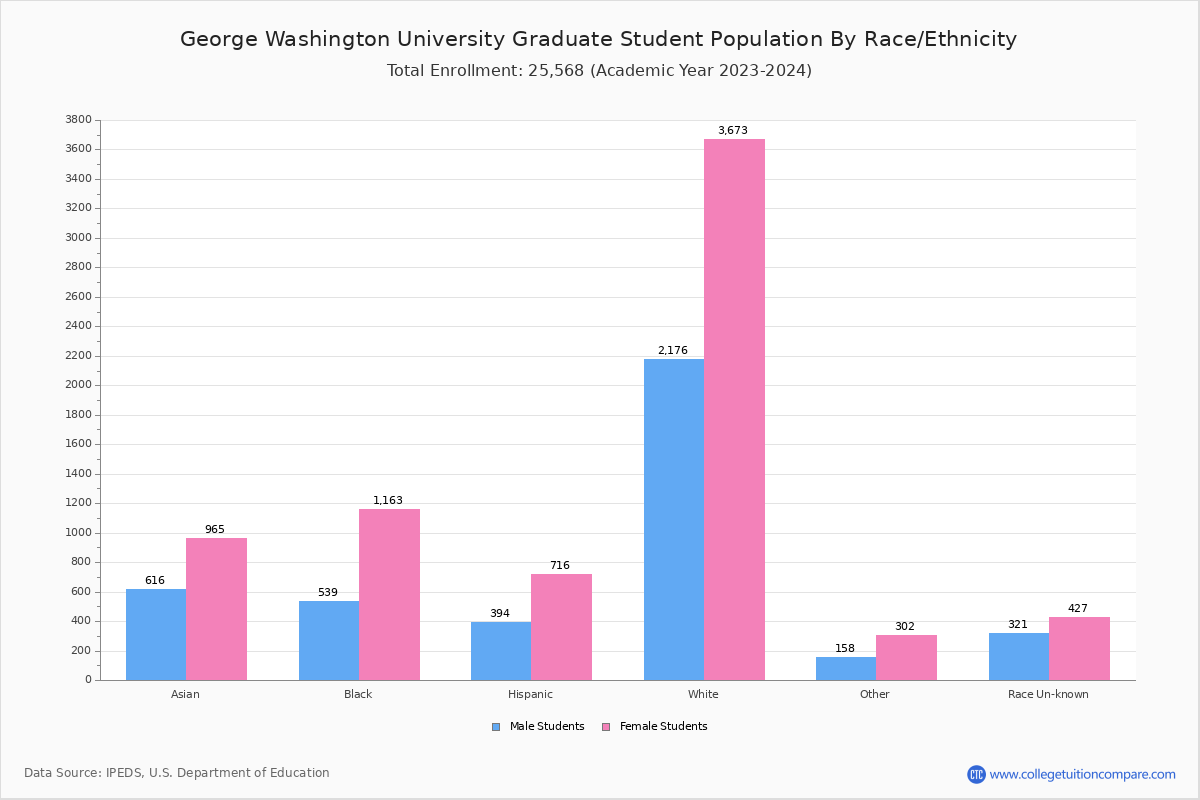
Student Distribution by Race/Ethnicity
By race/ethnicity, 11,338 White, 2,624 Black, and 3,255 Asian students out of a total of 25,568 are attending at George Washington University. Comprehensive enrollment statistic data by race/ethnicity is shown in chart below (academic year 2023-2024 data).
| Race | Total | Men | Women |
|---|---|---|---|
| American Indian or Native American | 30 | 13 | 17 |
| Asian | 3,255 | 1,205 | 2,050 |
| Black | 2,624 | 787 | 1,837 |
| Hispanic | 2,588 | 917 | 1,671 |
| Native Hawaiian or Other Pacific Islanders | 27 | 11 | 16 |
| White | 11,338 | 4,197 | 7,141 |
| Two or more races | 1,028 | 350 | 678 |
| Race Unknown | 1,010 | 416 | 594 |
| Race | Total | Men | Women |
|---|---|---|---|
| American Indian or Native American | 6 | 2 | 4 |
| Asian | 1,674 | 589 | 1,085 |
| Black | 922 | 248 | 674 |
| Hispanic | 1,478 | 523 | 955 |
| Native Hawaiian or Other Pacific Islanders | 9 | 3 | 6 |
| White | 5,489 | 2,021 | 3,468 |
| Two or more races | 610 | 211 | 399 |
| Race Unknown | 262 | 95 | 167 |
| Race | Total | Men | Women |
|---|---|---|---|
| American Indian or Native American | 24 | 11 | 13 |
| Asian | 1,581 | 616 | 965 |
| Black | 1,702 | 539 | 1,163 |
| Hispanic | 1,110 | 394 | 716 |
| Native Hawaiian or Other Pacific Islanders | 18 | 8 | 10 |
| White | 5,849 | 2,176 | 3,673 |
| Two or more races | 418 | 139 | 279 |
| Race Unknown | 748 | 321 | 427 |
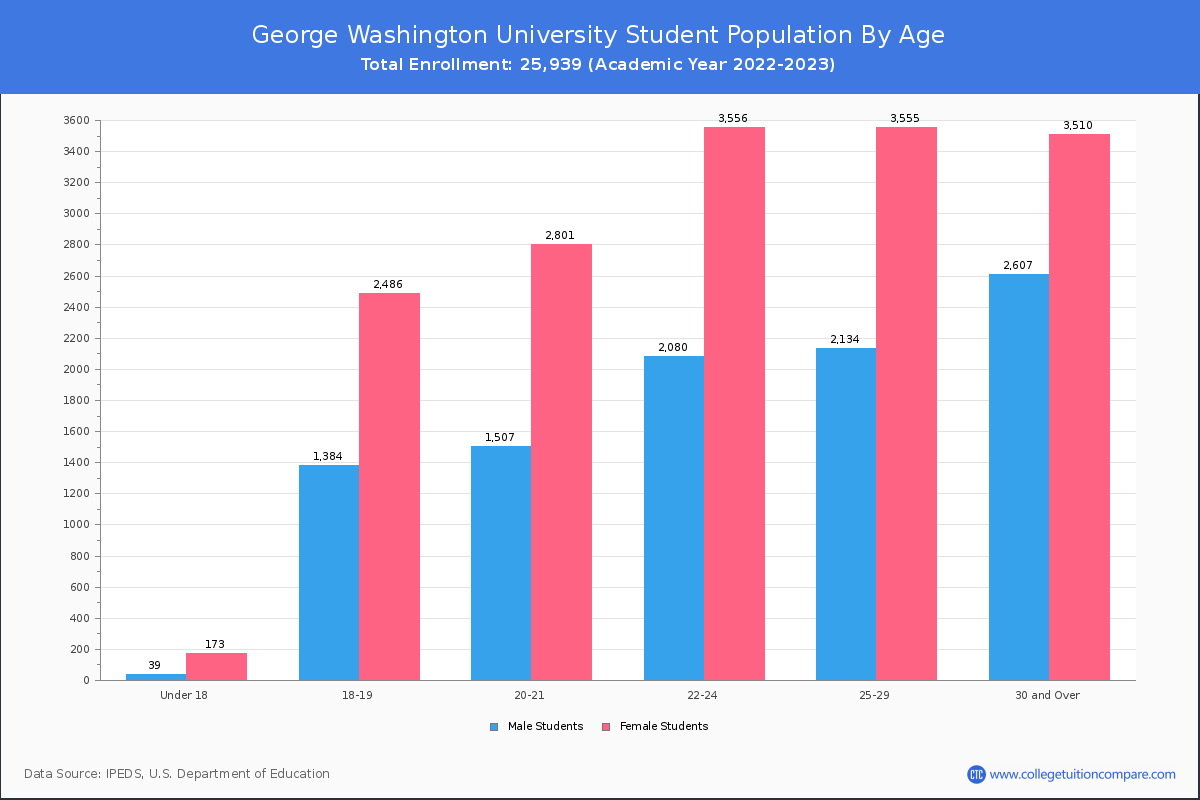
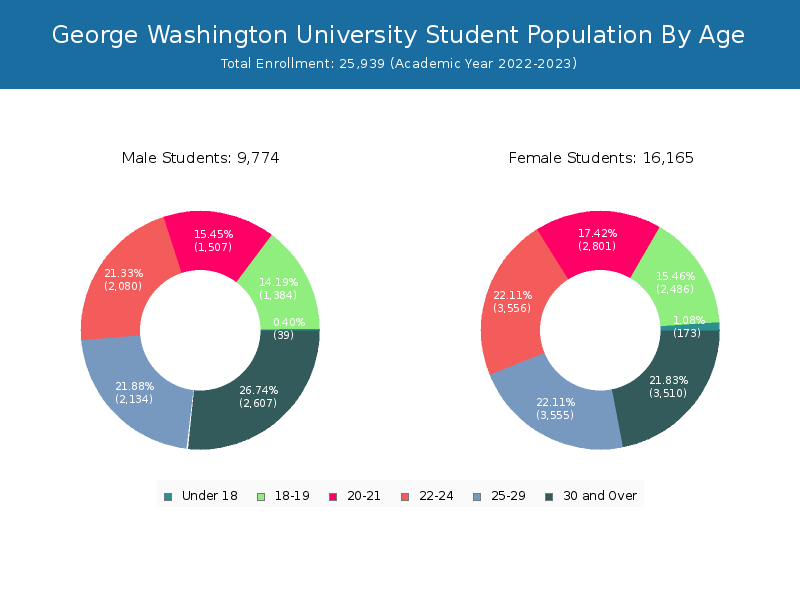
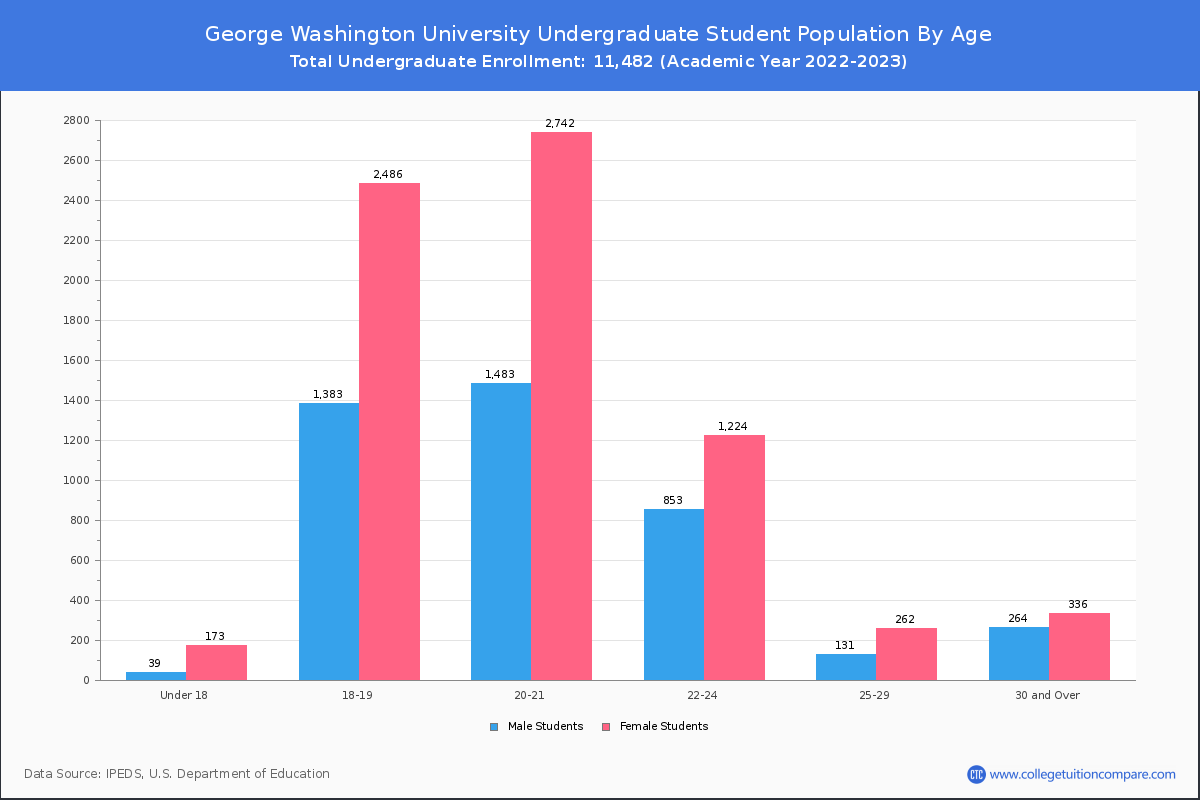
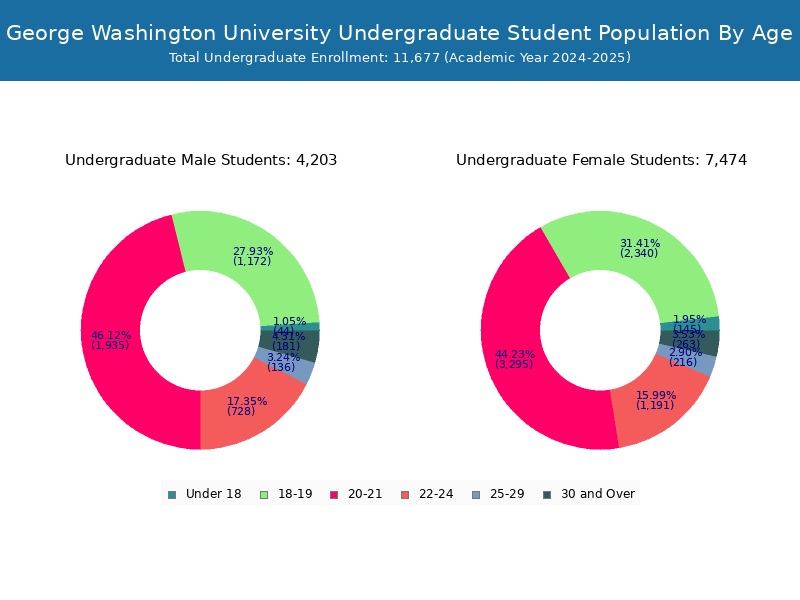
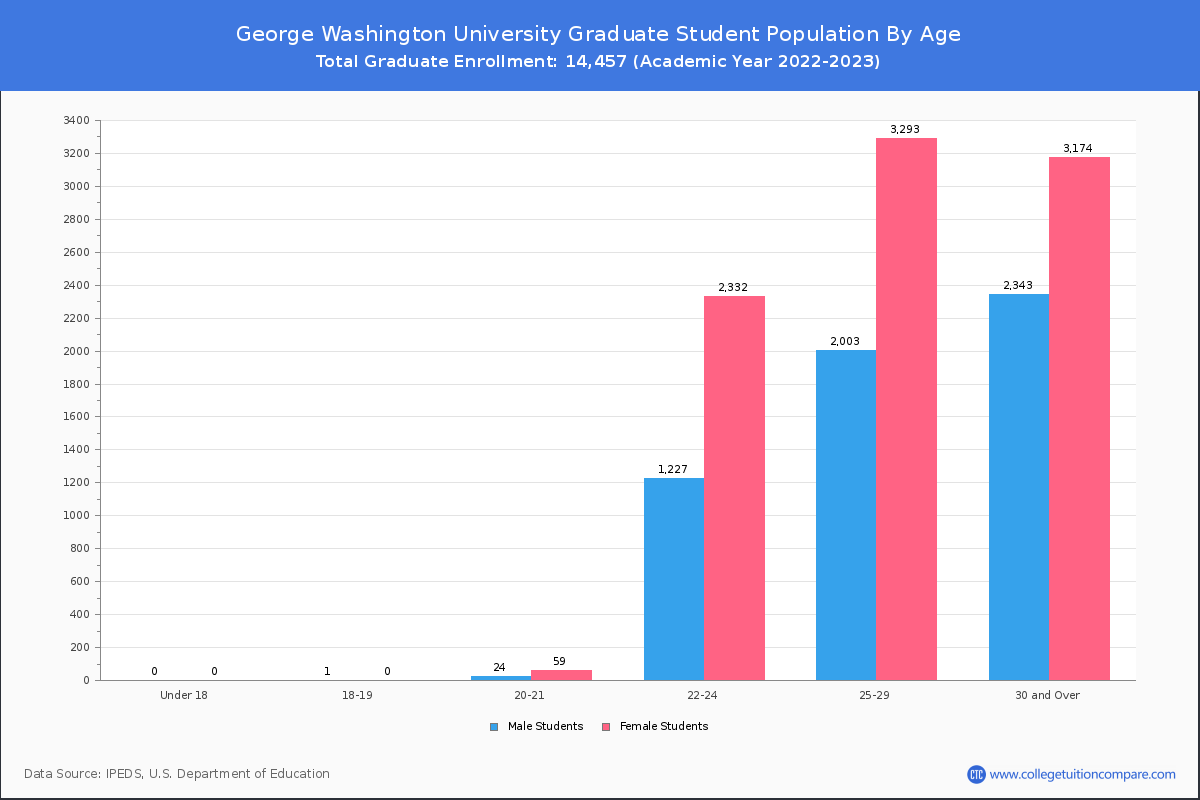
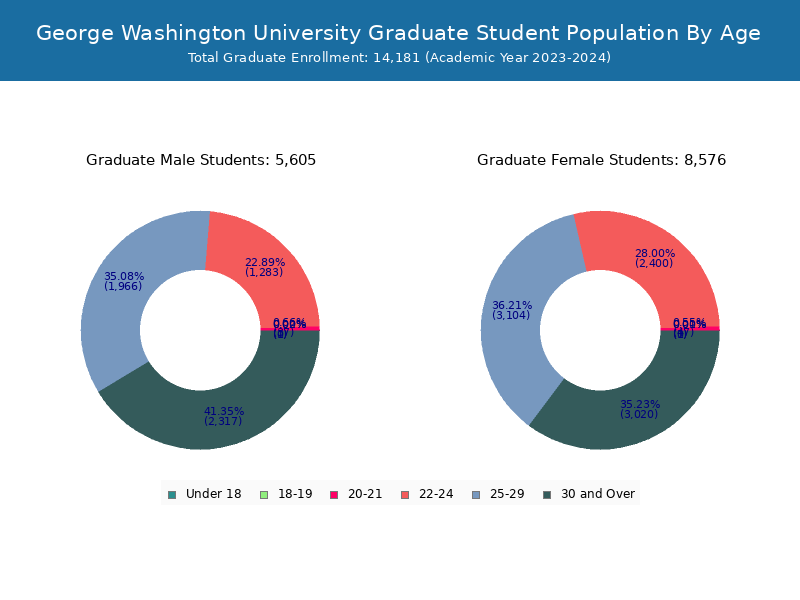
Student Age Distribution
By age, GWU has 197 students under 18 years old and 42 students over 65 years old. There are 14,279 students under 25 years old, and 11,249 students over 25 years old out of 25,568 total students.
In undergraduate programs, 196 students are younger than 18 and 6 students are older than 65. GWU has 10,510 undergraduate students aged under 25 and 842 students aged 25 and over.
In graduate schools at GWU, 1 students are younger than 18 and 36 students are older than 65. It has 3,769 graduate students aged under 25 and 10,407 students aged 25 and over.
| Age | Total | Men | Women |
|---|---|---|---|
| Under 18 | 197 | 159 | 38 |
| 18-19 | 3,772 | 2,452 | 1,320 |
| 20-21 | 4,820 | 3,073 | 1,747 |
| 22-24 | 5,490 | 3,492 | 1,998 |
| 25-29 | 5,414 | 3,313 | 2,101 |
| 30-34 | 2,245 | 1,246 | 999 |
| 35-39 | 1,320 | 739 | 581 |
| 40-49 | 1,599 | 917 | 682 |
| 50-64 | 629 | 377 | 252 |
| Over 65 | 42 | 25 | 17 |
| Age | Total | Men | Women |
|---|---|---|---|
| Under 18 | 196 | 159 | 37 |
| 18-19 | 3,771 | 2,451 | 1,320 |
| 20-21 | 4,736 | 3,026 | 1,710 |
| 22-24 | 1,807 | 1,092 | 715 |
| 25-29 | 344 | 209 | 135 |
| 30-34 | 176 | 102 | 74 |
| 35-39 | 126 | 60 | 66 |
| 40-49 | 136 | 85 | 51 |
| 50-64 | 54 | 33 | 21 |
| Over 65 | 6 | 4 | 2 |
| Age | Total | Men | Women |
|---|---|---|---|
| Under 18 | 1 | 0 | 1 |
| 18-19 | 1 | 1 | 0 |
| 20-21 | 84 | 47 | 37 |
| 22-24 | 3,683 | 2,400 | 1,283 |
| 25-29 | 5,070 | 3,104 | 1,966 |
| 30-34 | 2,069 | 1,144 | 925 |
| 35-39 | 1,194 | 679 | 515 |
| 40-49 | 1,463 | 832 | 631 |
| 50-64 | 575 | 344 | 231 |
| Over 65 | 36 | 21 | 15 |
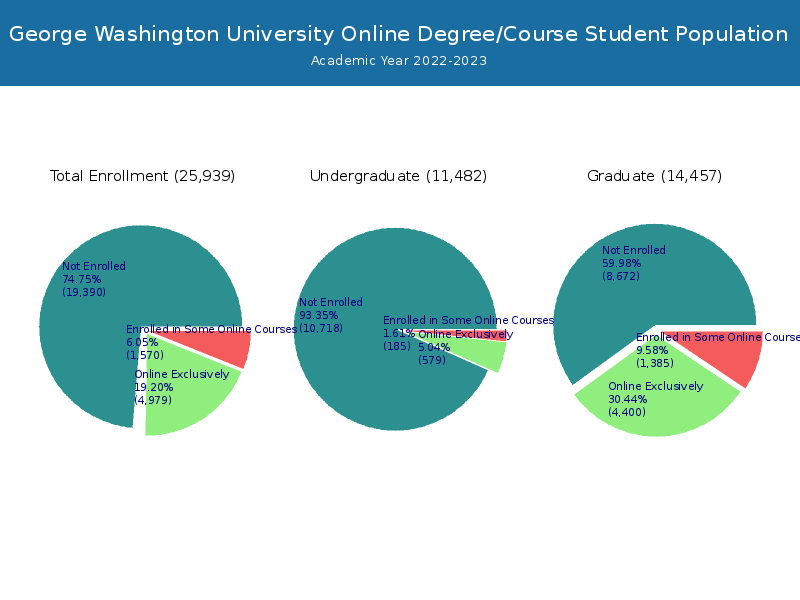
Online Student Enrollment
Distance learning, also called online education, is very attractive to students, especially who want to continue education and work in field. At George Washington University, 4,508 students are enrolled exclusively in online courses and 1,747 students are enrolled in some online courses.
234 students lived in District of Columbia or jurisdiction in which the school is located are enrolled exclusively in online courses and 4,274 students live in other State or outside of the United States.
| All Students | Enrolled Exclusively Online Courses | Enrolled in Some Online Courses | |
|---|---|---|---|
| All Students | 25,568 | 4,508 | 1,747 |
| Undergraduate | 11,387 | 491 | 252 |
| Graduate | 14,181 | 4,017 | 1,495 |
| District of Columbia Residents | Other States in U.S. | Outside of U.S. | |
|---|---|---|---|
| All Students | 234 | 4,206 | 68 |
| Undergraduate | 13 | 478 | 0 |
| Graduate | 221 | 3,728 | 68 |
Transfer-in Students (Undergraduate)
Among 11,387 enrolled in undergraduate programs, 590 students have transferred-in from other institutions. The percentage of transfer-in students is 5.18%.456 students have transferred in as full-time status and 134 students transferred in as part-time status.
| Number of Students | |
|---|---|
| Regular Full-time | 9,930 |
| Transfer-in Full-time | 456 |
| Regular Part-time | 867 |
| Transfer-in Part-time | 134 |
Ratings & Review
Share your experiences and thoughts about George Washington University. It will be a great help to applicants and prospective students!