The University of Tampa's Graduation Rate
At The University of Tampa, the graduation rate is 62 % within 150% normal time, the retention rate is 81 %, as of August 31, 2024.
Its graduation rate is around the average rate when comparing similar colleges' rate of 57.43% (private (not-for-profit) Master's College and University with larger programs).
Graduation Rates in Reasonable Completion Time
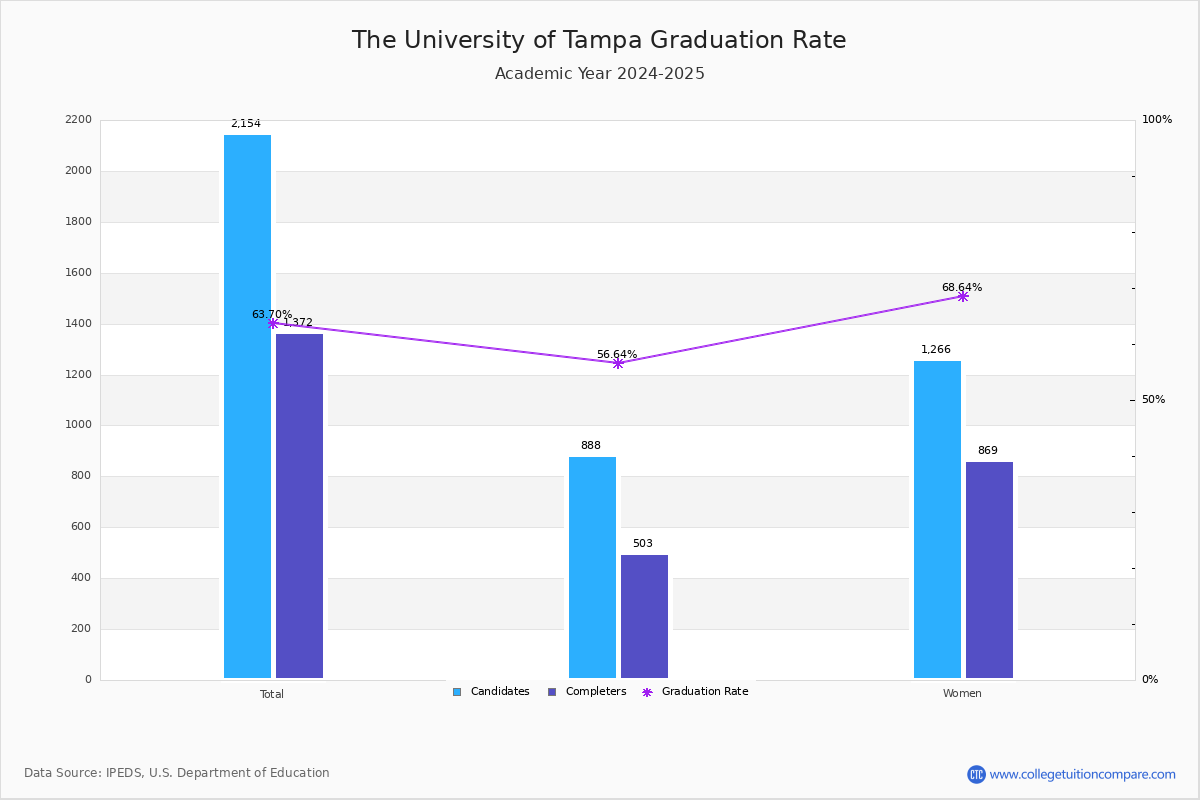
For the academic year 2023-2024, 1,322 students out of 2,135 candidates have completed their courses within 150% normal time (i.e. in 6 years for 4-year BS degree) at The University of Tampa.
By gender, 494 male and 828 female students graduated the school last year completing their jobs in the period.
| Candidates | Completers | Graduation Rates | |
|---|---|---|---|
| Total | 2,135 | 1,322 | 61.92% |
| Men | 836 | 494 | 59.09% |
| Women | 1,299 | 828 | 63.74% |
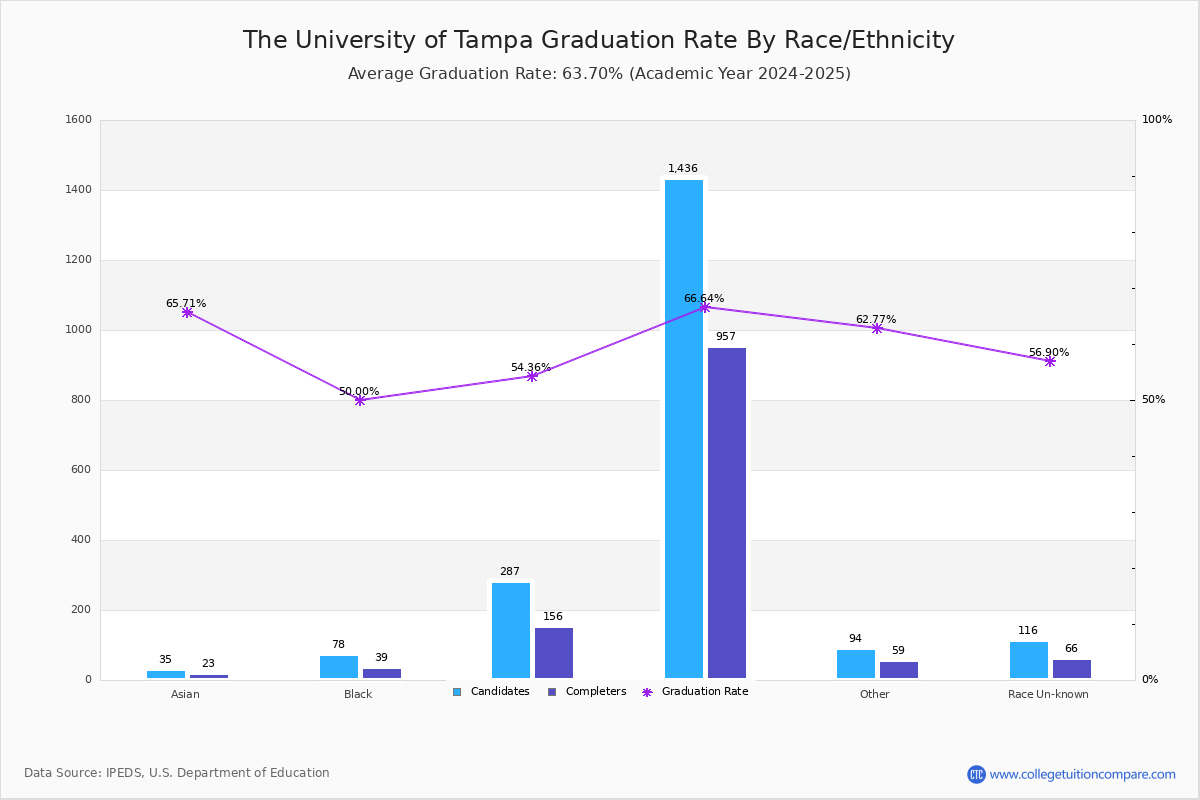
Graduation Rate By Race/Ethnicity
The following table shows graduation rate by race and at The University of Tampa.
- American Indian or Alaska Native: 50.00%
- Asian: 60.00%
- Black (Non-Hispanic): 50.62%
- Hispanic: 52.36%
- White: 64.82%
- Native Hawaiian or Other Pacific Islander: 80.00%
- Two or More Race: 72.22%
- Unknown: 58.09%
| Total | Male | Female | |
|---|---|---|---|
| American Indian or Alaska Native | 50.00%(2/4) | 33.33%(1/3) | 100.00%(1/1) |
| Asian | 60.00%(27/45) | 69.23%(9/13) | 56.25%(18/32) |
| Black (Non-Hispanic) | 50.62%(41/81) | 40.63%(13/32) | 57.14%(28/49) |
| Hispanic | 52.36%(144/275) | 48.84%(42/86) | 53.97%(102/189) |
| White | 64.82%(925/1,427) | 62.48%(353/565) | 66.36%(572/862) |
| Native Hawaiian or Other Pacific Islander | 80.00%(4/5) | 100.00%(2/2) | 66.67%(2/3) |
| Two or More Race | 72.22%(39/54) | 77.78%(14/18) | 69.44%(25/36) |
| Unknown | 58.09%(79/136) | 49.18%(30/61) | 65.33%(49/75) |
Non-Resident Alien Graduation Rate
A non-resident alien student is not a US citizen/green card holder and studies with a student visa, such as an F visa, in the United States. At The University of Tampa, 61 of 108 non-resident alien students completed their studies and the graduation rate was 58.70%.
-
Non-Resident Alien Graduation Rate
Ratings & Review
Share your experiences and thoughts about The University of Tampa. It will be a great help to applicants and prospective students!