How many students at U of Louisville? For the academic year 2023-2024, total of 22,139 students have enrolled in University of Louisville with 16,194 undergraduate and 5,945 graduate students.
By gender, 9,605 male and 12,534 female students are attending the school.
It has much fewer students compared to similar colleges (34,080 students in average - public Research University (very high research activity)).
4,220 students are enrolled exclusively, and 8,785 students are enrolled in some online courses.
You can check the student demographics by gender ratio, race/ethnicity, age distribution, and online enrollment.
Student Population by Gender
University of Louisville has a total of 22,139 enrolled students for the academic year 2023-2024. 16,194 students have enrolled in undergraduate programs and 5,945 students joined graduate programs.
By gender, 9,605 male and 12,534 female students (the male-female ratio is 43:57) are attending the school. The gender distribution is based on the 2023-2024 data.
| Total | Undergraduate | Graduate | |
|---|---|---|---|
| Total | 22,139 | 16,194 | 5,945 |
| Men | 9,605 | 6,974 | 2,631 |
| Women | 12,534 | 9,220 | 3,314 |
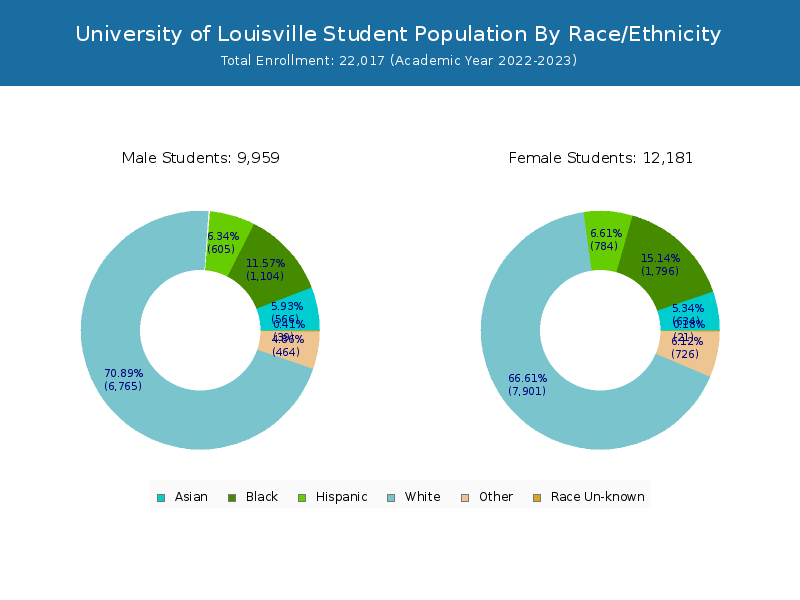
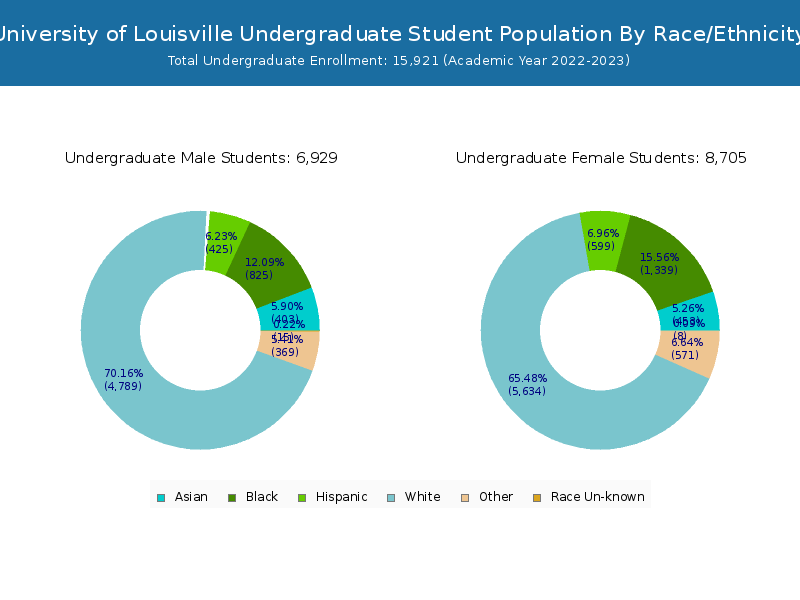
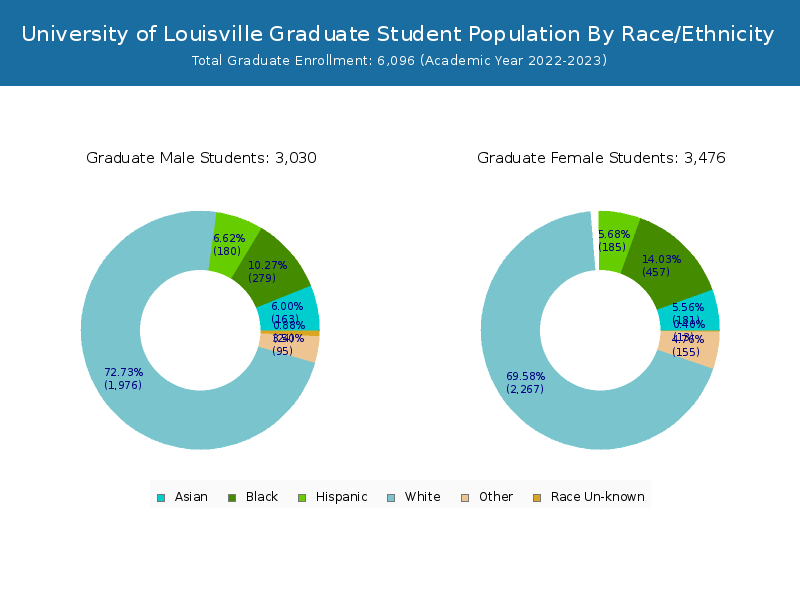
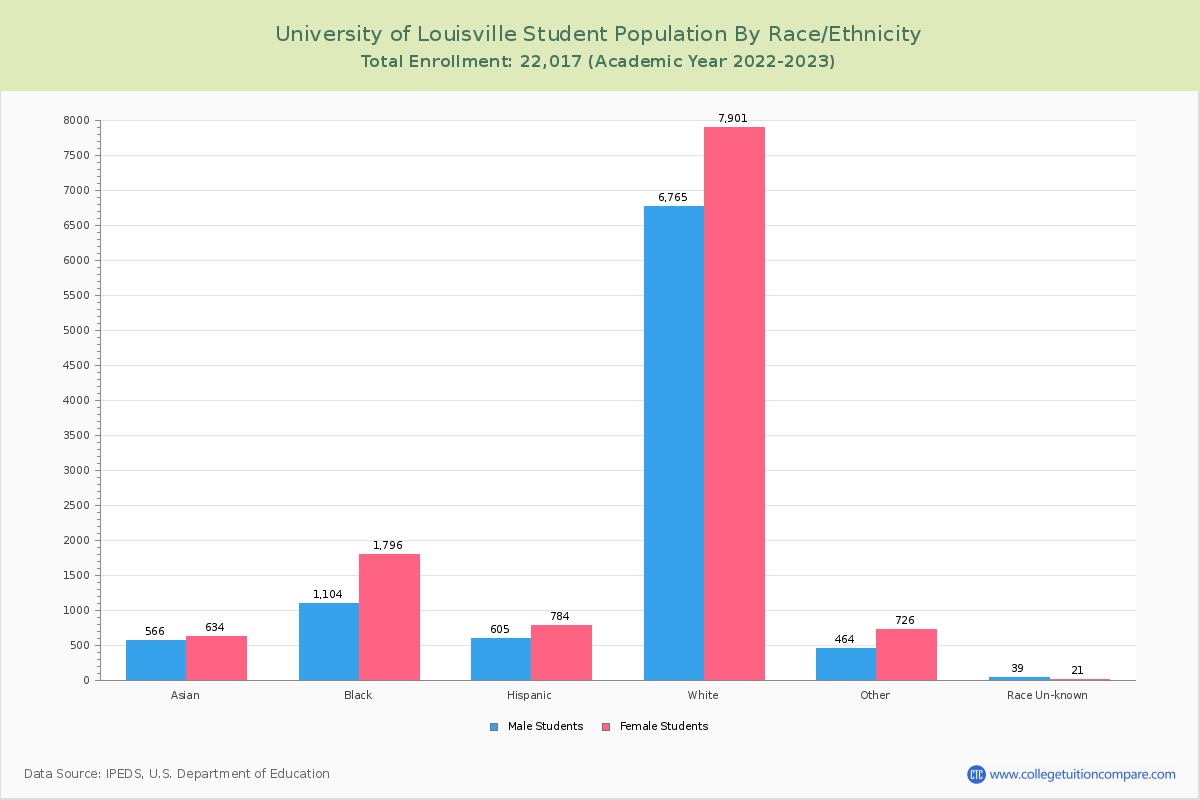
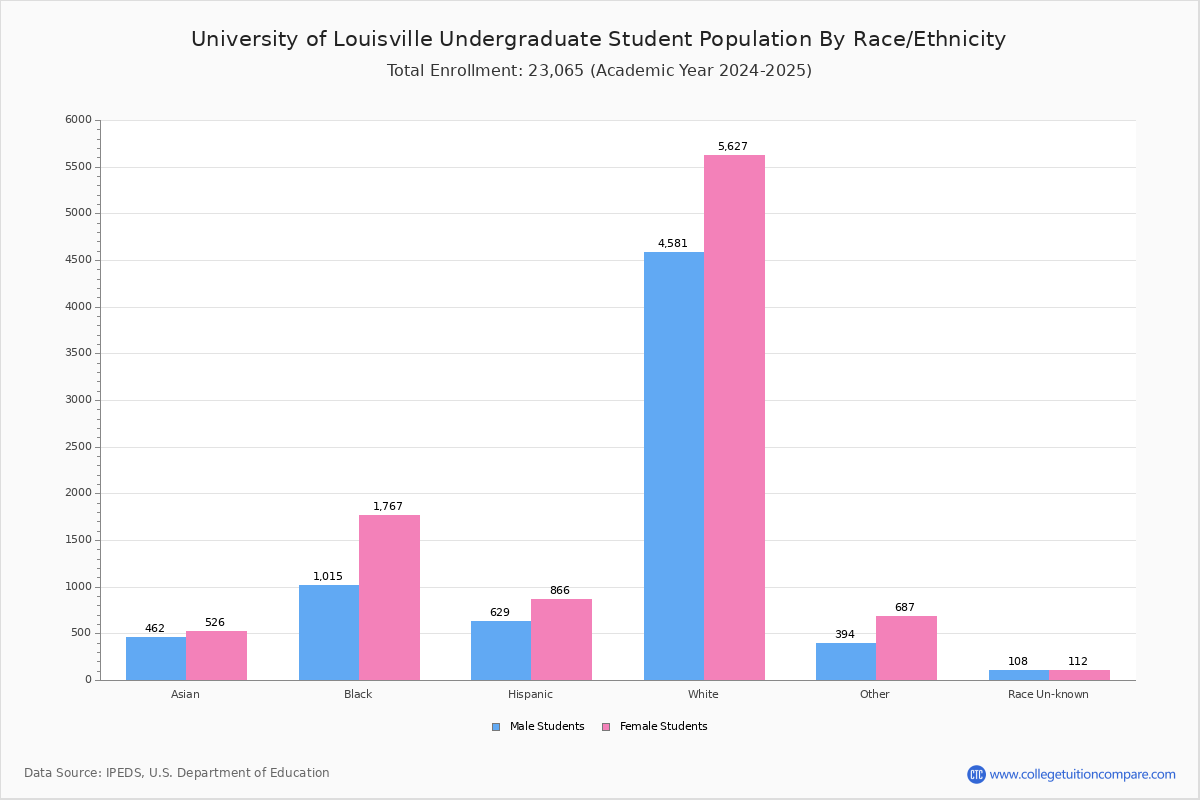
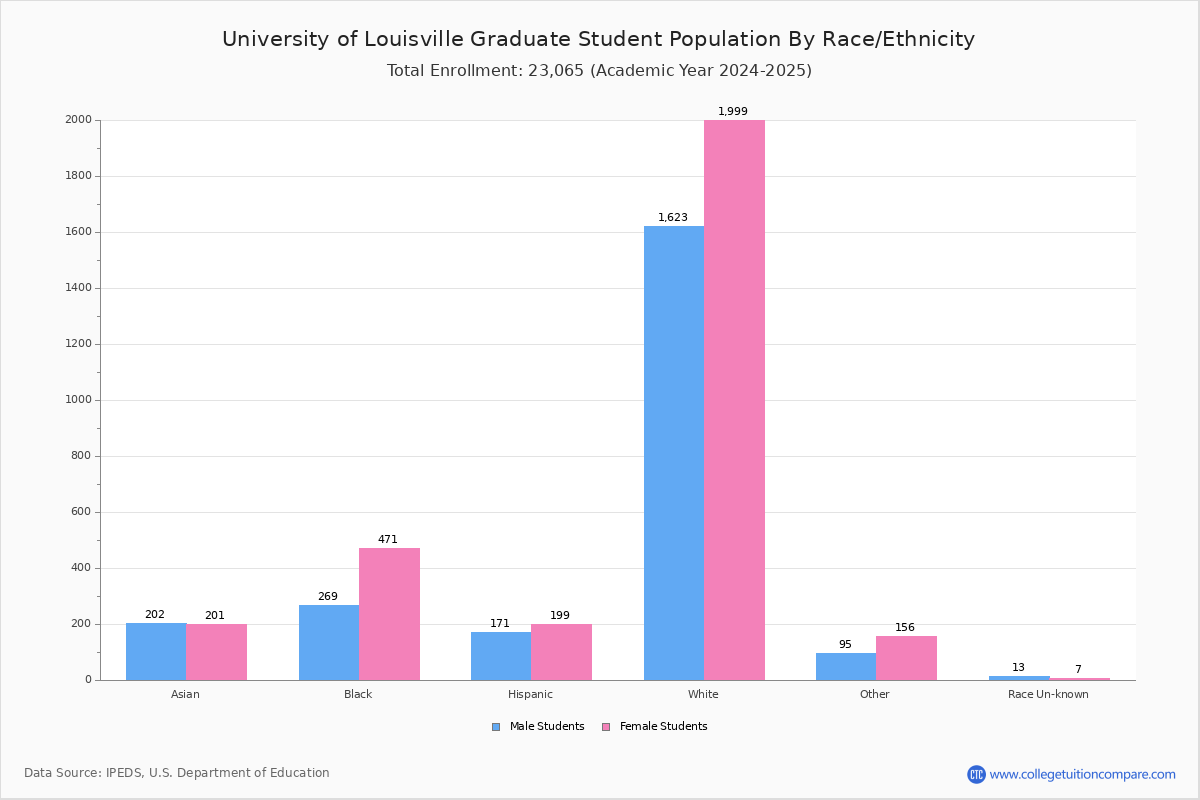
Student Distribution by Race/Ethnicity
By race/ethnicity, 13,573 White, 3,231 Black, and 1,326 Asian students out of a total of 22,139 are attending at University of Louisville. Comprehensive enrollment statistic data by race/ethnicity is shown in chart below (academic year 2023-2024 data).
| Race | Total | Men | Women |
|---|---|---|---|
| American Indian or Native American | 40 | 19 | 21 |
| Asian | 1,326 | 602 | 724 |
| Black | 3,231 | 1,192 | 2,039 |
| Hispanic | 1,756 | 761 | 995 |
| Native Hawaiian or Other Pacific Islanders | 15 | 10 | 5 |
| White | 13,573 | 6,051 | 7,522 |
| Two or more races | 1,237 | 453 | 784 |
| Race Unknown | 176 | 88 | 88 |
| Race | Total | Men | Women |
|---|---|---|---|
| American Indian or Native American | 28 | 12 | 16 |
| Asian | 949 | 436 | 513 |
| Black | 2,530 | 959 | 1,571 |
| Hispanic | 1,357 | 558 | 799 |
| Native Hawaiian or Other Pacific Islanders | 10 | 7 | 3 |
| White | 9,921 | 4,429 | 5,492 |
| Two or more races | 1,005 | 372 | 633 |
| Race Unknown | 161 | 78 | 83 |
| Race | Total | Men | Women |
|---|---|---|---|
| American Indian or Native American | 12 | 7 | 5 |
| Asian | 377 | 166 | 211 |
| Black | 701 | 233 | 468 |
| Hispanic | 399 | 203 | 196 |
| Native Hawaiian or Other Pacific Islanders | 5 | 3 | 2 |
| White | 3,652 | 1,622 | 2,030 |
| Two or more races | 232 | 81 | 151 |
| Race Unknown | 15 | 10 | 5 |
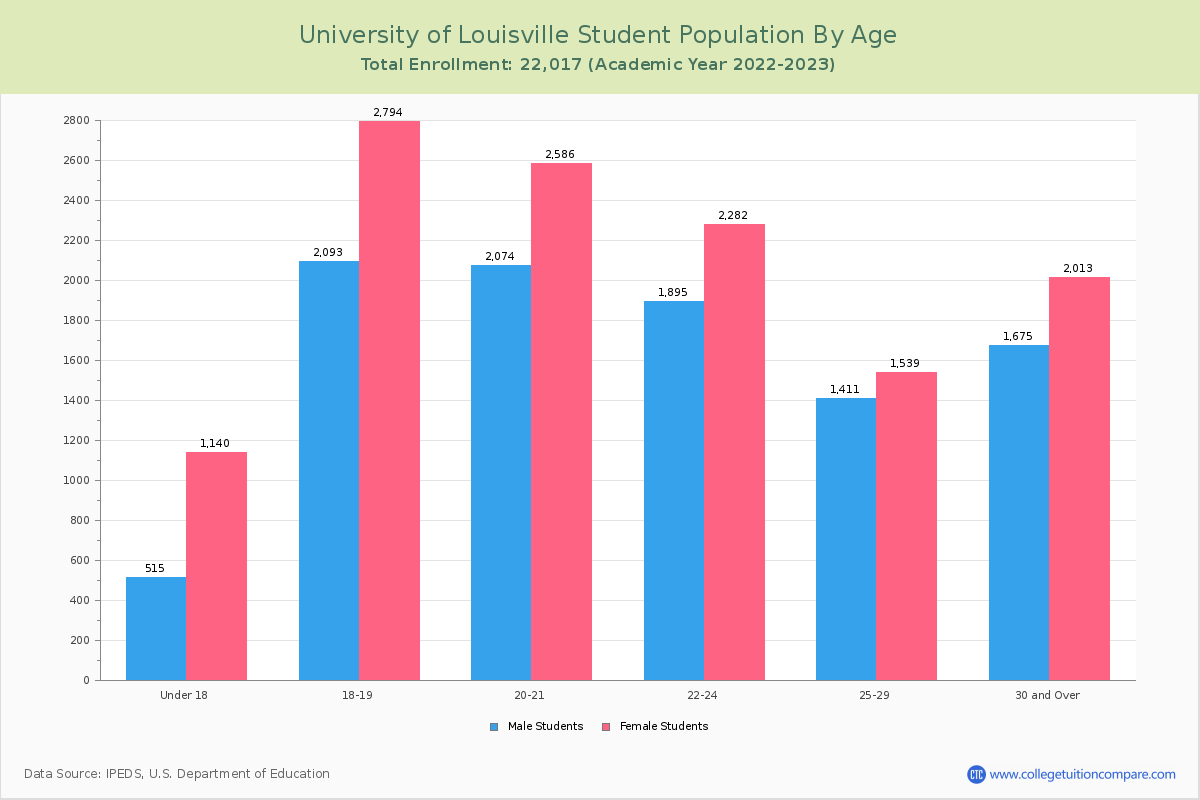
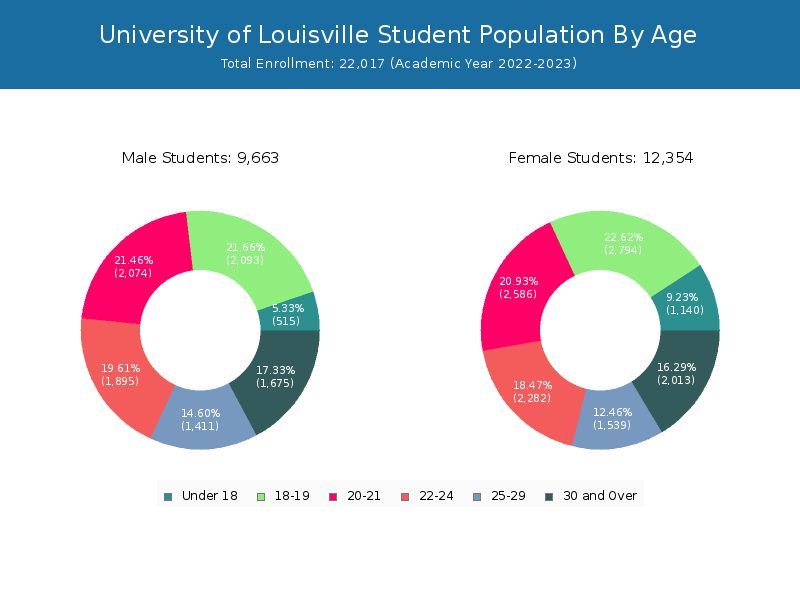
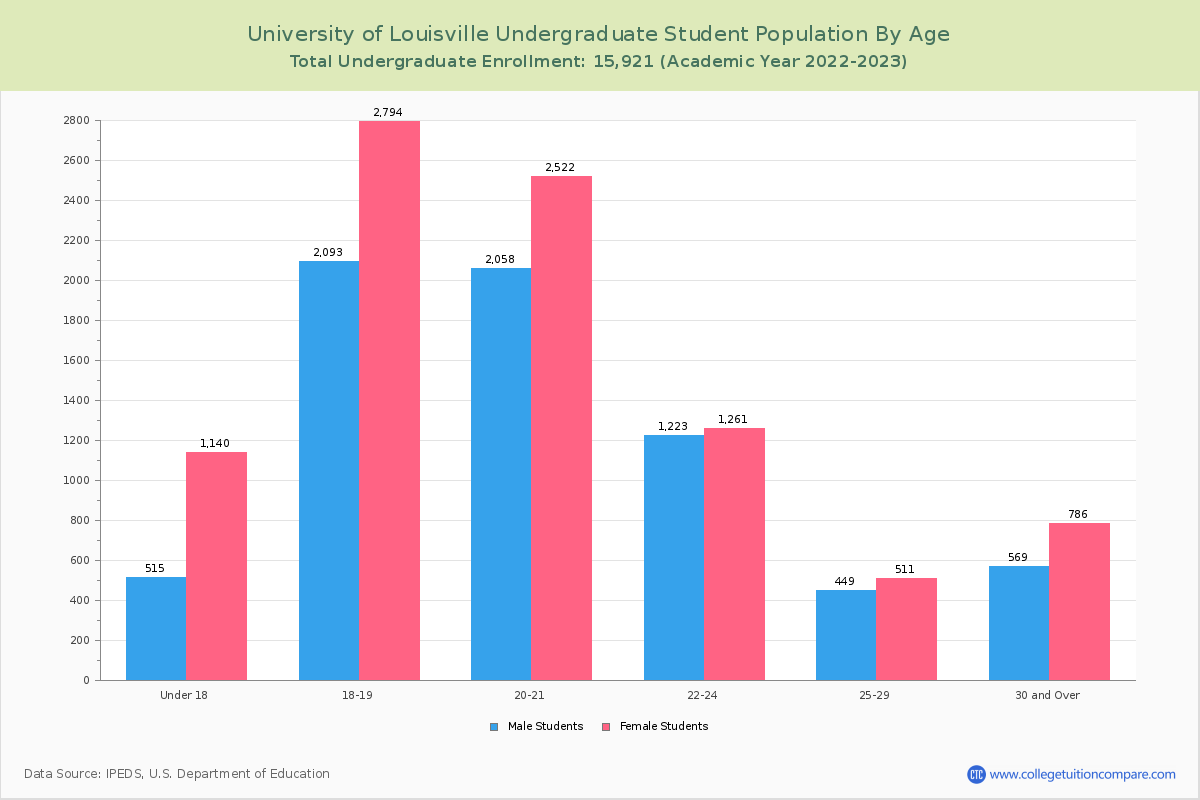
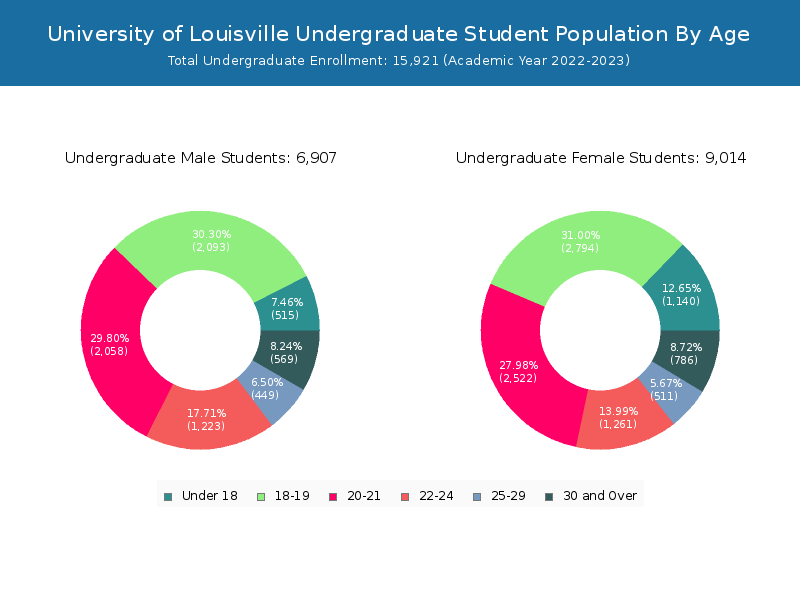
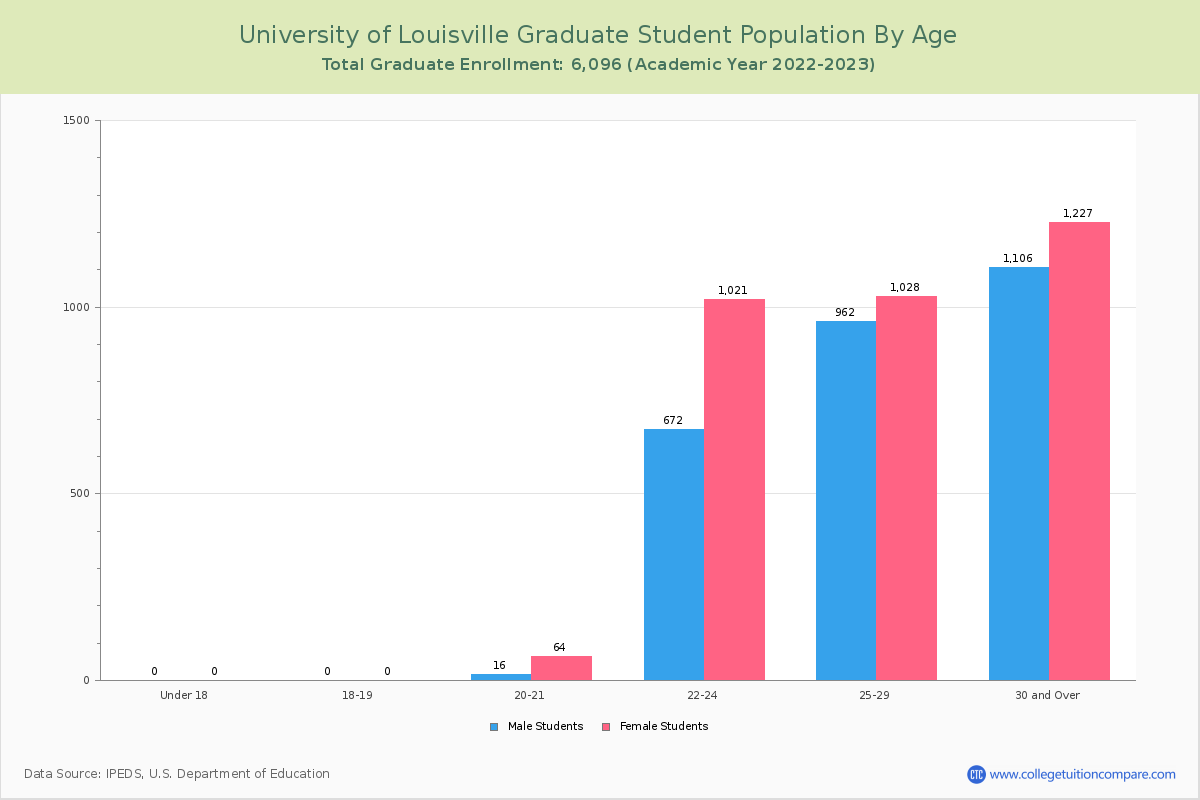
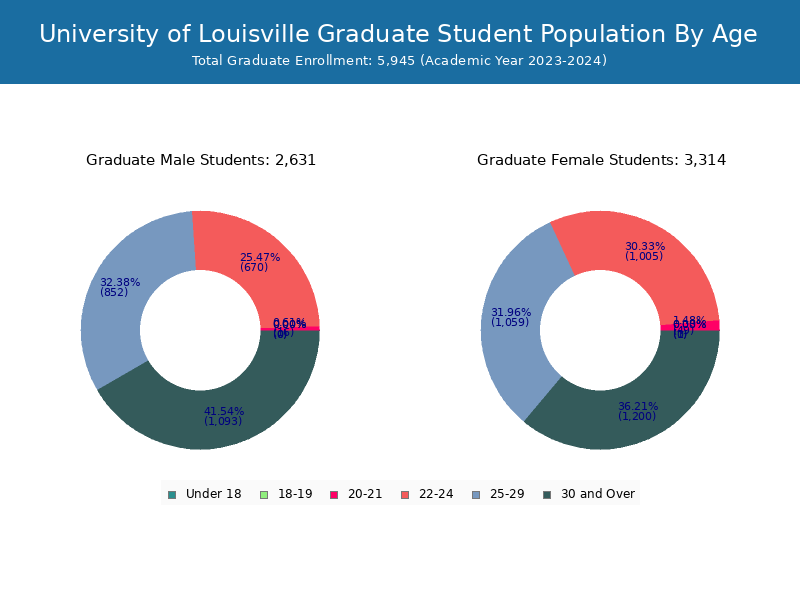
Student Age Distribution
By age, U of Louisville has 1,612 students under 18 years old and 126 students over 65 years old. There are 15,546 students under 25 years old, and 6,593 students over 25 years old out of 22,139 total students.
In undergraduate programs, 1,612 students are younger than 18 and 102 students are older than 65. U of Louisville has 13,805 undergraduate students aged under 25 and 2,389 students aged 25 and over.
It has 1,741 graduate students aged under 25 and 4,204 students aged 25 and over.
| Age | Total | Men | Women |
|---|---|---|---|
| Under 18 | 1,612 | 1,059 | 553 |
| 18-19 | 5,184 | 3,000 | 2,184 |
| 20-21 | 4,665 | 2,575 | 2,090 |
| 22-24 | 4,085 | 2,248 | 1,837 |
| 25-29 | 2,849 | 1,560 | 1,289 |
| 30-34 | 1,385 | 702 | 683 |
| 35-39 | 899 | 513 | 386 |
| 40-49 | 951 | 574 | 377 |
| 50-64 | 383 | 245 | 138 |
| Over 65 | 126 | 58 | 68 |
| Age | Total | Men | Women |
|---|---|---|---|
| Under 18 | 1,612 | 1,059 | 553 |
| 18-19 | 5,183 | 2,999 | 2,184 |
| 20-21 | 4,600 | 2,526 | 2,074 |
| 22-24 | 2,410 | 1,243 | 1,167 |
| 25-29 | 938 | 501 | 437 |
| 30-34 | 497 | 280 | 217 |
| 35-39 | 337 | 207 | 130 |
| 40-49 | 350 | 243 | 107 |
| 50-64 | 165 | 117 | 48 |
| Over 65 | 102 | 45 | 57 |
| Age | Total | Men | Women |
|---|---|---|---|
| 18-19 | 1 | 1 | 0 |
| 20-21 | 65 | 49 | 16 |
| 22-24 | 1,675 | 1,005 | 670 |
| 25-29 | 1,911 | 1,059 | 852 |
| 30-34 | 888 | 422 | 466 |
| 35-39 | 562 | 306 | 256 |
| 40-49 | 601 | 331 | 270 |
| 50-64 | 218 | 128 | 90 |
| Over 65 | 24 | 13 | 11 |
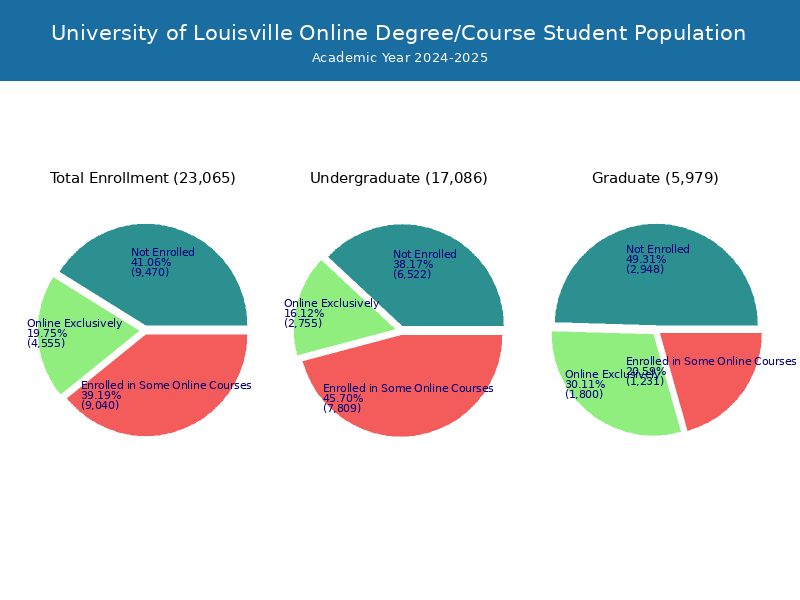
Online Student Enrollment
Distance learning, also called online education, is very attractive to students, especially who want to continue education and work in field. At University of Louisville, 4,220 students are enrolled exclusively in online courses and 8,785 students are enrolled in some online courses.
2,796 students lived in Kentucky or jurisdiction in which the school is located are enrolled exclusively in online courses and 1,424 students live in other State or outside of the United States.
| All Students | Enrolled Exclusively Online Courses | Enrolled in Some Online Courses | |
|---|---|---|---|
| All Students | 22,139 | 4,220 | 8,785 |
| Undergraduate | 16,194 | 2,501 | 7,483 |
| Graduate | 5,945 | 1,719 | 1,302 |
| Kentucky Residents | Other States in U.S. | Outside of U.S. | |
|---|---|---|---|
| All Students | 2,796 | 1,369 | 55 |
| Undergraduate | 1,969 | 524 | 8 |
| Graduate | 827 | 845 | 47 |
Transfer-in Students (Undergraduate)
Among 16,194 enrolled in undergraduate programs, 990 students have transferred-in from other institutions. The percentage of transfer-in students is 6.11%.682 students have transferred in as full-time status and 308 students transferred in as part-time status.
| Number of Students | |
|---|---|
| Regular Full-time | 11,120 |
| Transfer-in Full-time | 682 |
| Regular Part-time | 4,084 |
| Transfer-in Part-time | 308 |
Ratings & Review
Share your experiences and thoughts about University of Louisville. It will be a great help to applicants and prospective students!