Barton's Graduation Rate
At Barton College, the graduation rate is 52 % within 150% normal time, the retention rate is 65 %, as of August 31, 2024.
Its graduation rate is relatively higher than the average rate when comparing similar colleges' rate of 43.90% (private (not-for-profit) Baccalaureate College - Diverse Fields).
Graduation Rates in Reasonable Completion Time
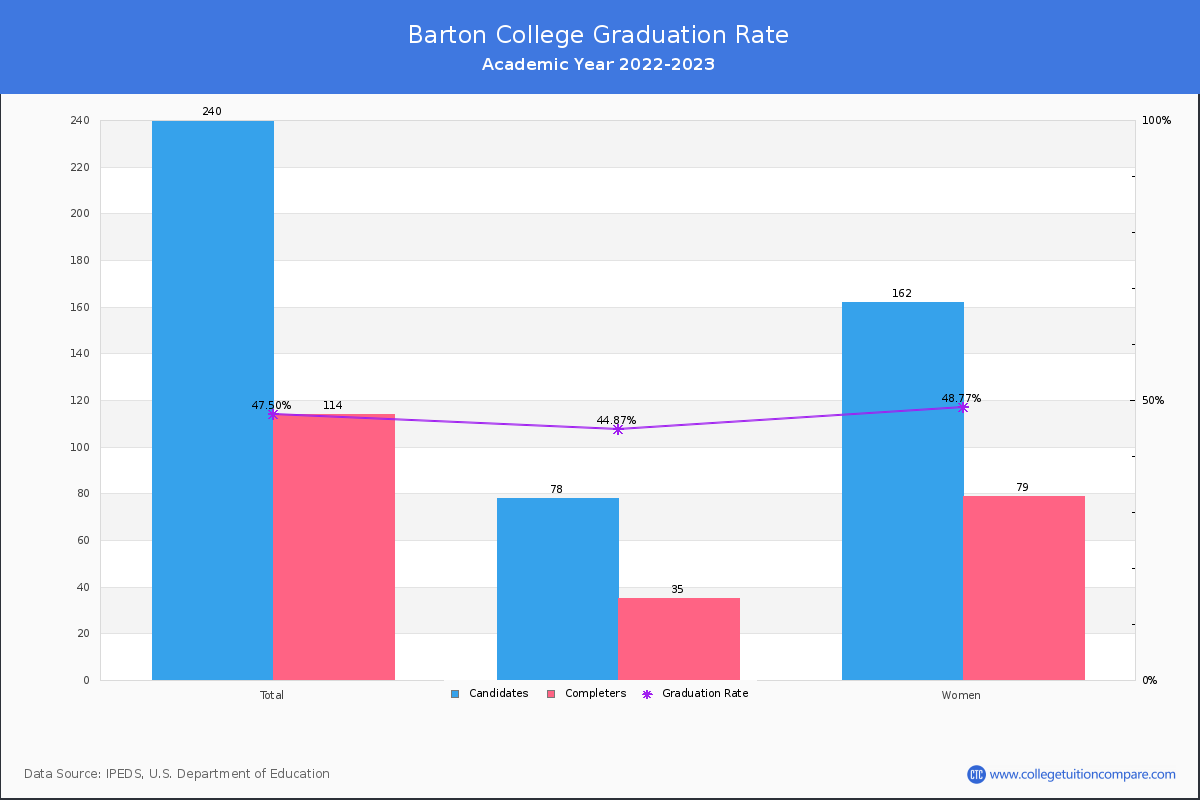
For the academic year 2023-2024, 102 students out of 198 candidates have completed their courses within 150% normal time (i.e. in 6 years for 4-year BS degree) at Barton College.
By gender, 39 male and 63 female students graduated the school last year completing their jobs in the period.
| Candidates | Completers | Graduation Rates | |
|---|---|---|---|
| Total | 198 | 102 | 51.52% |
| Men | 71 | 39 | 54.93% |
| Women | 127 | 63 | 49.61% |
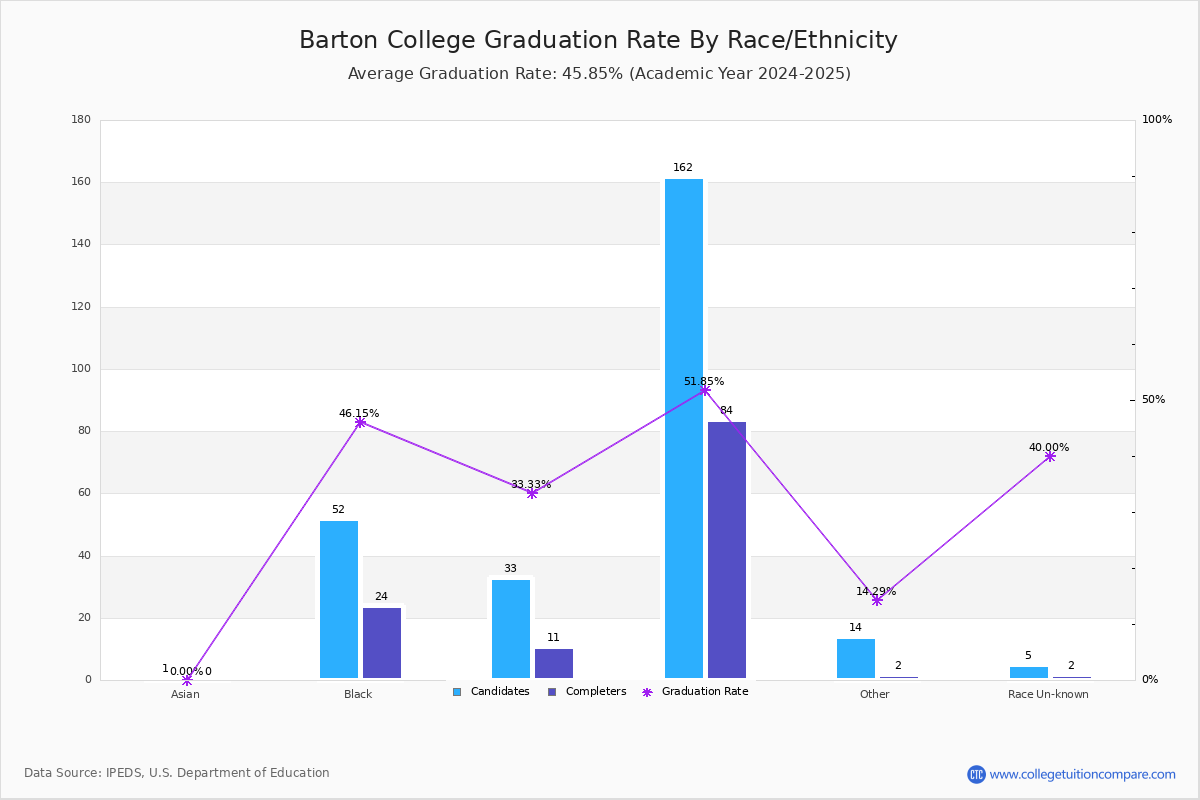
Graduation Rate By Race/Ethnicity
The following table shows graduation rate by race and at Barton College.
- American Indian or Alaska Native: 100.00%
- Asian: 66.67%
- Black (Non-Hispanic): 39.13%
- Hispanic: 53.33%
- White: 54.87%
- Two or More Race: 14.29%
- Unknown: 0.00%
| Total | Male | Female | |
|---|---|---|---|
| American Indian or Alaska Native | 100.00%(2/2) | - | 100.00%(2/2) |
| Asian | 66.67%(2/3) | 100.00%(1/1) | 50.00%(1/2) |
| Black (Non-Hispanic) | 39.13%(18/46) | 69.23%(9/13) | 27.27%(9/33) |
| Hispanic | 53.33%(8/15) | 28.57%(2/7) | 75.00%(6/8) |
| White | 54.87%(62/113) | 51.28%(20/39) | 56.76%(42/74) |
| Two or More Race | 14.29%(1/7) | 33.33%(1/3) | - |
| Unknown | 0.00%(-/1) | - | - |
Non-Resident Alien Graduation Rate
A non-resident alien student is not a US citizen/green card holder and studies with a student visa, such as an F visa, in the United States. At Barton College, 9 of 11 non-resident alien students completed their studies and the graduation rate was 33.27%.
-
Non-Resident Alien Graduation Rate
Ratings & Review
Share your experiences and thoughts about Barton College. It will be a great help to applicants and prospective students!