How many students at Capital? For the academic year 2023-2024, total of 2,388 students have enrolled in Capital University with 1,747 undergraduate and 641 graduate students.
By gender, 1,019 male and 1,369 female students are attending the school.
It has much fewer students compared to similar colleges (6,535 students in average - private (not-for-profit) Master's College and University (larger programs)).
80 students are enrolled exclusively, and 960 students are enrolled in some online courses.
You can check the student demographics by gender ratio, race/ethnicity, age distribution, and online enrollment.
Student Population by Gender
Capital University has a total of 2,388 enrolled students for the academic year 2023-2024. 1,747 students have enrolled in undergraduate programs and 641 students joined graduate programs.
By gender, 1,019 male and 1,369 female students (the male-female ratio is 43:57) are attending the school. The gender distribution is based on the 2023-2024 data.
| Total | Undergraduate | Graduate | |
|---|---|---|---|
| Total | 2,388 | 1,747 | 641 |
| Men | 1,019 | 740 | 279 |
| Women | 1,369 | 1,007 | 362 |
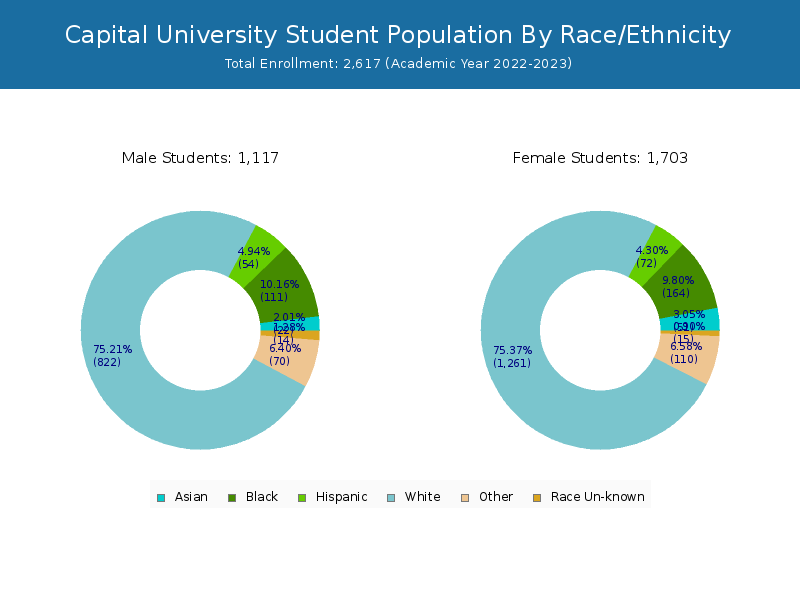
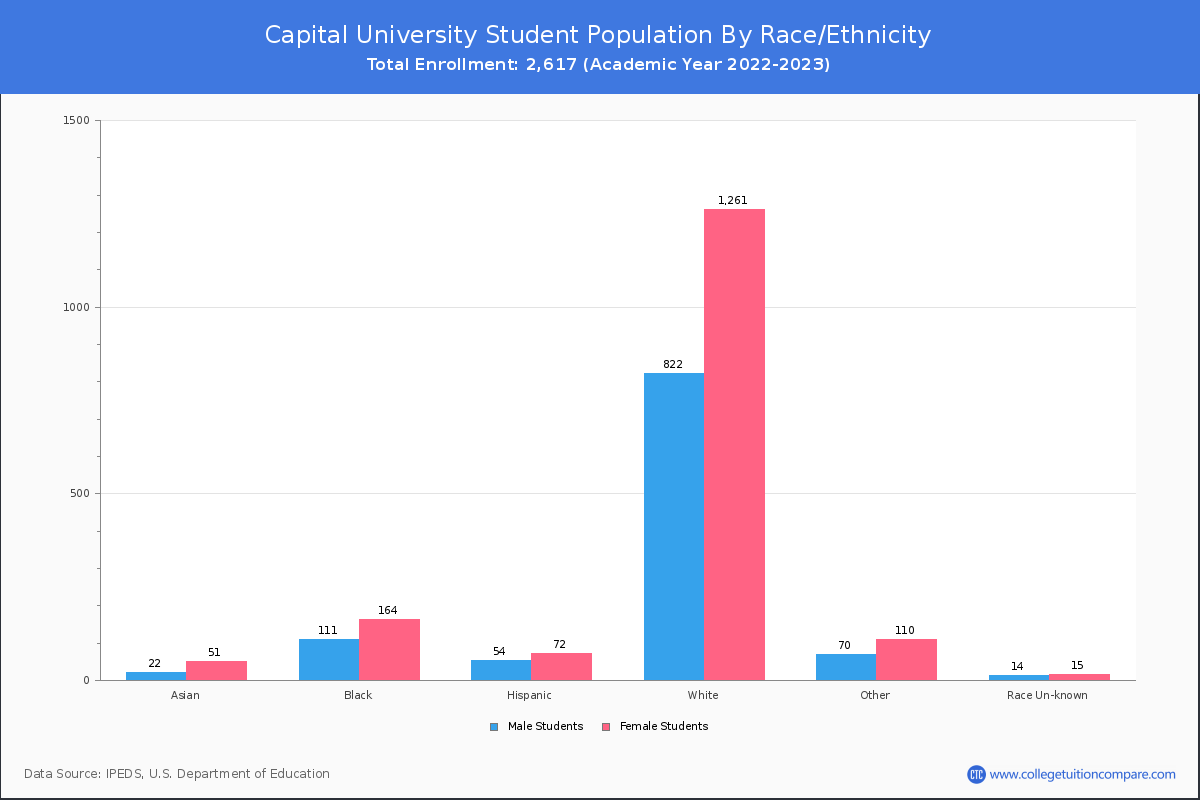
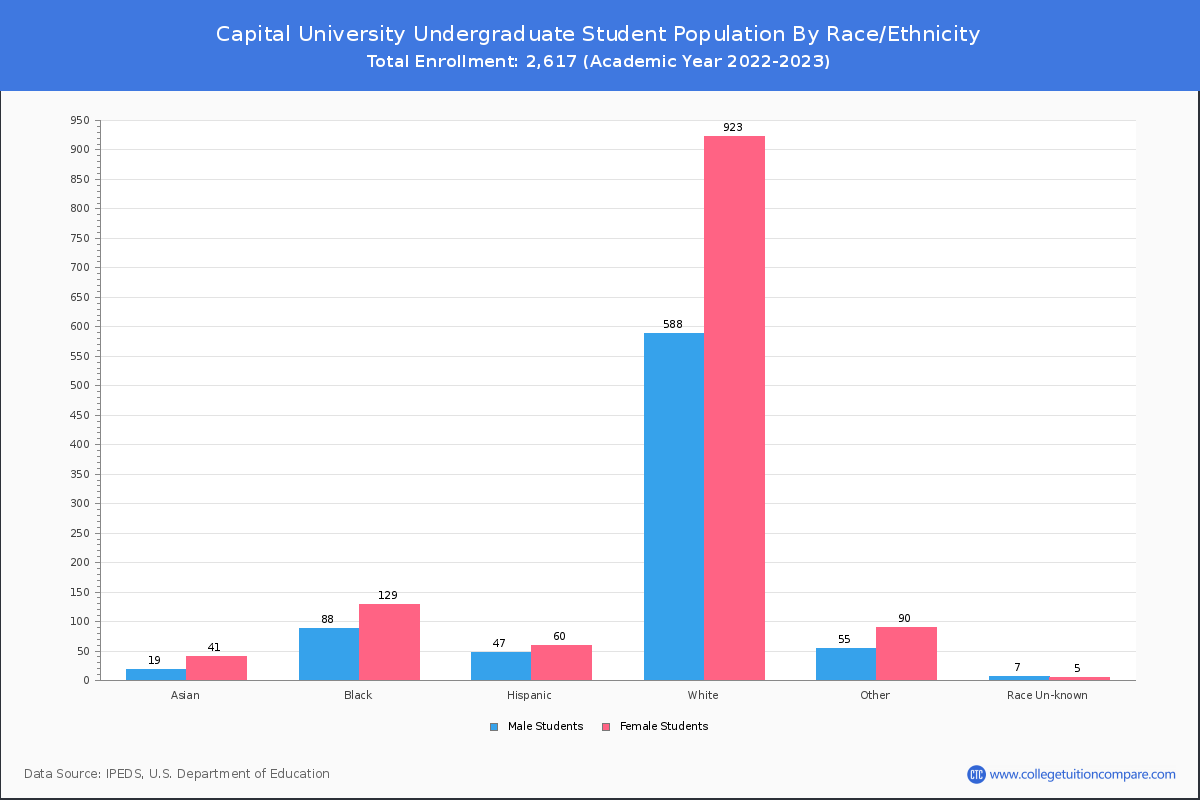
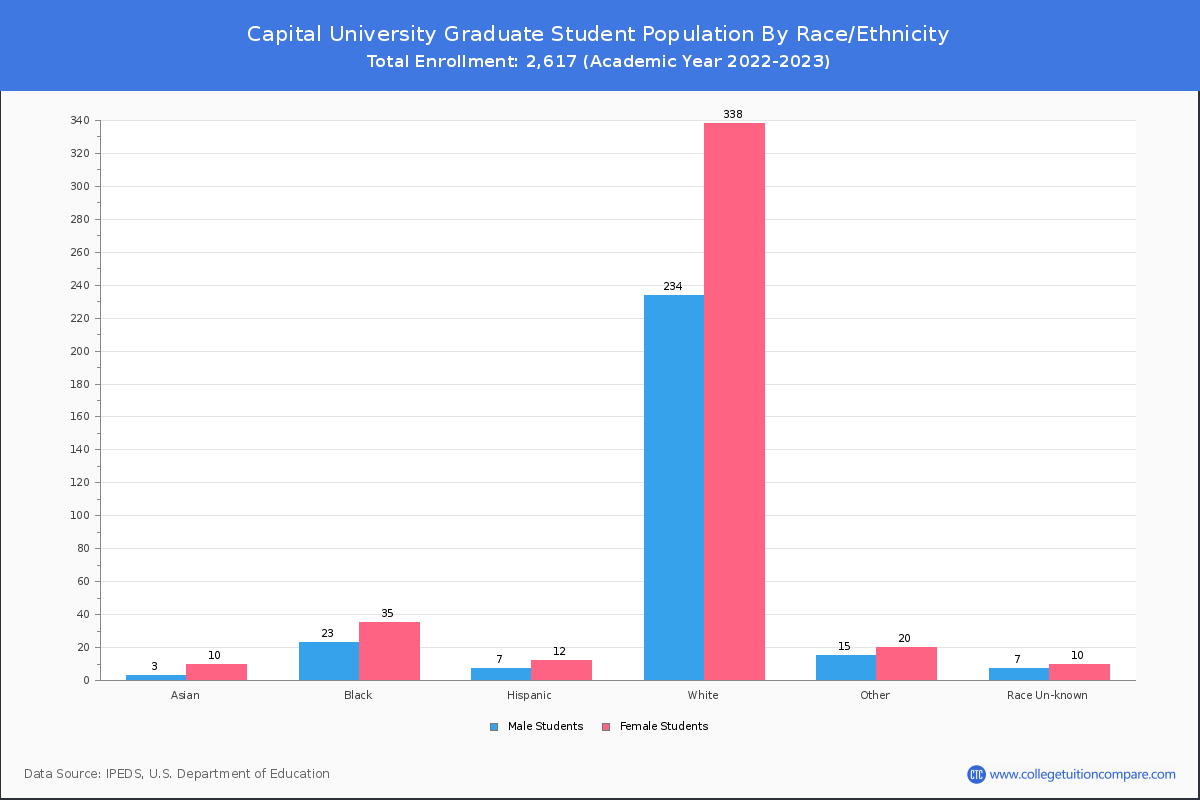
Student Distribution by Race/Ethnicity
By race/ethnicity, 1,672 White, 277 Black, and 63 Asian students out of a total of 2,388 are attending at Capital University. Comprehensive enrollment statistic data by race/ethnicity is shown in chart below (academic year 2023-2024 data).
| Race | Total | Men | Women |
|---|---|---|---|
| American Indian or Native American | 7 | 5 | 2 |
| Asian | 63 | 14 | 49 |
| Black | 277 | 131 | 146 |
| Hispanic | 138 | 53 | 85 |
| Native Hawaiian or Other Pacific Islanders | - | - | - |
| White | 1,672 | 722 | 950 |
| Two or more races | 148 | 58 | 90 |
| Race Unknown | 50 | 21 | 29 |
| Race | Total | Men | Women |
|---|---|---|---|
| American Indian or Native American | 5 | 4 | 1 |
| Asian | 47 | 12 | 35 |
| Black | 208 | 94 | 114 |
| Hispanic | 121 | 46 | 75 |
| Native Hawaiian or Other Pacific Islanders | - | - | - |
| White | 1,189 | 516 | 673 |
| Two or more races | 120 | 45 | 75 |
| Race Unknown | 33 | 14 | 19 |
| Race | Total | Men | Women |
|---|---|---|---|
| American Indian or Native American | 2 | 1 | 1 |
| Asian | 16 | 2 | 14 |
| Black | 69 | 37 | 32 |
| Hispanic | 17 | 7 | 10 |
| Native Hawaiian or Other Pacific Islanders | - | - | - |
| White | 483 | 206 | 277 |
| Two or more races | 28 | 13 | 15 |
| Race Unknown | 17 | 7 | 10 |
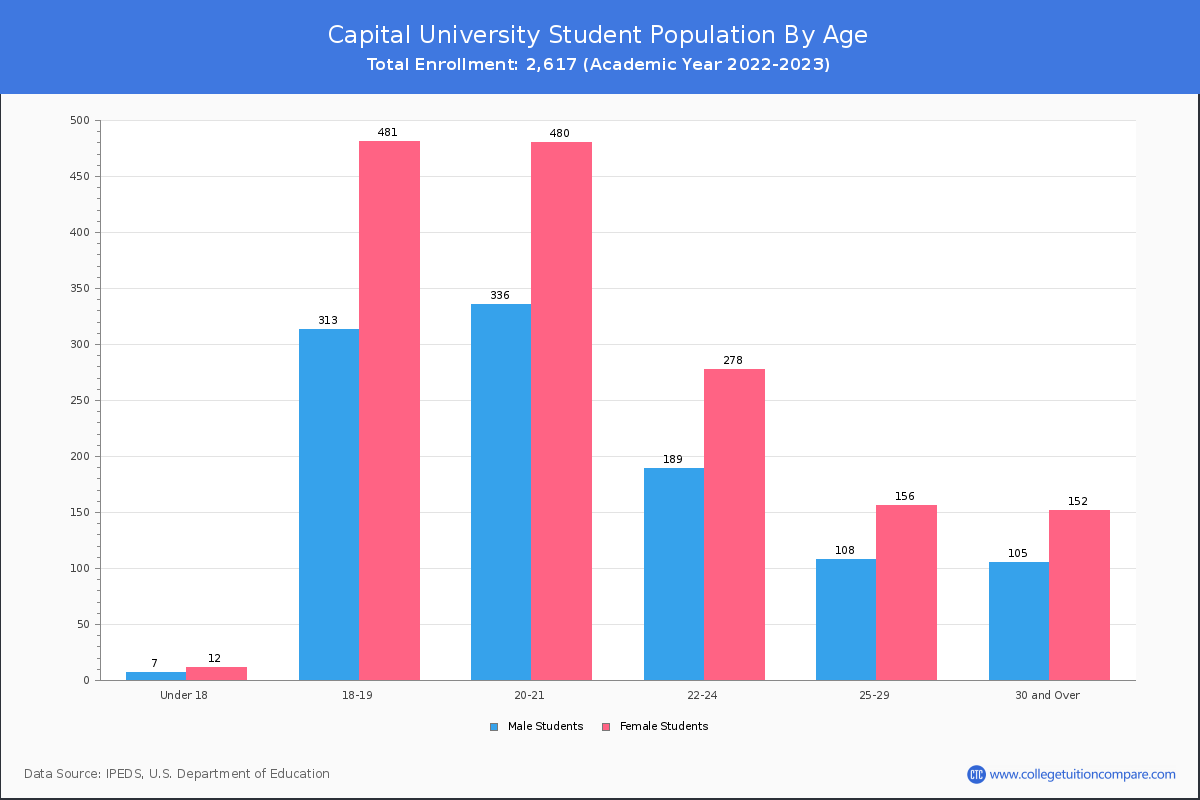
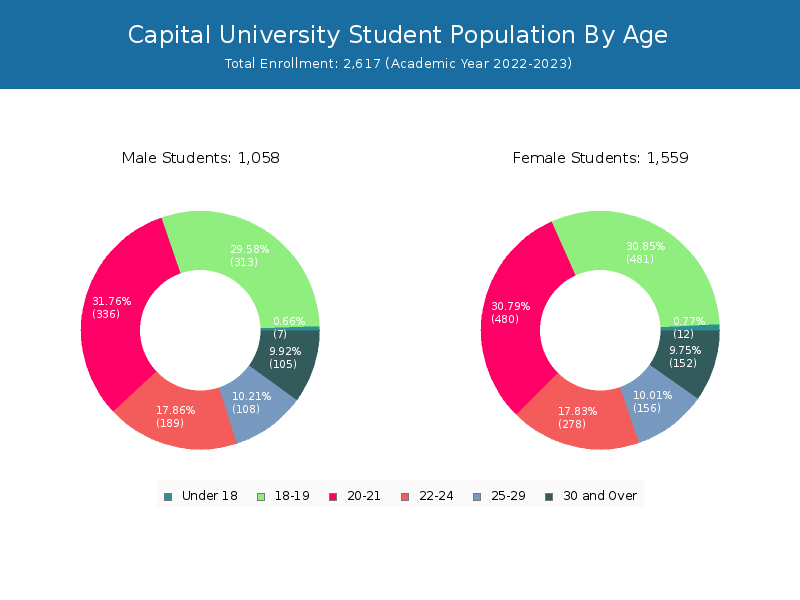
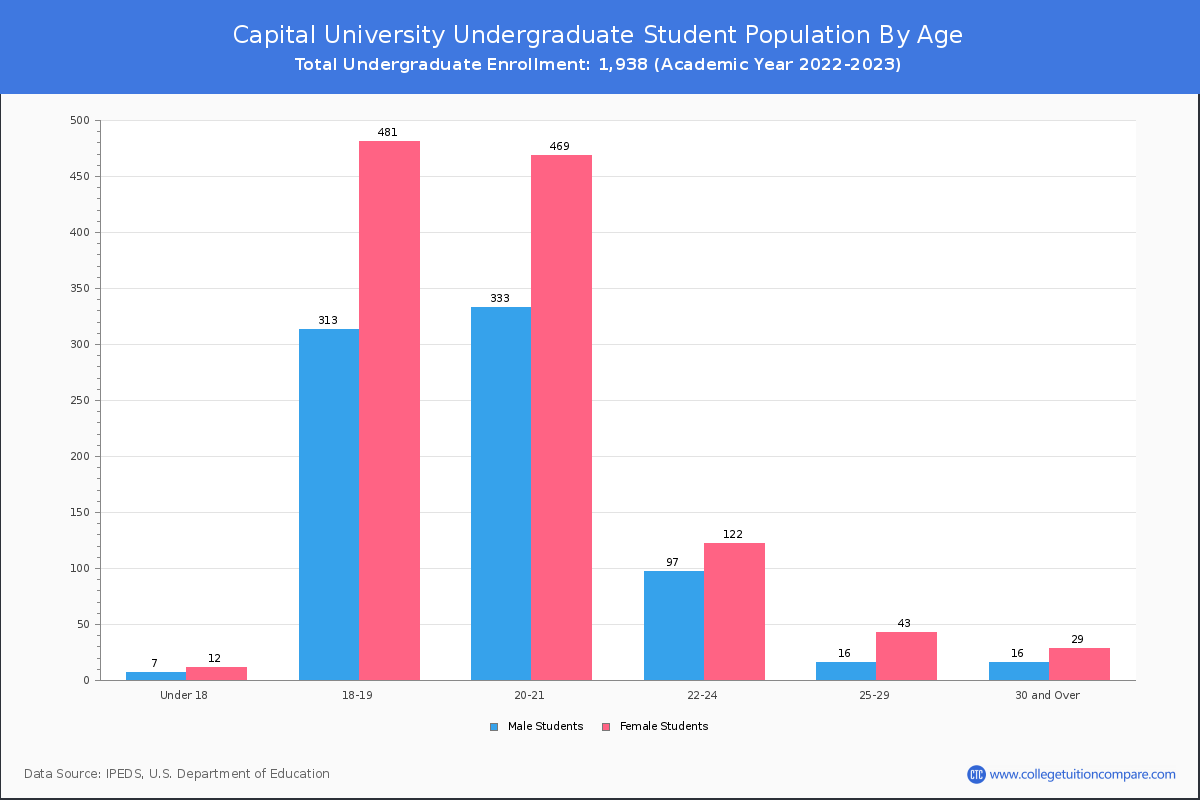
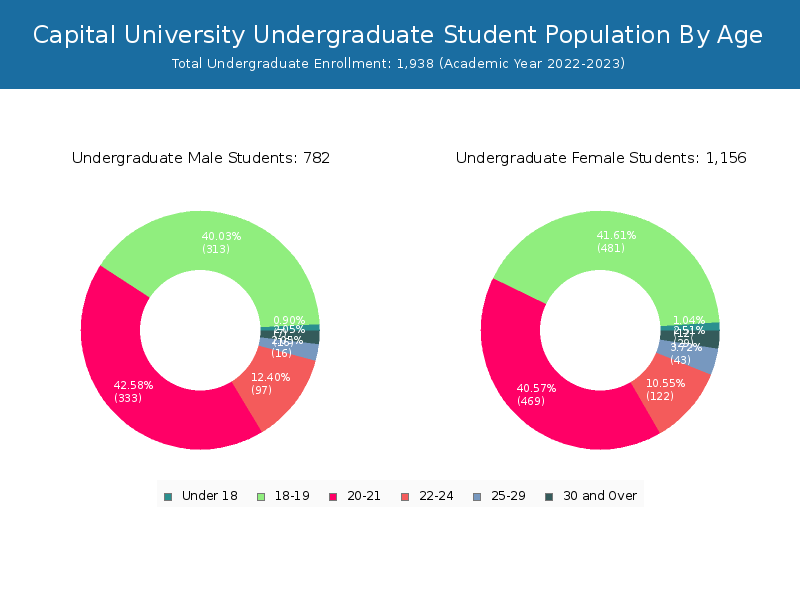
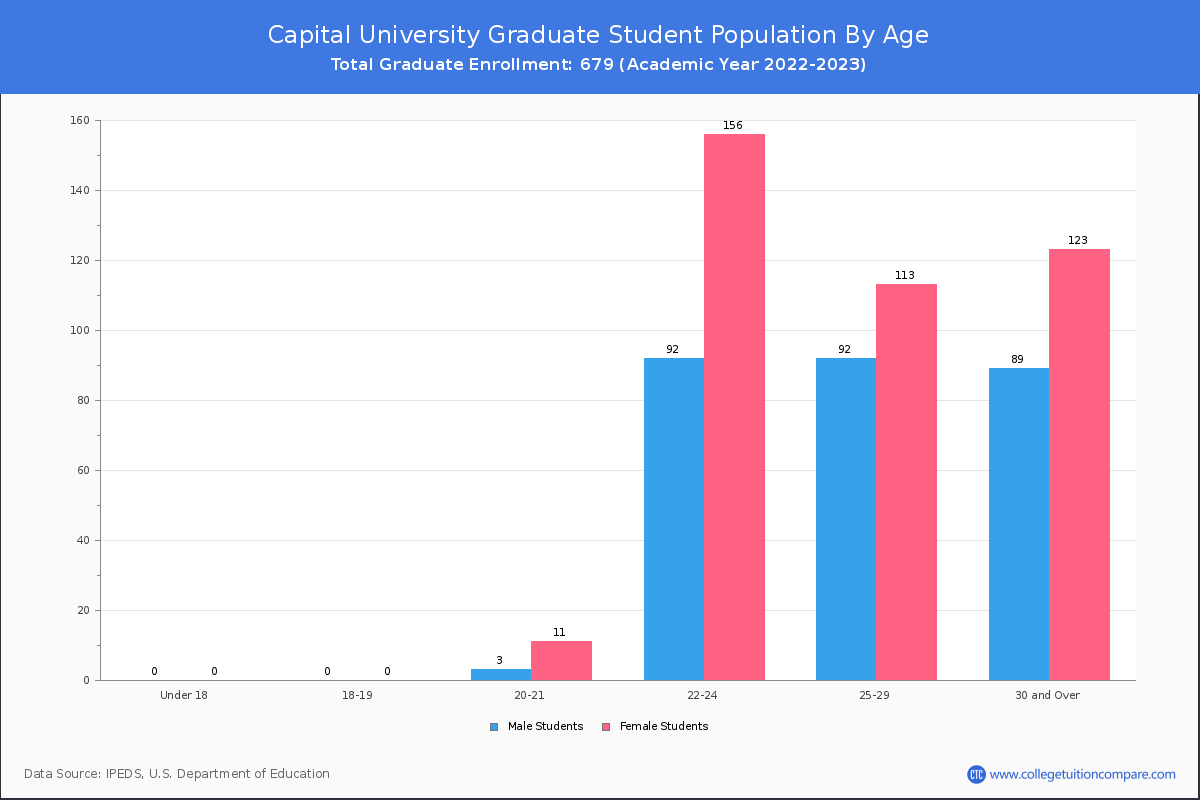
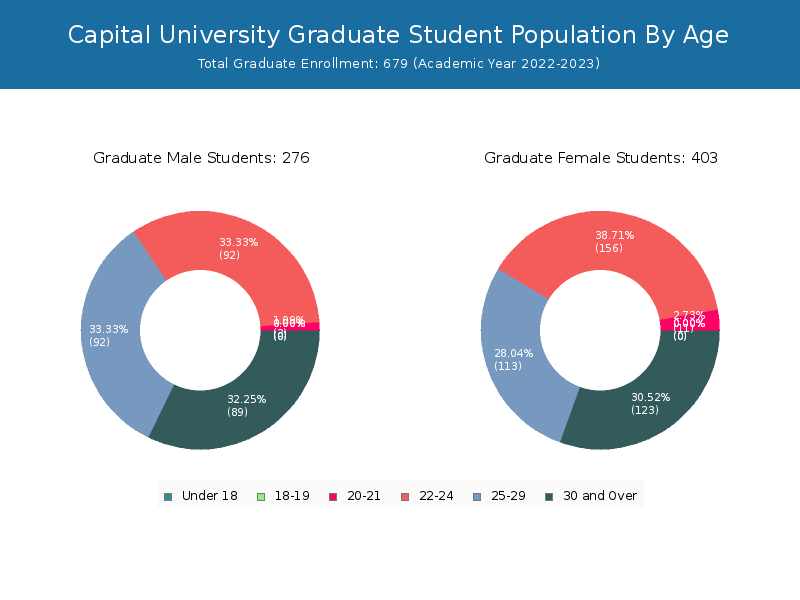
Student Age Distribution
By age, Capital has 15 students under 18 years old and 8 students over 65 years old. There are 1,892 students under 25 years old, and 496 students over 25 years old out of 2,388 total students.
In undergraduate programs, 15 students are younger than 18 and 3 students are older than 65. Capital has 1,632 undergraduate students aged under 25 and 115 students aged 25 and over.
It has 260 graduate students aged under 25 and 381 students aged 25 and over.
| Age | Total | Men | Women |
|---|---|---|---|
| Under 18 | 15 | 8 | 7 |
| 18-19 | 740 | 397 | 343 |
| 20-21 | 693 | 432 | 261 |
| 22-24 | 444 | 259 | 185 |
| 25-29 | 250 | 137 | 113 |
| 30-34 | 81 | 46 | 35 |
| 35-39 | 51 | 29 | 22 |
| 40-49 | 63 | 35 | 28 |
| 50-64 | 43 | 23 | 20 |
| Over 65 | 8 | 3 | 5 |
| Age | Total | Men | Women |
|---|---|---|---|
| Under 18 | 15 | 8 | 7 |
| 18-19 | 740 | 397 | 343 |
| 20-21 | 677 | 420 | 257 |
| 22-24 | 200 | 106 | 94 |
| 25-29 | 52 | 37 | 15 |
| 30-34 | 19 | 14 | 5 |
| 35-39 | 13 | 8 | 5 |
| 40-49 | 17 | 12 | 5 |
| 50-64 | 11 | 4 | 7 |
| Over 65 | 3 | 1 | 2 |
| Age | Total | Men | Women |
|---|---|---|---|
| 20-21 | 16 | 12 | 4 |
| 22-24 | 244 | 153 | 91 |
| 25-29 | 198 | 100 | 98 |
| 30-34 | 62 | 32 | 30 |
| 35-39 | 38 | 21 | 17 |
| 40-49 | 46 | 23 | 23 |
| 50-64 | 32 | 19 | 13 |
| Over 65 | 5 | 2 | 3 |
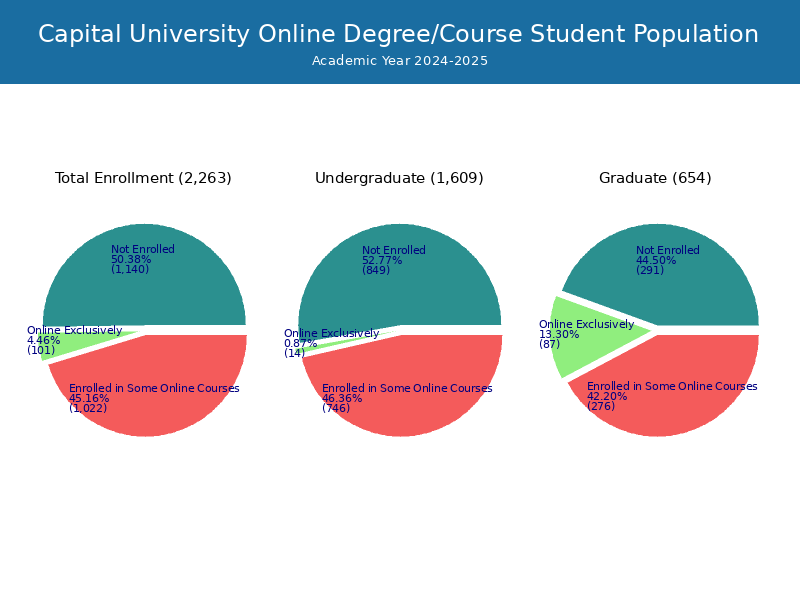
Online Student Enrollment
Distance learning, also called online education, is very attractive to students, especially who want to continue education and work in field. At Capital University, 80 students are enrolled exclusively in online courses and 960 students are enrolled in some online courses.
74 students lived in Ohio or jurisdiction in which the school is located are enrolled exclusively in online courses and 6 students live in other State or outside of the United States.
| All Students | Enrolled Exclusively Online Courses | Enrolled in Some Online Courses | |
|---|---|---|---|
| All Students | 2,388 | 80 | 960 |
| Undergraduate | 1,747 | 33 | 712 |
| Graduate | 641 | 47 | 248 |
| Ohio Residents | Other States in U.S. | Outside of U.S. | |
|---|---|---|---|
| All Students | 74 | 6 | 0 |
| Undergraduate | 29 | 4 | 0 |
| Graduate | 45 | 2 | 0 |
Transfer-in Students (Undergraduate)
Among 1,747 enrolled in undergraduate programs, 88 students have transferred-in from other institutions. The percentage of transfer-in students is 5.04%.80 students have transferred in as full-time status and 8 students transferred in as part-time status.
| Number of Students | |
|---|---|
| Regular Full-time | 1,598 |
| Transfer-in Full-time | 80 |
| Regular Part-time | 61 |
| Transfer-in Part-time | 8 |
Ratings & Review
Share your experiences and thoughts about Capital University. It will be a great help to applicants and prospective students!