The University of Findlay's Graduation Rate
At The University of Findlay, the graduation rate is 63 % within 150% normal time, the retention rate is 72 %, and the transfer-out rate is 25 %, as of August 31, 2024.
Its graduation rate is around the average rate when comparing similar colleges' rate of 59.93% (private (not-for-profit) Doctoral / Research University).
Graduation Rates in Reasonable Completion Time
For the academic year 2023-2024, 372 students out of 594 candidates have completed their courses within 150% normal time (i.e. in 6 years for 4-year BS degree) at The University of Findlay.
By gender, 96 male and 276 female students graduated the school last year completing their jobs in the period.
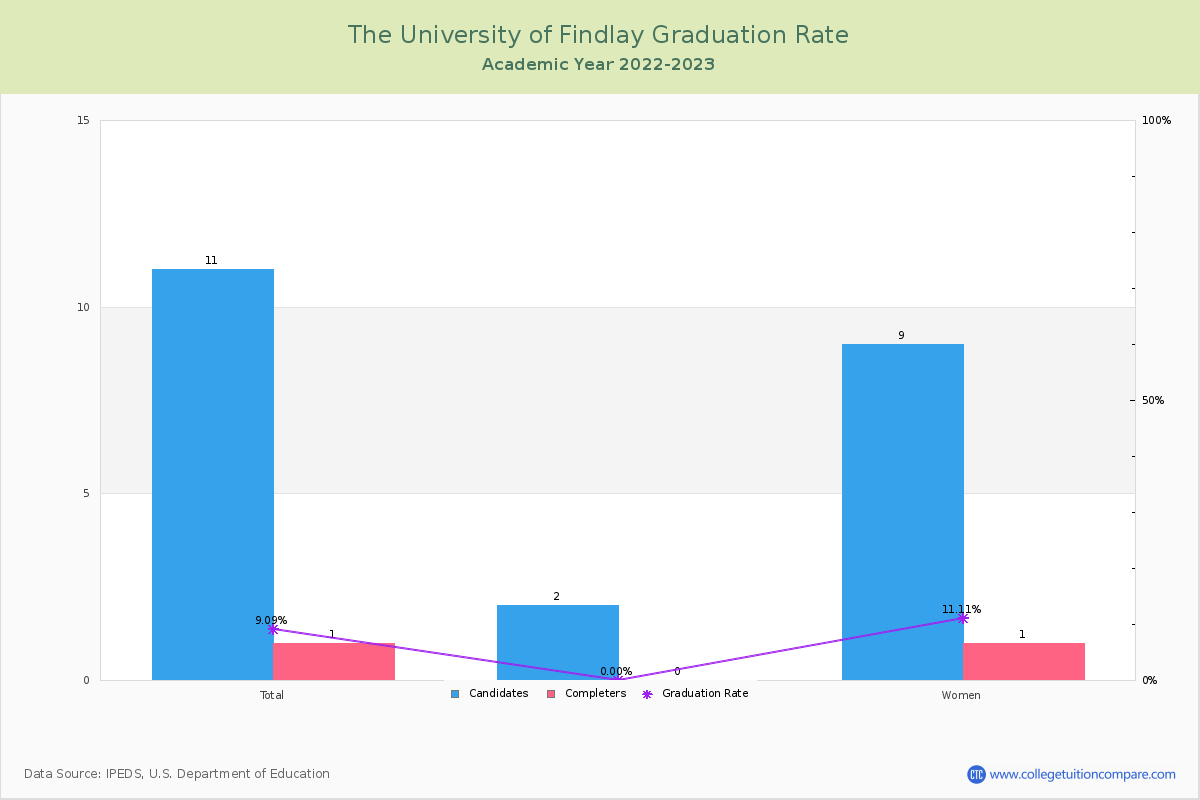
| Candidates | Completers | Graduation Rates | |
|---|---|---|---|
| Total | 594 | 372 | 62.63% |
| Men | 173 | 96 | 55.49% |
| Women | 421 | 276 | 65.56% |
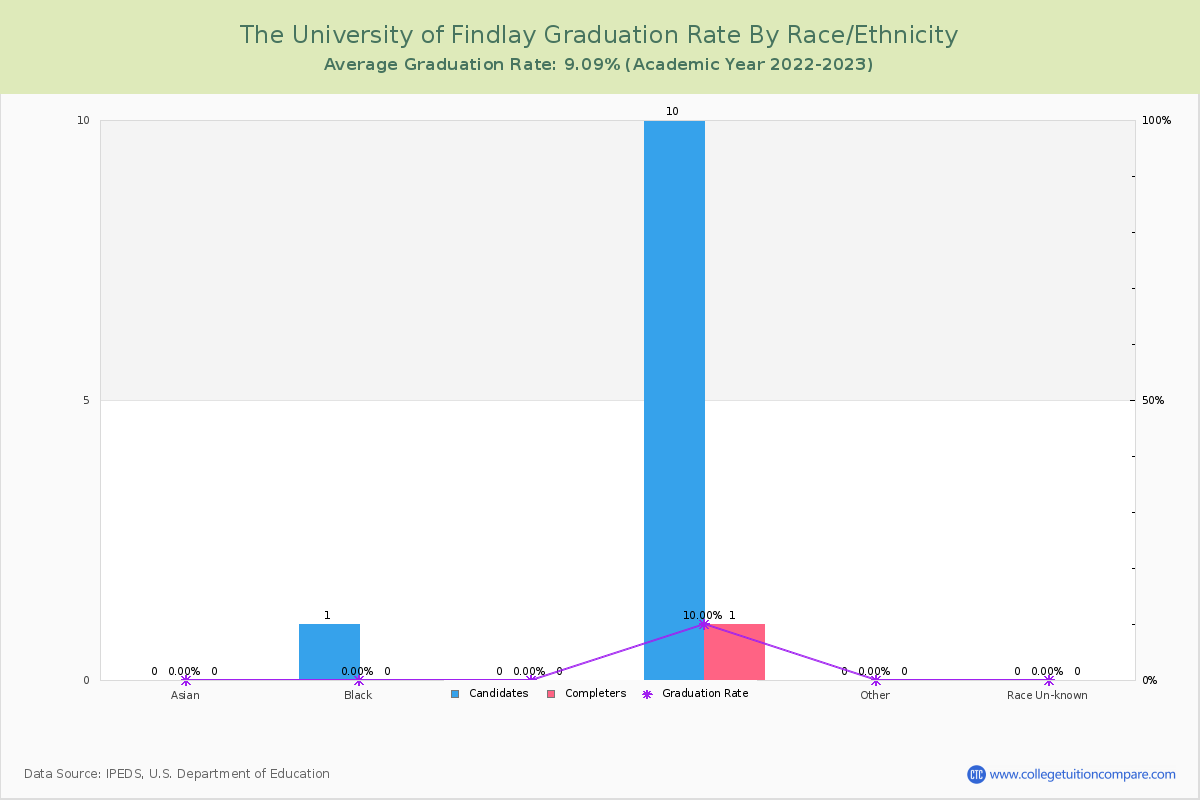
Graduation Rate By Race/Ethnicity
The following table shows graduation rate by race and at The University of Findlay.
- American Indian or Alaska Native: 0.00%
- Asian: 87.50%
- Black (Non-Hispanic): 34.78%
- Hispanic: 66.67%
- White: 64.26%
- Native Hawaiian or Other Pacific Islander: 0.00%
- Two or More Race: 43.75%
- Unknown: 0.00%
| Total | Male | Female | |
|---|---|---|---|
| American Indian or Alaska Native | 0.00%(-/1) | - | - |
| Asian | 87.50%(7/8) | 100.00%(2/2) | 83.33%(5/6) |
| Black (Non-Hispanic) | 34.78%(8/23) | 27.78%(5/18) | 60.00%(3/5) |
| Hispanic | 66.67%(12/18) | 75.00%(3/4) | 64.29%(9/14) |
| White | 64.26%(338/526) | 59.15%(84/142) | 66.15%(254/384) |
| Native Hawaiian or Other Pacific Islander | 0.00%(-/1) | - | - |
| Two or More Race | 43.75%(7/16) | 33.33%(2/6) | 50.00%(5/10) |
| Unknown | 0.00%(-/1) | - | - |
Transfer-out and Retention Rates
At The University of Findlay, the transfer-out rate is 24.92%. Its transfer-out rate is higher than the average rate when comparing similar colleges' rate of 19.03%.
The University of Findlay's retention rate is 72% last year. Its retention rate is around the average rate when comparing similar colleges' rate of 75.60%.
-
Transfer-out Rate
-
Retention Rate
Ratings & Review
Share your experiences and thoughts about The University of Findlay. It will be a great help to applicants and prospective students!