Kent State University at Stark's Graduation Rate
At Kent State University at Stark, the graduation rate is 37 % within 150% normal time, the retention rate is 53 %, and the transfer-out rate is 1 %, as of August 31, 2024.
Its graduation rate is relatively higher than the average rate when comparing similar colleges' rate of 32.82% (public primarily Associate's college).
Graduation Rates in Reasonable Completion Time
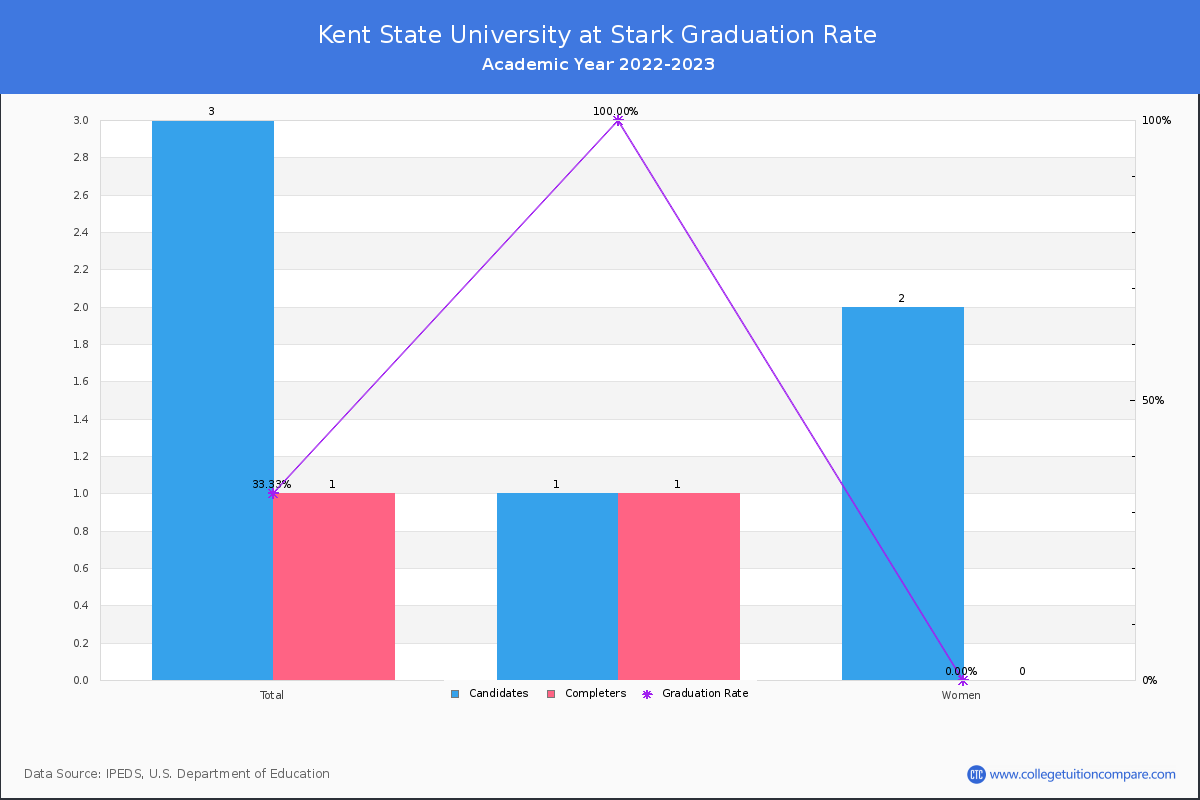
For the academic year 2023-2024, 196 students out of 526 candidates have completed their courses within 150% normal time (i.e. in 6 years for 4-year BS degree) at Kent State University at Stark.
By gender, 80 male and 116 female students graduated the school last year completing their jobs in the period.
| Candidates | Completers | Graduation Rates | |
|---|---|---|---|
| Total | 526 | 196 | 37.26% |
| Men | 216 | 80 | 37.04% |
| Women | 310 | 116 | 37.42% |
Graduation Rate By Race/Ethnicity
The following table shows graduation rate by race and at Kent State University at Stark.
- American Indian or Alaska Native: 0.00%
- Asian: 50.00%
- Black (Non-Hispanic): 8.70%
- Hispanic: 30.00%
- White: 40.36%
- Native Hawaiian or Other Pacific Islander: 100.00%
- Two or More Race: 16.00%
- Unknown: 28.57%
| Total | Male | Female | |
|---|---|---|---|
| American Indian or Alaska Native | 0.00%(-/1) | - | - |
| Asian | 50.00%(2/4) | - | 50.00%(2/4) |
| Black (Non-Hispanic) | 8.70%(2/23) | - | 13.33%(2/15) |
| Hispanic | 30.00%(3/10) | 50.00%(2/4) | 16.67%(1/6) |
| White | 40.36%(180/446) | 39.78%(74/186) | 40.77%(106/260) |
| Native Hawaiian or Other Pacific Islander | 100.00%(1/1) | 100.00%(1/1) | - |
| Two or More Race | 16.00%(4/25) | 16.67%(2/12) | 15.38%(2/13) |
| Unknown | 28.57%(4/14) | 25.00%(1/4) | 30.00%(3/10) |

Transfer-out and Retention Rates
At Kent State University at Stark, the transfer-out rate is 1.14%. Its transfer-out rate is much lower than the average rate when comparing similar colleges' rate of 17.38%.
Kent State University at Stark's retention rate is 53% for full-time students and 34 % for part-time students last year. Its retention rate is relatively lower than the average rate when comparing similar colleges' rate of 66.05%.
-
Transfer-out Rate
-
Retention Rate (Full-time)
-
Retention Rate (Part-time)
Ratings & Review
Share your experiences and thoughts about Kent State University at Stark. It will be a great help to applicants and prospective students!