How many students at Winthrop? For the academic year 2023-2024, total of 4,694 students have enrolled in Winthrop University with 3,787 undergraduate and 907 graduate students.
By gender, 1,458 male and 3,236 female students are attending the school.
It has much fewer students compared to similar colleges (9,905 students in average - public Master's College and University (larger programs)).
655 students are enrolled exclusively, and 2,379 students are enrolled in some online courses.
You can check the student demographics by gender ratio, race/ethnicity, age distribution, and online enrollment.
Student Population by Gender
Winthrop University has a total of 4,694 enrolled students for the academic year 2023-2024. 3,787 students have enrolled in undergraduate programs and 907 students joined graduate programs.
By gender, 1,458 male and 3,236 female students (the male-female ratio is 31:69) are attending the school. The gender distribution is based on the 2023-2024 data.
| Total | Undergraduate | Graduate | |
|---|---|---|---|
| Total | 4,694 | 3,787 | 907 |
| Men | 1,458 | 1,296 | 162 |
| Women | 3,236 | 2,491 | 745 |
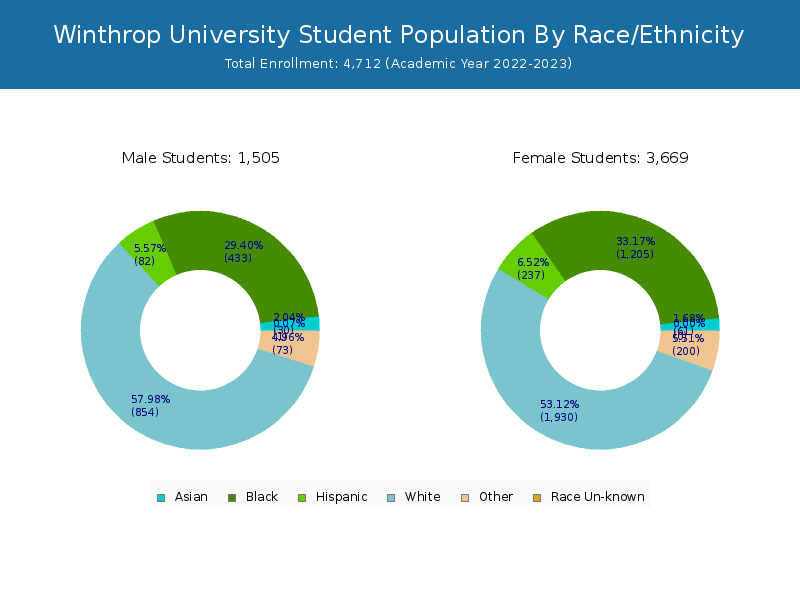

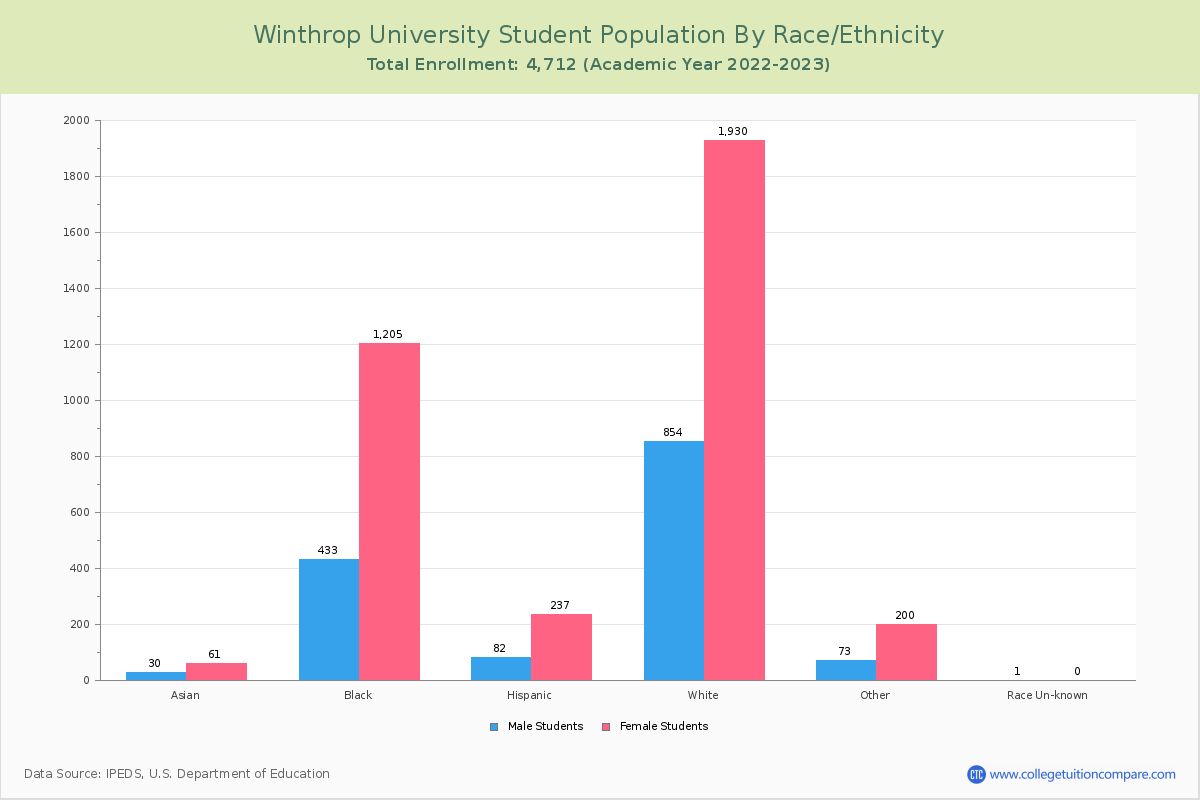
Student Distribution by Race/Ethnicity
By race/ethnicity, 2,497 White, 1,432 Black, and 94 Asian students out of a total of 4,694 are attending at Winthrop University. Comprehensive enrollment statistic data by race/ethnicity is shown in chart below (academic year 2023-2024 data).
| Race | Total | Men | Women |
|---|---|---|---|
| American Indian or Native American | 13 | 6 | 7 |
| Asian | 94 | 50 | 44 |
| Black | 1,432 | 407 | 1,025 |
| Hispanic | 336 | 101 | 235 |
| Native Hawaiian or Other Pacific Islanders | 4 | 1 | 3 |
| White | 2,497 | 786 | 1,711 |
| Two or more races | 238 | 64 | 174 |
| Race Unknown | 2 | 1 | 1 |
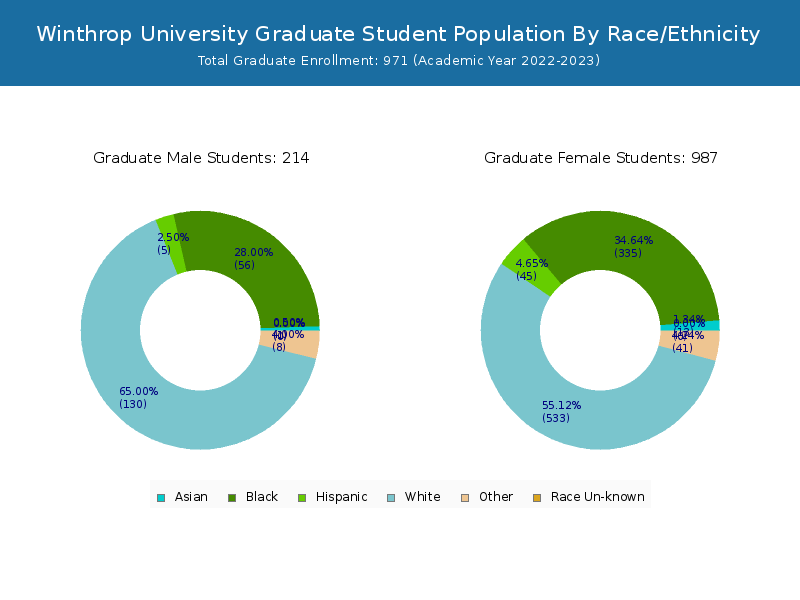
| Race | Total | Men | Women |
|---|---|---|---|
| American Indian or Native American | 10 | 5 | 5 |
| Asian | 85 | 46 | 39 |
| Black | 1,134 | 363 | 771 |
| Hispanic | 295 | 97 | 198 |
| Native Hawaiian or Other Pacific Islanders | 3 | 1 | 2 |
| White | 1,999 | 688 | 1,311 |
| Two or more races | 200 | 60 | 140 |
| Race Unknown | 2 | 1 | 1 |
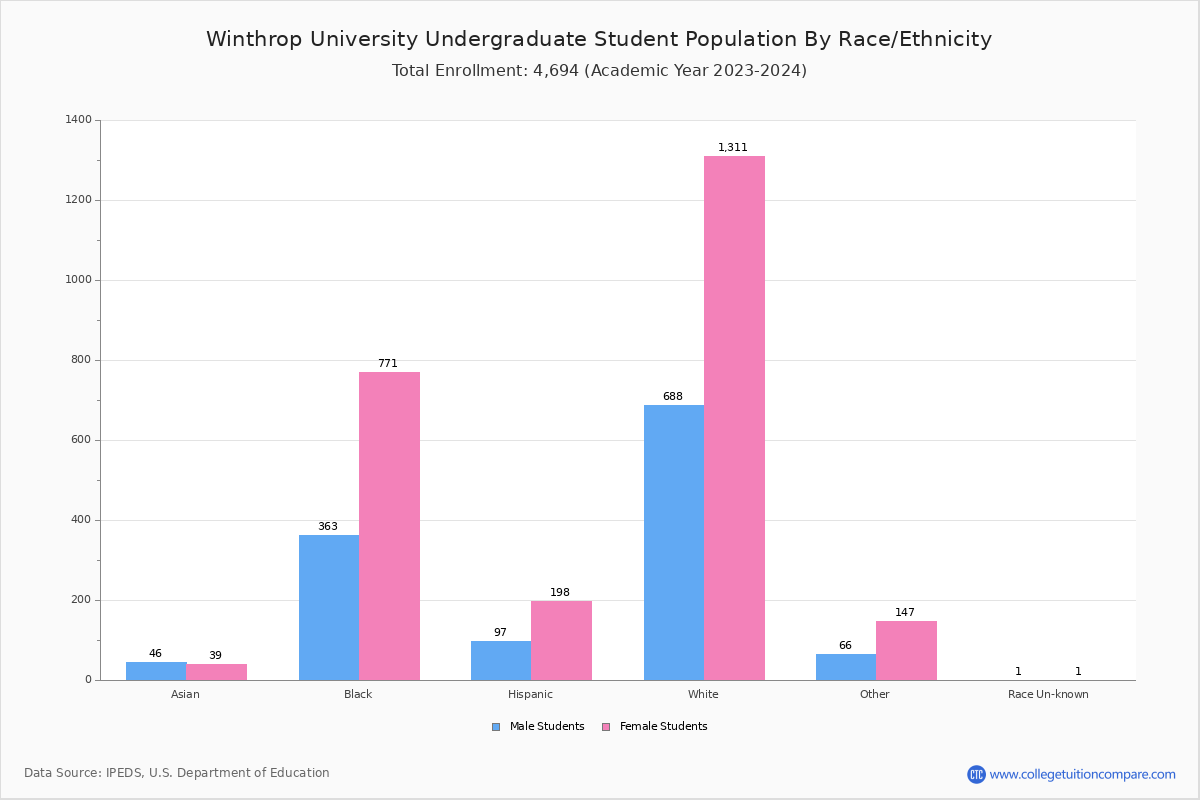
| Race | Total | Men | Women |
|---|---|---|---|
| American Indian or Native American | 3 | 1 | 2 |
| Asian | 9 | 4 | 5 |
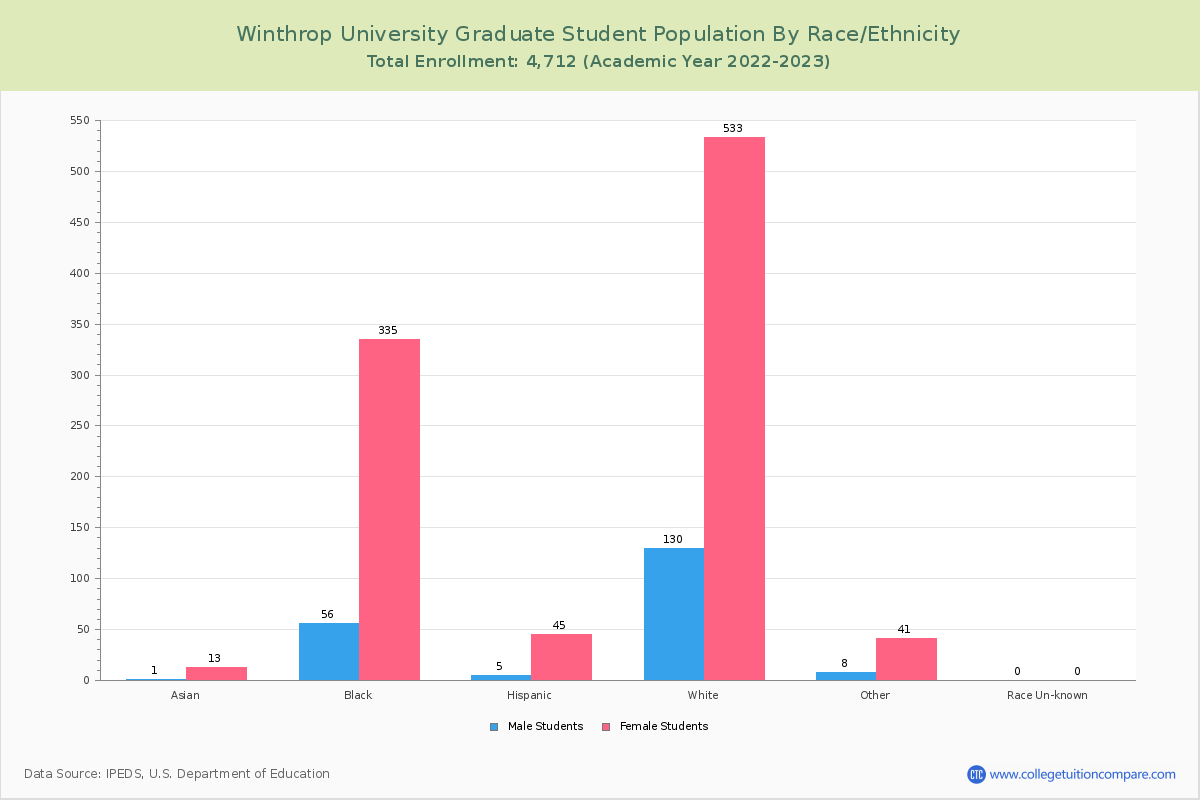
| Black | 298 | 44 | 254 |
| Hispanic | 41 | 4 | 37 |
| Native Hawaiian or Other Pacific Islanders | 1 | 0 | 1 |
| White | 498 | 98 | 400 |
| Two or more races | 38 | 4 | 34 |
| Race Unknown | - | - | - |
Student Age Distribution
By age, Winthrop has 337 students under 18 years old and 50 students over 65 years old. There are 3,795 students under 25 years old, and 899 students over 25 years old out of 4,694 total students.
In undergraduate programs, 337 students are younger than 18 and 30 students are older than 65. Winthrop has 3,521 undergraduate students aged under 25 and 266 students aged 25 and over.
It has 274 graduate students aged under 25 and 633 students aged 25 and over.
| Age | Total | Men | Women |
|---|---|---|---|
| Under 18 | 337 | 230 | 107 |
| 18-19 | 1,357 | 952 | 405 |
| 20-21 | 1,313 | 873 | 440 |
| 22-24 | 788 | 502 | 286 |
| 25-29 | 350 | 244 | 106 |
| 30-34 | 143 | 111 | 32 |
| 35-39 | 110 | 86 | 24 |
| 40-49 | 147 | 128 | 19 |
| 50-64 | 99 | 82 | 17 |
| Over 65 | 50 | 28 | 22 |
| Age | Total | Men | Women |
|---|---|---|---|
| Under 18 | 337 | 230 | 107 |
| 18-19 | 1,357 | 952 | 405 |
| 20-21 | 1,289 | 852 | 437 |
| 22-24 | 538 | 301 | 237 |
| 25-29 | 112 | 54 | 58 |
| 30-34 | 50 | 31 | 19 |
| 35-39 | 27 | 18 | 9 |
| 40-49 | 25 | 19 | 6 |
| 50-64 | 22 | 18 | 4 |
| Over 65 | 30 | 16 | 14 |
| Age | Total | Men | Women |
|---|---|---|---|
| 20-21 | 24 | 21 | 3 |
| 22-24 | 250 | 201 | 49 |
| 25-29 | 238 | 190 | 48 |
| 30-34 | 93 | 80 | 13 |
| 35-39 | 83 | 68 | 15 |
| 40-49 | 122 | 109 | 13 |
| 50-64 | 77 | 64 | 13 |
| Over 65 | 20 | 12 | 8 |


Online Student Enrollment
Distance learning, also called online education, is very attractive to students, especially who want to continue education and work in field. At Winthrop University, 655 students are enrolled exclusively in online courses and 2,379 students are enrolled in some online courses.
495 students lived in South Carolina or jurisdiction in which the school is located are enrolled exclusively in online courses and 160 students live in other State or outside of the United States.
| All Students | Enrolled Exclusively Online Courses | Enrolled in Some Online Courses | |
|---|---|---|---|
| All Students | 4,694 | 655 | 2,379 |
| Undergraduate | 3,787 | 89 | 2,246 |
| Graduate | 907 | 566 | 133 |
| South Carolina Residents | Other States in U.S. | Outside of U.S. | |
|---|---|---|---|
| All Students | 495 | 156 | 4 |
| Undergraduate | 82 | 7 | 0 |
| Graduate | 413 | 149 | 4 |

Transfer-in Students (Undergraduate)
Among 3,787 enrolled in undergraduate programs, 268 students have transferred-in from other institutions. The percentage of transfer-in students is 7.08%.250 students have transferred in as full-time status and 18 students transferred in as part-time status.
| Number of Students | |
|---|---|
| Regular Full-time | 2,964 |
| Transfer-in Full-time | 250 |
| Regular Part-time | 555 |
| Transfer-in Part-time | 18 |
Ratings & Review
Share your experiences and thoughts about Winthrop University. It will be a great help to applicants and prospective students!