Rice's Graduation Rate
At Rice University, the graduation rate is 96 % within 150% normal time, the retention rate is 98 %, as of August 31, 2024.
Its graduation rate is around the average rate when comparing similar colleges' rate of 91.03% (private (not-for-profit) Research University with very high research activity).
Graduation Rates in Reasonable Completion Time
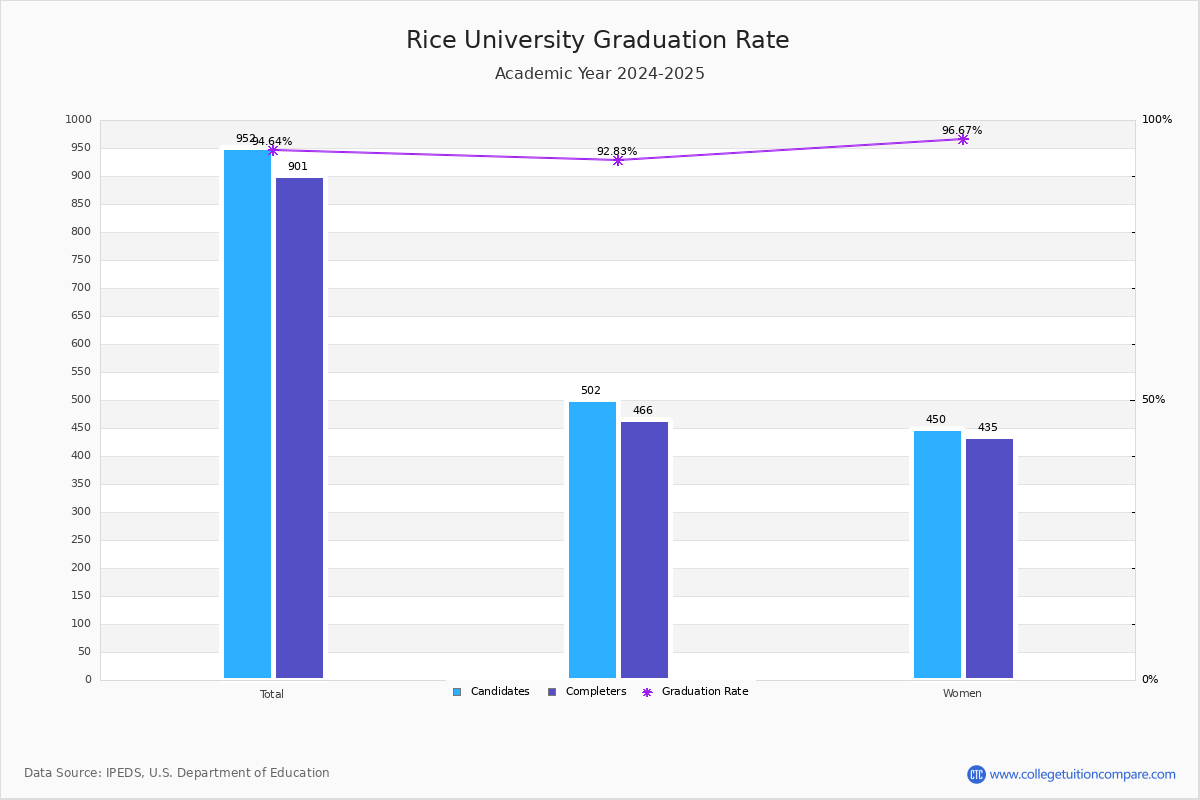
For the academic year 2023-2024, 998 students out of 1,043 candidates have completed their courses within 150% normal time (i.e. in 6 years for 4-year BS degree) at Rice University.
By gender, 504 male and 494 female students graduated the school last year completing their jobs in the period.
| Candidates | Completers | Graduation Rates | |
|---|---|---|---|
| Total | 1,043 | 998 | 95.69% |
| Men | 535 | 504 | 94.21% |
| Women | 508 | 494 | 97.24% |
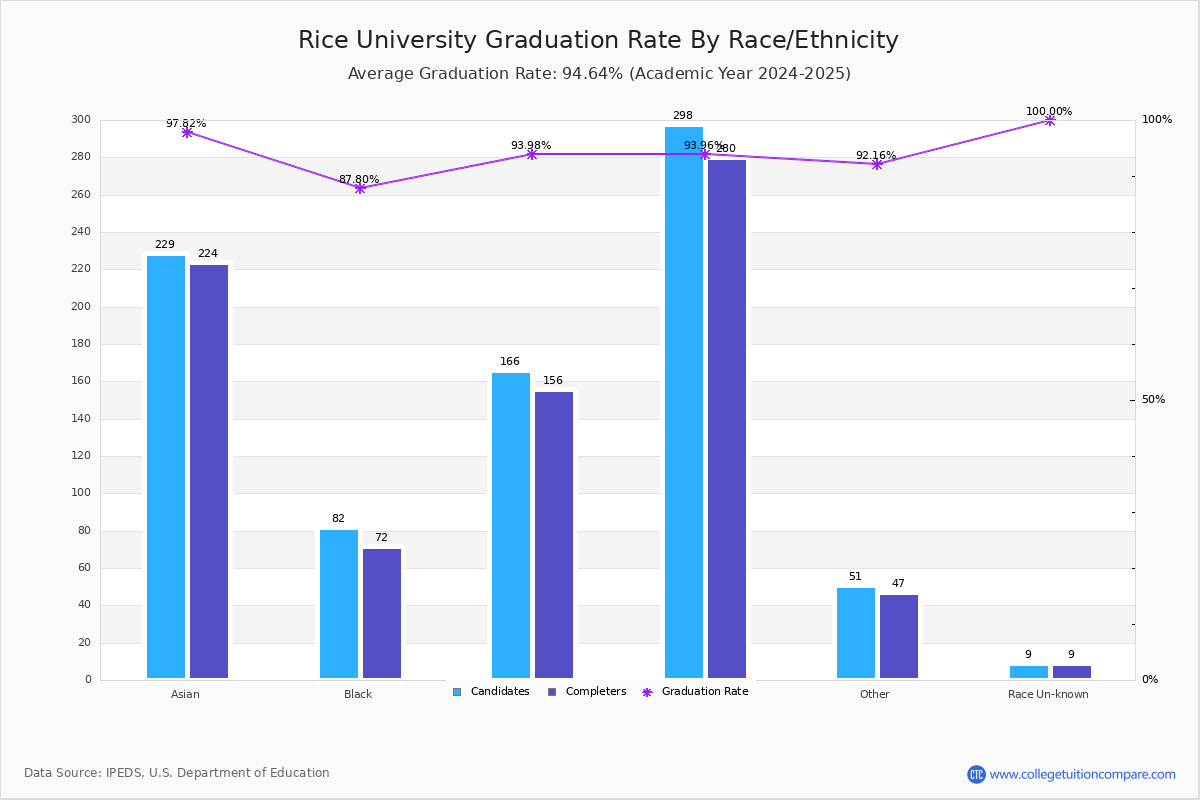
Graduation Rate By Race/Ethnicity
The following table shows graduation rate by race and at Rice University.
- American Indian or Alaska Native: 100.00%
- Asian: 99.00%
- Black (Non-Hispanic): 92.11%
- Hispanic: 91.80%
- White: 94.74%
- Native Hawaiian or Other Pacific Islander: 100.00%
- Two or More Race: 96.08%
- Unknown: 100.00%
| Total | Male | Female | |
|---|---|---|---|
| American Indian or Alaska Native | 100.00%(2/2) | 100.00%(1/1) | 100.00%(1/1) |
| Asian | 99.00%(297/300) | 100.00%(134/134) | 98.19%(163/166) |
| Black (Non-Hispanic) | 92.11%(70/76) | 92.31%(36/39) | 91.89%(34/37) |
| Hispanic | 91.80%(168/183) | 86.14%(87/101) | 98.78%(81/82) |
| White | 94.74%(288/304) | 92.90%(157/169) | 97.04%(131/135) |
| Native Hawaiian or Other Pacific Islander | 100.00%(2/2) | 100.00%(1/1) | 100.00%(1/1) |
| Two or More Race | 96.08%(49/51) | 95.83%(23/24) | 96.30%(26/27) |
| Unknown | 100.00%(15/15) | 100.00%(9/9) | 100.00%(6/6) |
Non-Resident Alien Graduation Rate
A non-resident alien student is not a US citizen/green card holder and studies with a student visa, such as an F visa, in the United States. At Rice University, 107 of 110 non-resident alien students completed their studies and the graduation rate was 102.36%.
-
Non-Resident Alien Graduation Rate
Ratings & Review
Share your experiences and thoughts about Rice University. It will be a great help to applicants and prospective students!