How many students at Regent? For the academic year 2023-2024, total of 10,168 students have enrolled in Regent University with 4,577 undergraduate and 5,591 graduate students.
By gender, 3,695 male and 6,473 female students are attending the school.
It has significantly more students compared to similar colleges (5,560 students in average - private (not-for-profit) Doctoral / Research University).
8,213 students are enrolled exclusively, and 1,223 students are enrolled in some online courses.
You can check the student demographics by gender ratio, race/ethnicity, age distribution, and online enrollment.
Student Population by Gender
Regent University has a total of 10,168 enrolled students for the academic year 2023-2024. 4,577 students have enrolled in undergraduate programs and 5,591 students joined graduate programs.
By gender, 3,695 male and 6,473 female students (the male-female ratio is 36:64) are attending the school. The gender distribution is based on the 2023-2024 data.
| Total | Undergraduate | Graduate | |
|---|---|---|---|
| Total | 10,168 | 4,577 | 5,591 |
| Men | 3,695 | 1,745 | 1,950 |
| Women | 6,473 | 2,832 | 3,641 |
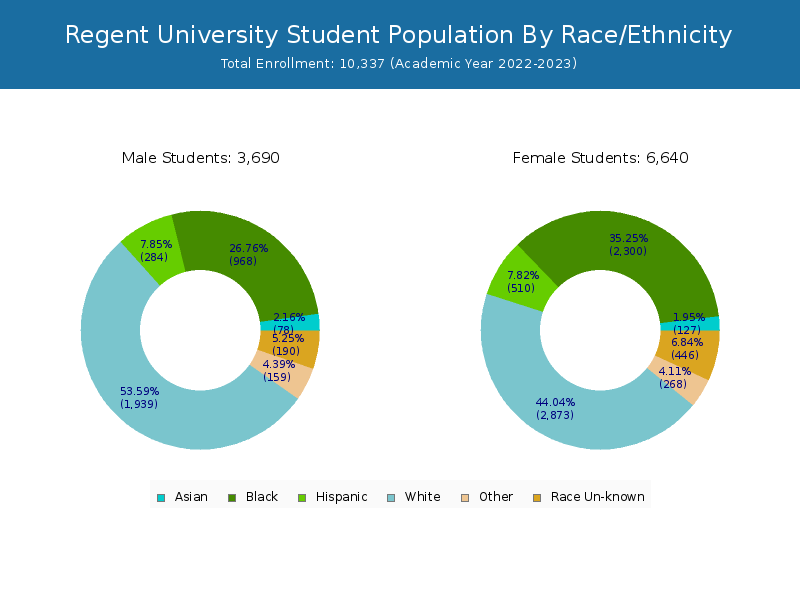
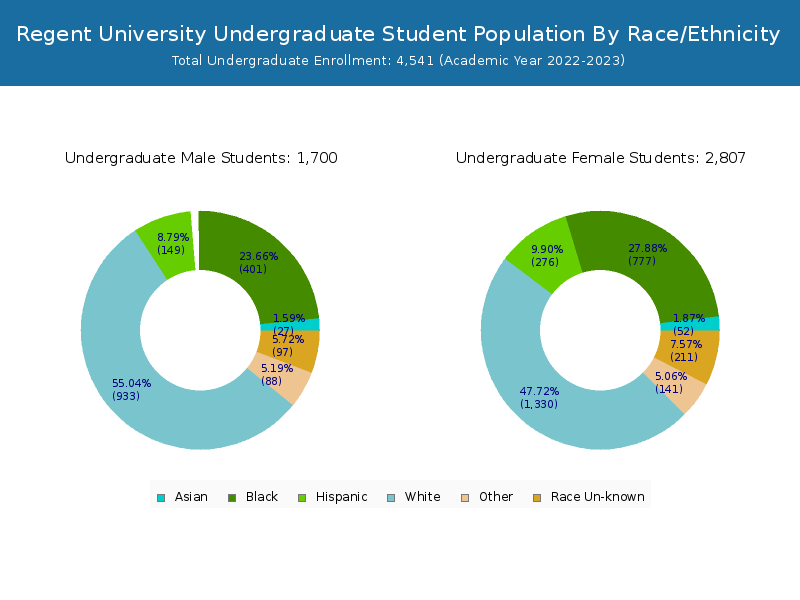

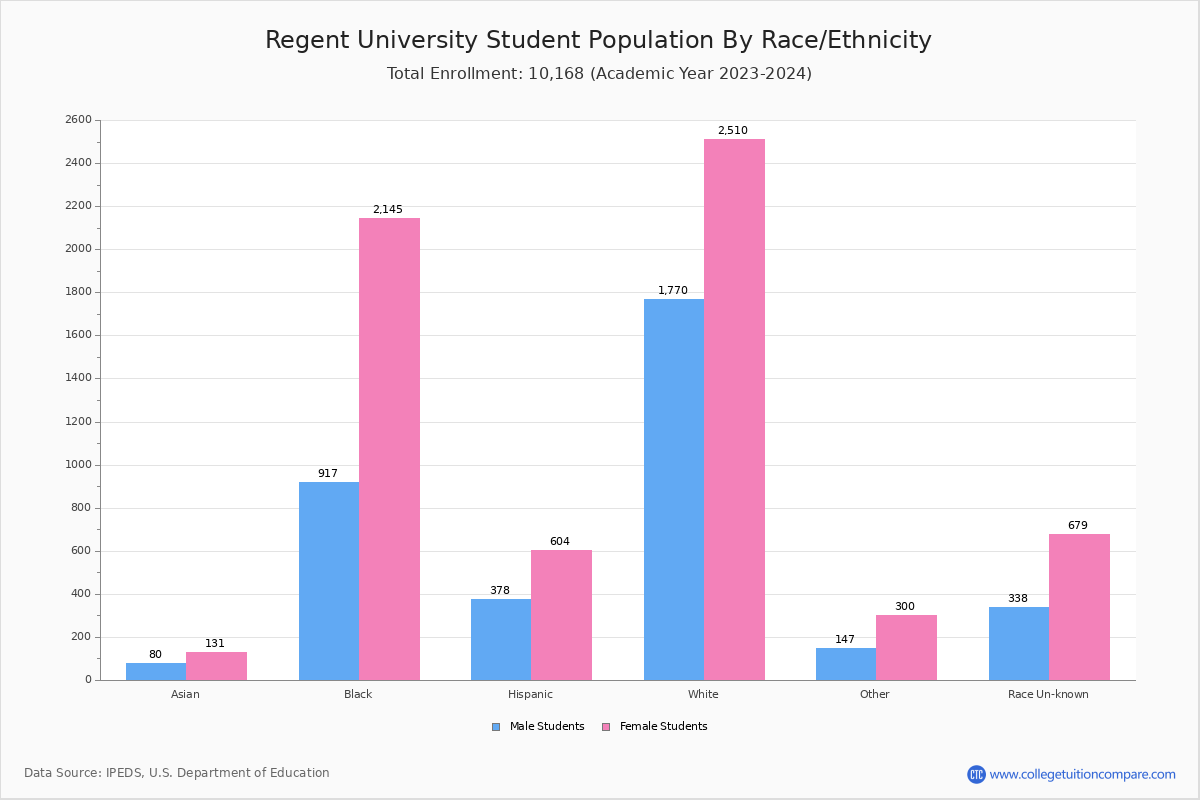
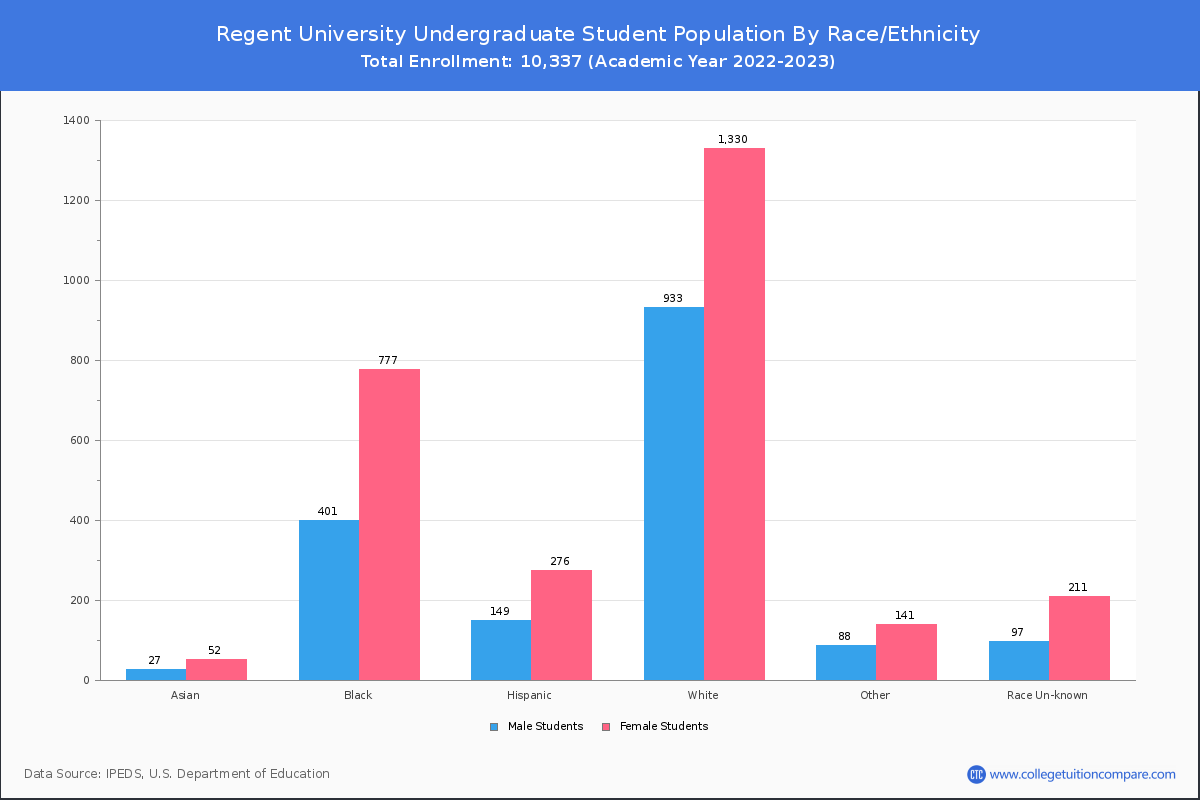
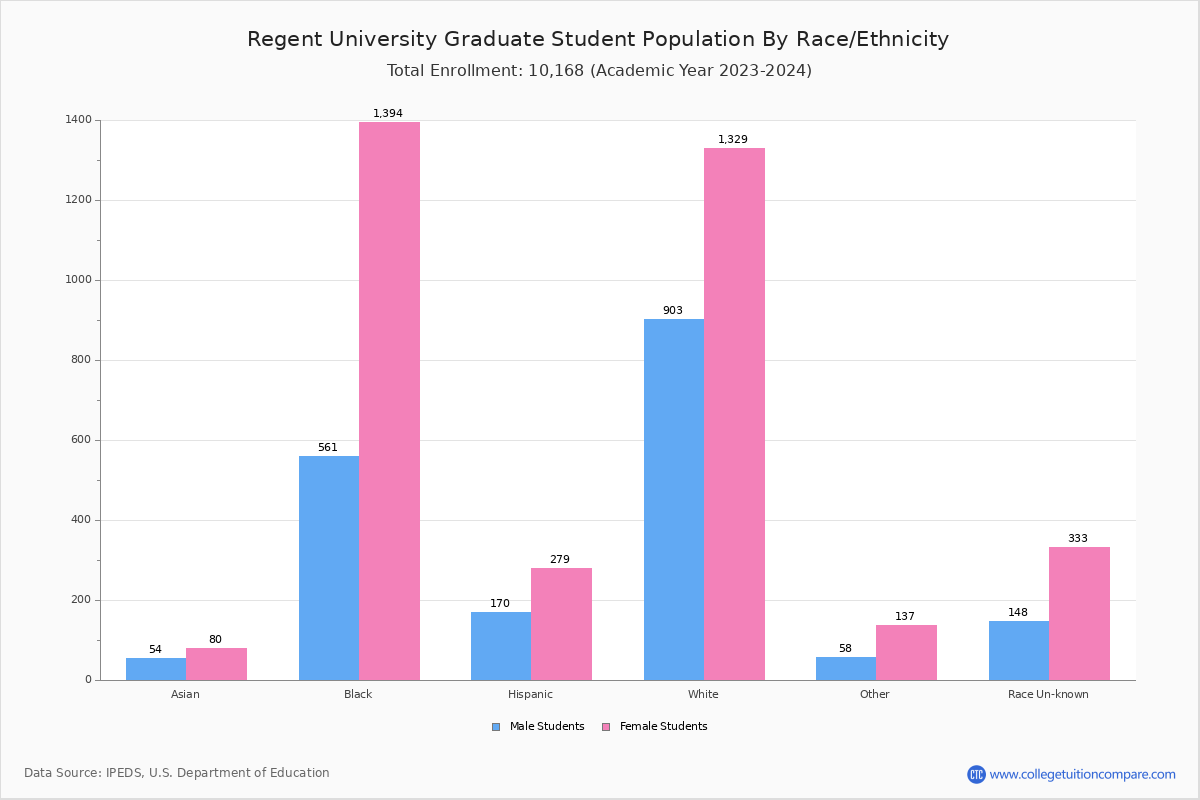
Student Distribution by Race/Ethnicity
By race/ethnicity, 4,280 White, 3,062 Black, and 211 Asian students out of a total of 10,168 are attending at Regent University. Comprehensive enrollment statistic data by race/ethnicity is shown in chart below (academic year 2023-2024 data).
| Race | Total | Men | Women |
|---|---|---|---|
| American Indian or Native American | 59 | 13 | 46 |
| Asian | 211 | 80 | 131 |
| Black | 3,062 | 917 | 2,145 |
| Hispanic | 982 | 378 | 604 |
| Native Hawaiian or Other Pacific Islanders | 32 | 13 | 19 |
| White | 4,280 | 1,770 | 2,510 |
| Two or more races | 356 | 121 | 235 |
| Race Unknown | 1,017 | 338 | 679 |
| Race | Total | Men | Women |
|---|---|---|---|
| American Indian or Native American | 33 | 6 | 27 |
| Asian | 77 | 26 | 51 |
| Black | 1,107 | 356 | 751 |
| Hispanic | 533 | 208 | 325 |
| Native Hawaiian or Other Pacific Islanders | 24 | 8 | 16 |
| White | 2,048 | 867 | 1,181 |
| Two or more races | 195 | 75 | 120 |
| Race Unknown | 536 | 190 | 346 |
| Race | Total | Men | Women |
|---|---|---|---|
| American Indian or Native American | 26 | 7 | 19 |
| Asian | 134 | 54 | 80 |
| Black | 1,955 | 561 | 1,394 |
| Hispanic | 449 | 170 | 279 |
| Native Hawaiian or Other Pacific Islanders | 8 | 5 | 3 |
| White | 2,232 | 903 | 1,329 |
| Two or more races | 161 | 46 | 115 |
| Race Unknown | 481 | 148 | 333 |
Student Age Distribution
By age, Regent has 226 students under 18 years old and 349 students over 65 years old. There are 2,367 students under 25 years old, and 7,801 students over 25 years old out of 10,168 total students.
In undergraduate programs, 226 students are younger than 18 and 80 students are older than 65. Regent has 1,905 undergraduate students aged under 25 and 2,672 students aged 25 and over.
It has 462 graduate students aged under 25 and 5,129 students aged 25 and over.
| Age | Total | Men | Women |
|---|---|---|---|
| Under 18 | 226 | 157 | 69 |
| 18-19 | 586 | 338 | 248 |
| 20-21 | 656 | 396 | 260 |
| 22-24 | 899 | 545 | 354 |
| 25-29 | 1,274 | 776 | 498 |
| 30-34 | 1,026 | 646 | 380 |
| 35-39 | 1,150 | 758 | 392 |
| 40-49 | 2,146 | 1,424 | 722 |
| 50-64 | 1,856 | 1,208 | 648 |
| Over 65 | 349 | 225 | 124 |
| Age | Total | Men | Women |
|---|---|---|---|
| Under 18 | 226 | 157 | 69 |
| 18-19 | 586 | 338 | 248 |
| 20-21 | 631 | 379 | 252 |
| 22-24 | 462 | 256 | 206 |
| 25-29 | 511 | 278 | 233 |
| 30-34 | 443 | 274 | 169 |
| 35-39 | 446 | 290 | 156 |
| 40-49 | 678 | 461 | 217 |
| 50-64 | 514 | 344 | 170 |
| Over 65 | 80 | 55 | 25 |
| Age | Total | Men | Women |
|---|---|---|---|
| 20-21 | 25 | 17 | 8 |
| 22-24 | 437 | 289 | 148 |
| 25-29 | 763 | 498 | 265 |
| 30-34 | 583 | 372 | 211 |
| 35-39 | 704 | 468 | 236 |
| 40-49 | 1,468 | 963 | 505 |
| 50-64 | 1,342 | 864 | 478 |
| Over 65 | 269 | 170 | 99 |


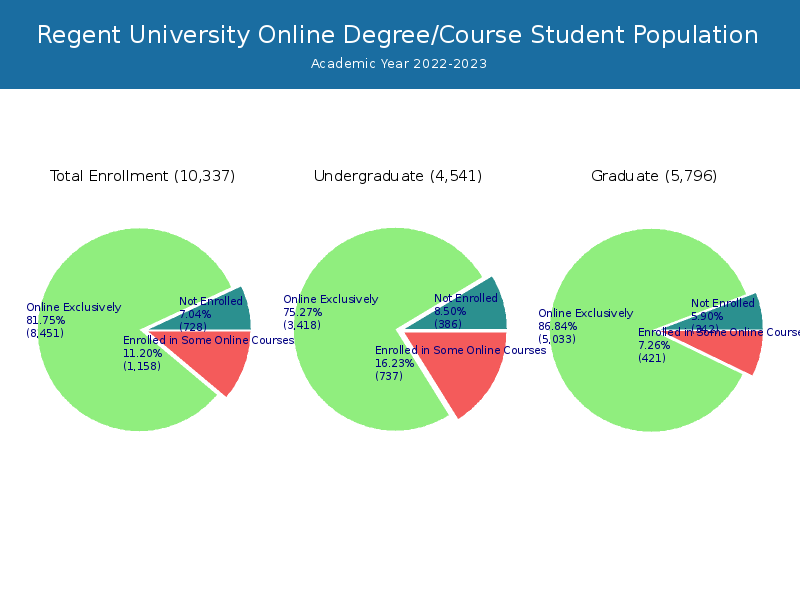
Online Student Enrollment
Distance learning, also called online education, is very attractive to students, especially who want to continue education and work in field. At Regent University, 8,213 students are enrolled exclusively in online courses and 1,223 students are enrolled in some online courses.
2,558 students lived in Virginia or jurisdiction in which the school is located are enrolled exclusively in online courses and 5,655 students live in other State or outside of the United States.
| All Students | Enrolled Exclusively Online Courses | Enrolled in Some Online Courses | |
|---|---|---|---|
| All Students | 10,168 | 8,213 | 1,223 |
| Undergraduate | 4,577 | 3,407 | 814 |
| Graduate | 5,591 | 4,806 | 409 |
| Virginia Residents | Other States in U.S. | Outside of U.S. | |
|---|---|---|---|
| All Students | 2,558 | 5,544 | 111 |
| Undergraduate | 998 | 2,395 | 14 |
| Graduate | 1,560 | 3,149 | 97 |
Transfer-in Students (Undergraduate)
Among 4,577 enrolled in undergraduate programs, 1,300 students have transferred-in from other institutions. The percentage of transfer-in students is 28.40%.634 students have transferred in as full-time status and 666 students transferred in as part-time status.
| Number of Students | |
|---|---|
| Regular Full-time | 1,847 |
| Transfer-in Full-time | 634 |
| Regular Part-time | 1,430 |
| Transfer-in Part-time | 666 |
Ratings & Review
Share your experiences and thoughts about Regent University. It will be a great help to applicants and prospective students!