How many students at CNU? For the academic year 2023-2024, total of 4,503 students have enrolled in Christopher Newport University with 4,407 undergraduate and 96 graduate students.
By gender, 2,144 male and 2,359 female students are attending the school.
It has significantly more students compared to similar colleges (3,134 students in average - public Master's College and University (smaller programs)).
You can check the student demographics by gender ratio, race/ethnicity, and age distribution.
Student Population by Gender
Christopher Newport University has a total of 4,503 enrolled students for the academic year 2023-2024. 4,407 students have enrolled in undergraduate programs and 96 students joined graduate programs.
By gender, 2,144 male and 2,359 female students (the male-female ratio is 48:52) are attending the school. The gender distribution is based on the 2023-2024 data.
| Total | Undergraduate | Graduate | |
|---|---|---|---|
| Total | 4,503 | 4,407 | 96 |
| Men | 2,144 | 2,105 | 39 |
| Women | 2,359 | 2,302 | 57 |
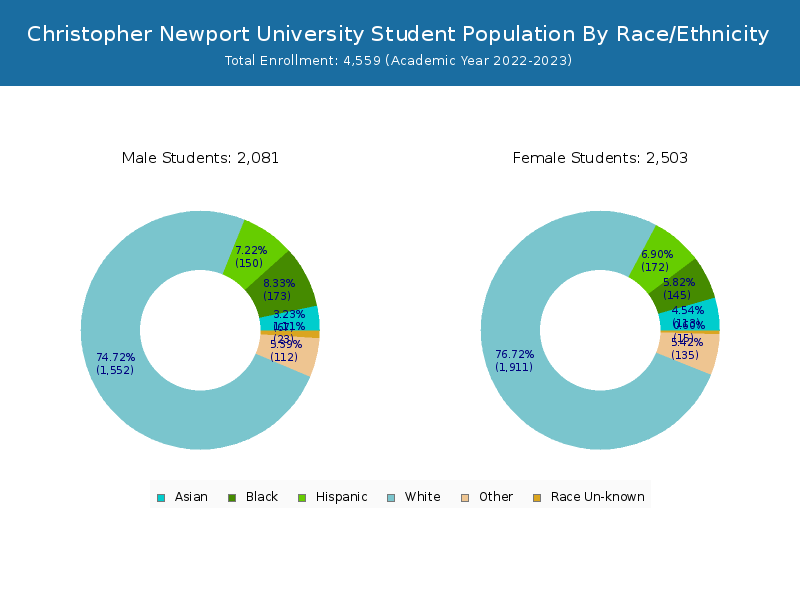
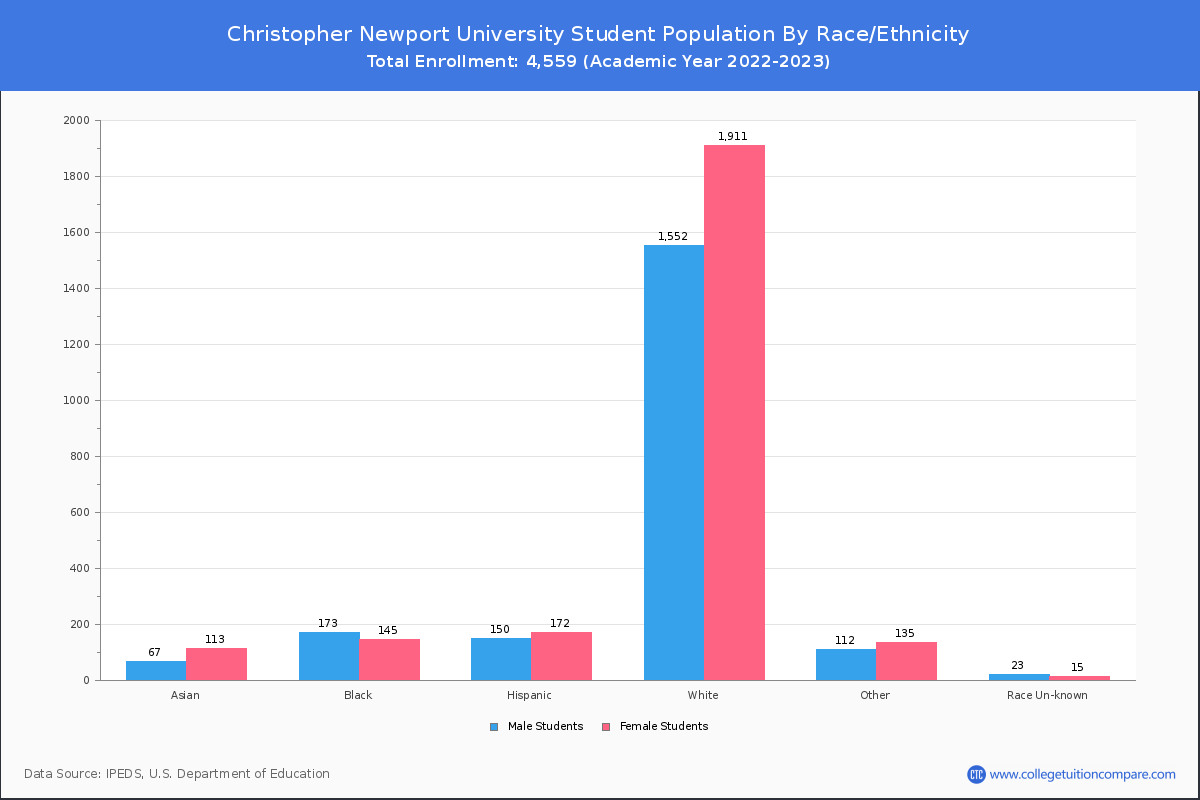
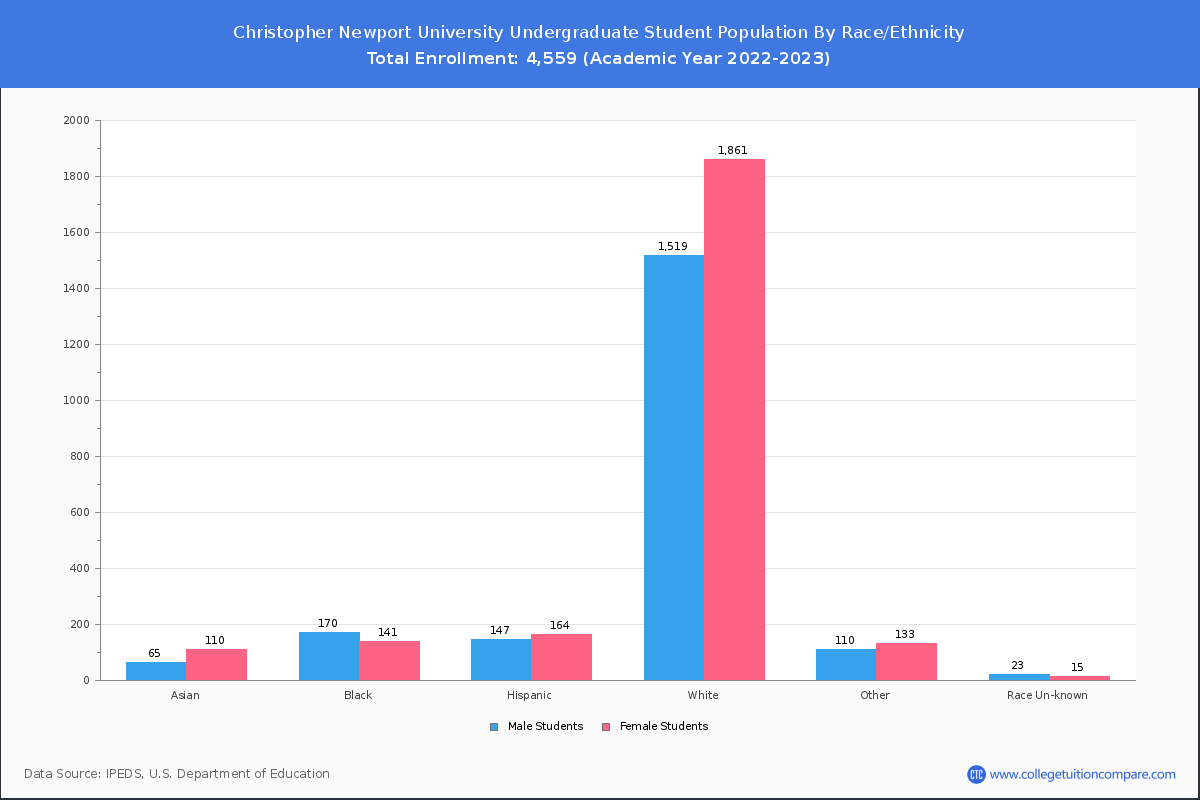
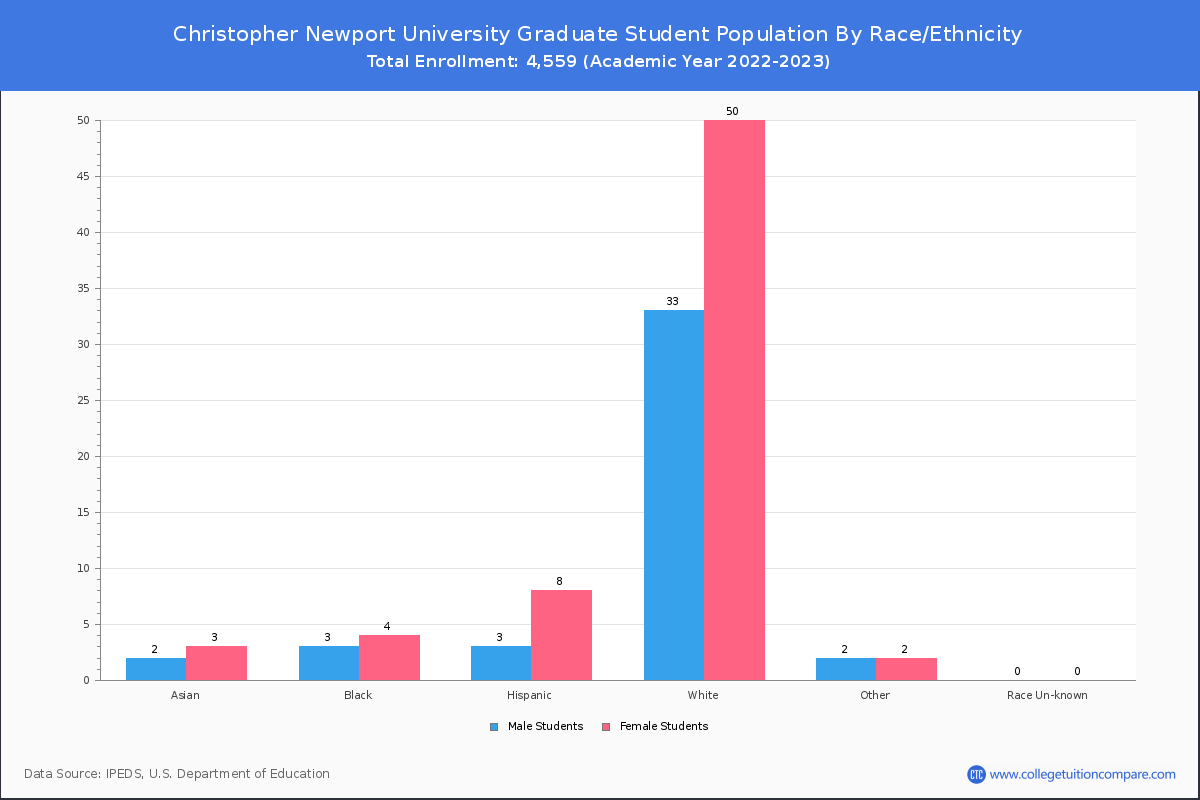
Student Distribution by Race/Ethnicity
By race/ethnicity, 3,254 White, 378 Black, and 184 Asian students out of a total of 4,503 are attending at Christopher Newport University. Comprehensive enrollment statistic data by race/ethnicity is shown in chart below (academic year 2023-2024 data).
| Race | Total | Men | Women |
|---|---|---|---|
| American Indian or Native American | 5 | 1 | 4 |
| Asian | 184 | 80 | 104 |
| Black | 378 | 206 | 172 |
| Hispanic | 369 | 164 | 205 |
| Native Hawaiian or Other Pacific Islanders | 4 | 2 | 2 |
| White | 3,254 | 1,545 | 1,709 |
| Two or more races | 244 | 112 | 132 |
| Race Unknown | 53 | 29 | 24 |
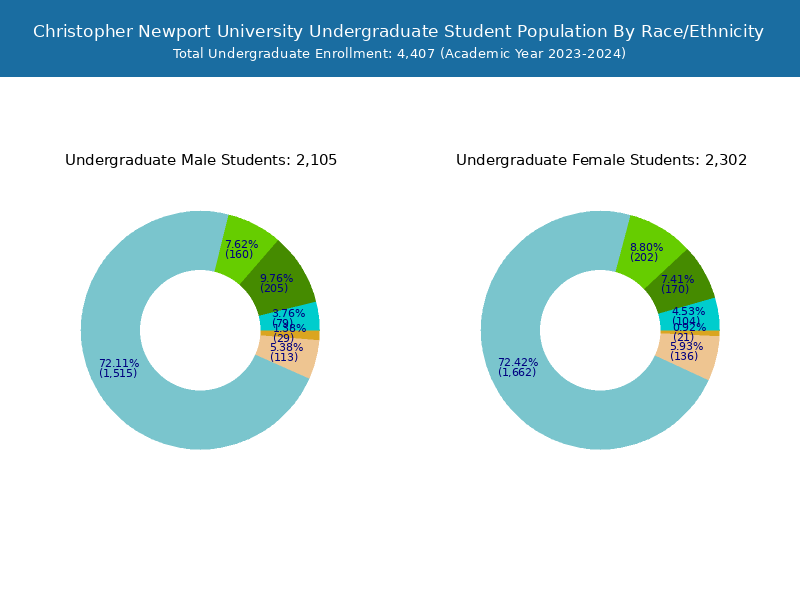
| Race | Total | Men | Women |
|---|---|---|---|
| American Indian or Native American | 5 | 1 | 4 |
| Asian | 183 | 79 | 104 |
| Black | 375 | 205 | 170 |
| Hispanic | 362 | 160 | 202 |
| Native Hawaiian or Other Pacific Islanders | 4 | 2 | 2 |
| White | 3,177 | 1,515 | 1,662 |
| Two or more races | 240 | 110 | 130 |
| Race Unknown | 50 | 29 | 21 |
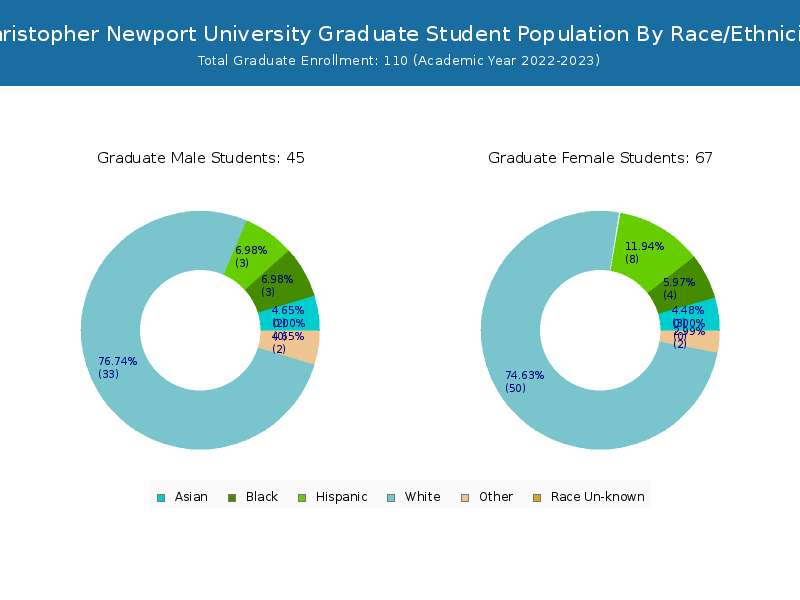
| Race | Total | Men | Women |
|---|---|---|---|
| American Indian or Native American | - | - | - |
| Asian | 1 | 1 | 0 |
| Black | 3 | 1 | 2 |
| Hispanic | 7 | 4 | 3 |
| Native Hawaiian or Other Pacific Islanders | - | - | - |
| White | 77 | 30 | 47 |
| Two or more races | 4 | 2 | 2 |
| Race Unknown | 3 | 0 | 3 |
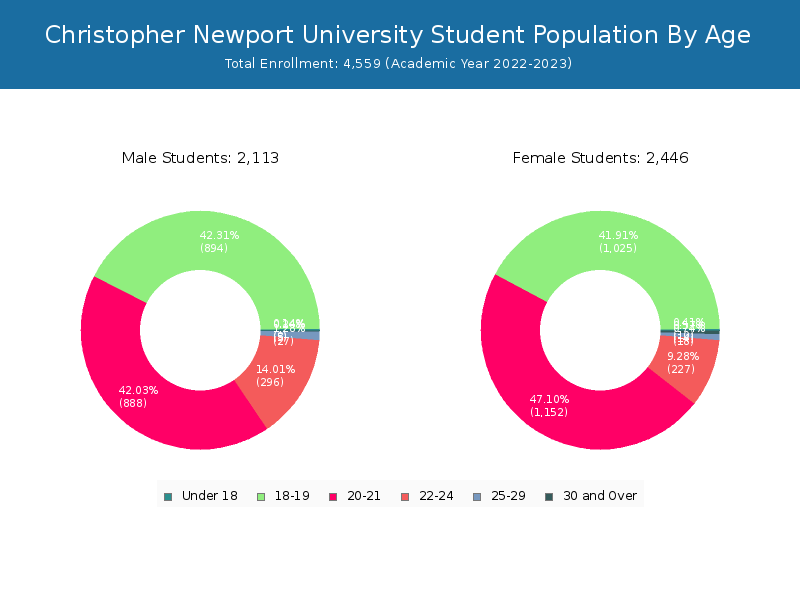
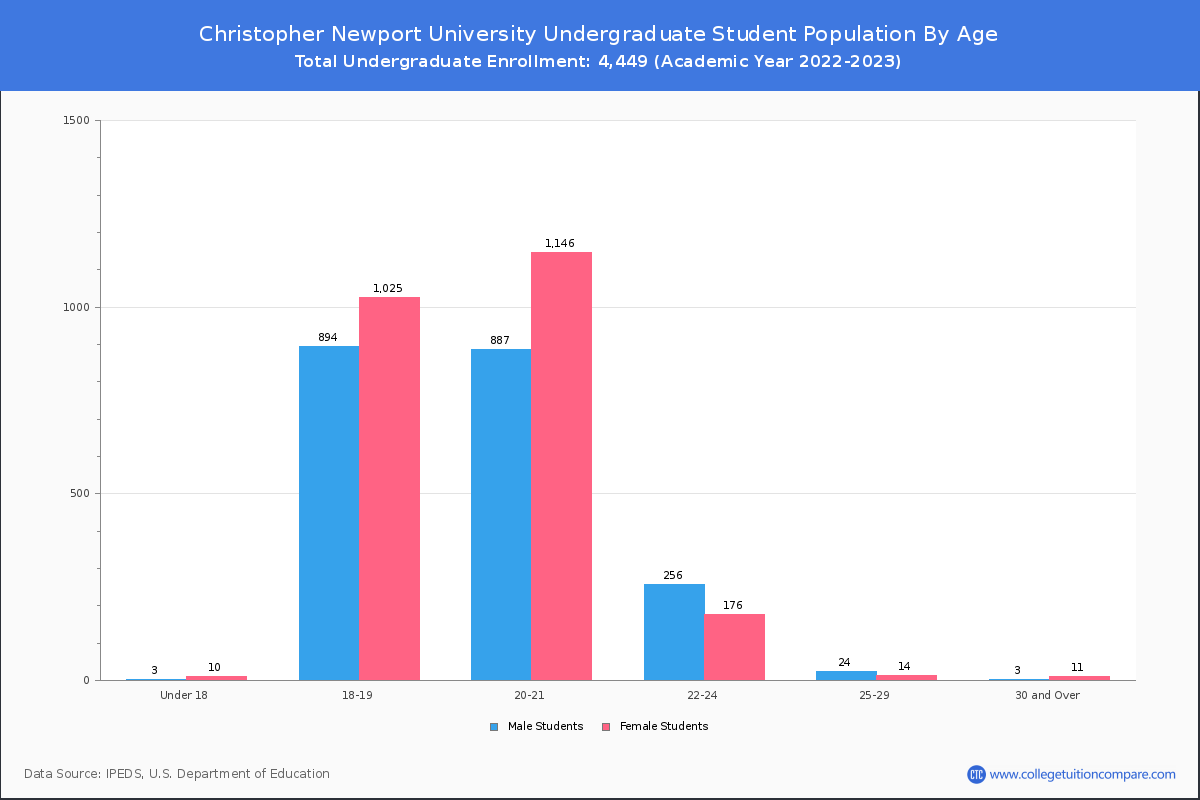
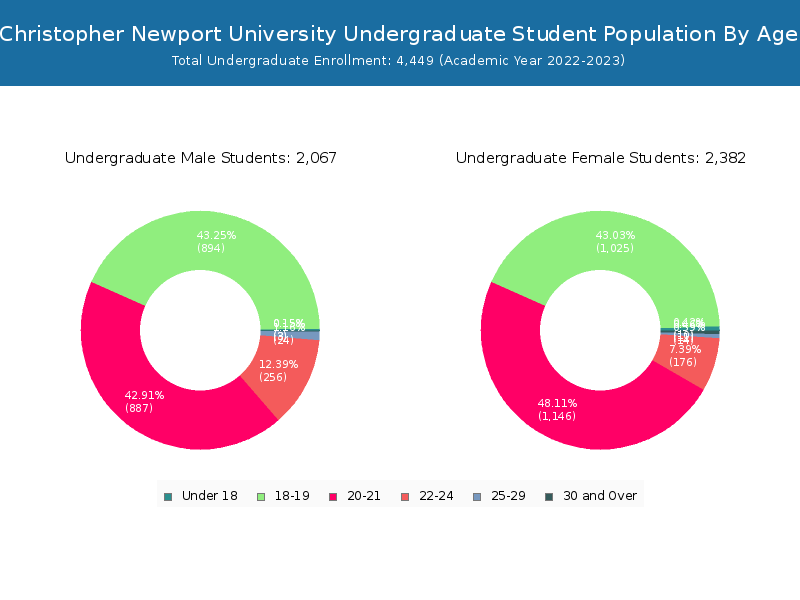
Student Age Distribution
By age, CNU has 13 students under 18 years old and 2 students over 65 years old. There are 4,442 students under 25 years old, and 61 students over 25 years old out of 4,503 total students.
In undergraduate programs, 13 students are younger than 18 and 2 students are older than 65. CNU has 4,354 undergraduate students aged under 25 and 53 students aged 25 and over.
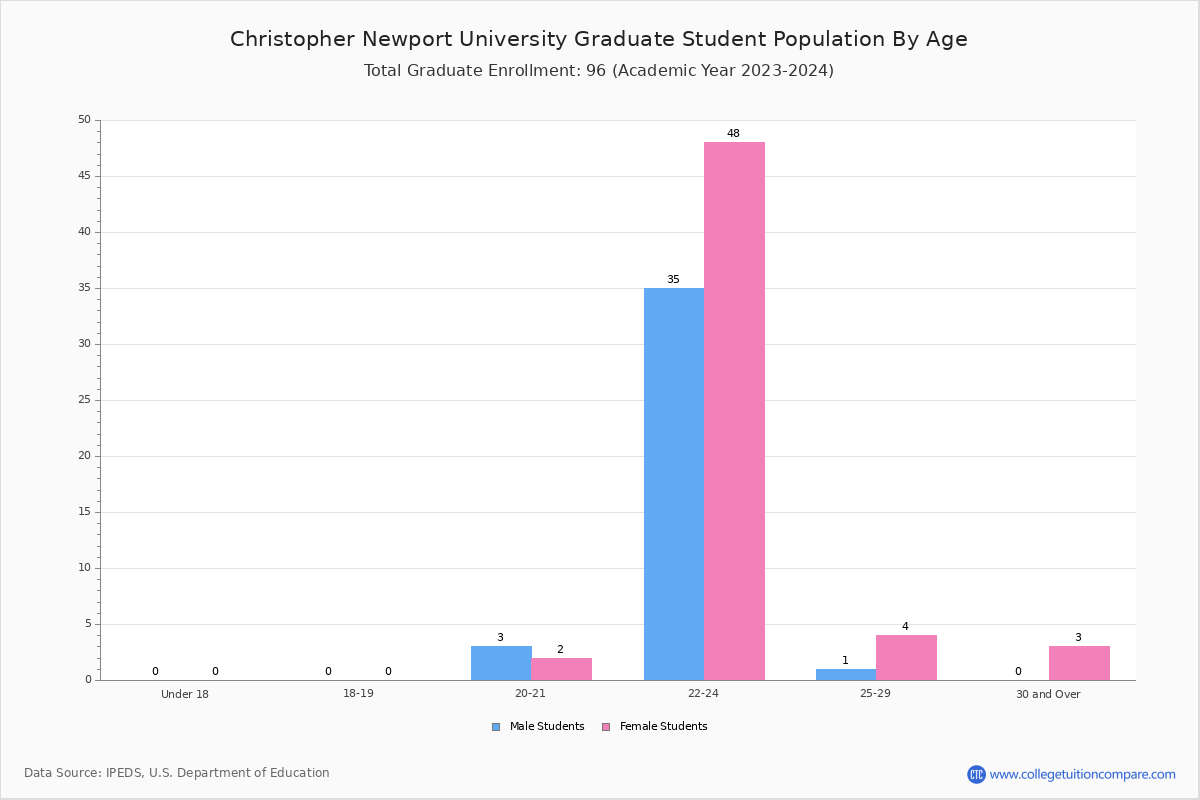
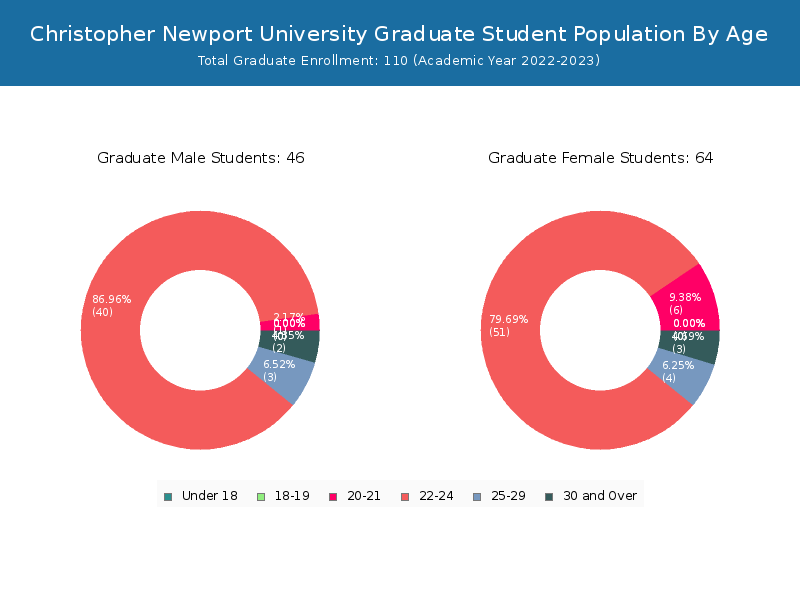
It has 88 graduate students aged under 25 and 8 students aged 25 and over.
| Age | Total | Men | Women |
|---|---|---|---|
| Under 18 | 13 | 11 | 2 |
| 18-19 | 1,979 | 1,037 | 942 |
| 20-21 | 1,911 | 1,035 | 876 |
| 22-24 | 539 | 247 | 292 |
| 25-29 | 45 | 18 | 27 |
| 30-34 | 11 | 7 | 4 |
| 35-39 | 1 | 1 | 0 |
| 40-49 | 1 | 0 | 1 |
| 50-64 | 1 | 1 | 0 |
| Over 65 | 2 | 2 | 0 |
| Age | Total | Men | Women |
|---|---|---|---|
| Under 18 | 13 | 11 | 2 |
| 18-19 | 1,979 | 1,037 | 942 |
| 20-21 | 1,906 | 1,033 | 873 |
| 22-24 | 456 | 199 | 257 |
| 25-29 | 40 | 14 | 26 |
| 30-34 | 9 | 5 | 4 |
| 40-49 | 1 | 0 | 1 |
| 50-64 | 1 | 1 | 0 |
| Over 65 | 2 | 2 | 0 |
| Age | Total | Men | Women |
|---|---|---|---|
| 20-21 | 5 | 2 | 3 |
| 22-24 | 83 | 48 | 35 |
| 25-29 | 5 | 4 | 1 |
| 30-34 | 2 | 2 | 0 |
| 35-39 | 1 | 1 | 0 |

Transfer-in Students (Undergraduate)
Among 4,407 enrolled in undergraduate programs, 151 students have transferred-in from other institutions. The percentage of transfer-in students is 3.43%.141 students have transferred in as full-time status and 10 students transferred in as part-time status.
| Number of Students | |
|---|---|
| Regular Full-time | 4,180 |
| Transfer-in Full-time | 141 |
| Regular Part-time | 76 |
| Transfer-in Part-time | 10 |
Ratings & Review
Share your experiences and thoughts about Christopher Newport University. It will be a great help to applicants and prospective students!