How many students at PU? For the academic year 2023-2024, total of 52,905 students have enrolled in Purdue University-Main Campus with 39,864 undergraduate and 13,041 graduate students.
By gender, 30,659 male and 22,246 female students are attending the school.
It has significantly more students compared to similar colleges (34,080 students in average - public Research University (very high research activity)).
4,469 students are enrolled exclusively, and 14,526 students are enrolled in some online courses.
You can check the student demographics by gender ratio, race/ethnicity, age distribution, and online enrollment.
Student Population by Gender
Purdue University-Main Campus has a total of 52,905 enrolled students for the academic year 2023-2024. 39,864 students have enrolled in undergraduate programs and 13,041 students joined graduate programs.
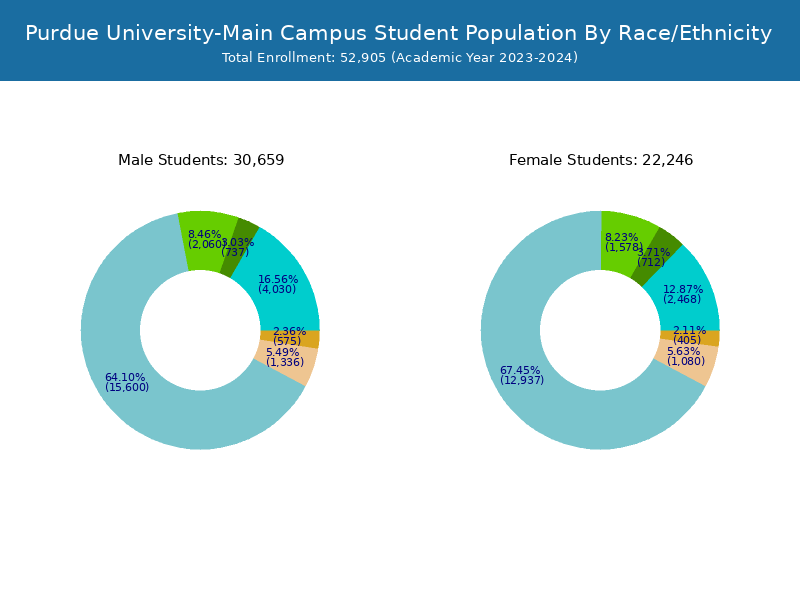
By gender, 30,659 male and 22,246 female students (the male-female ratio is 58:42) are attending the school. The gender distribution is based on the 2023-2024 data.
| Total | Undergraduate | Graduate | |
|---|---|---|---|
| Total | 52,905 | 39,864 | 13,041 |
| Men | 30,659 | 22,943 | 7,716 |
| Women | 22,246 | 16,921 | 5,325 |
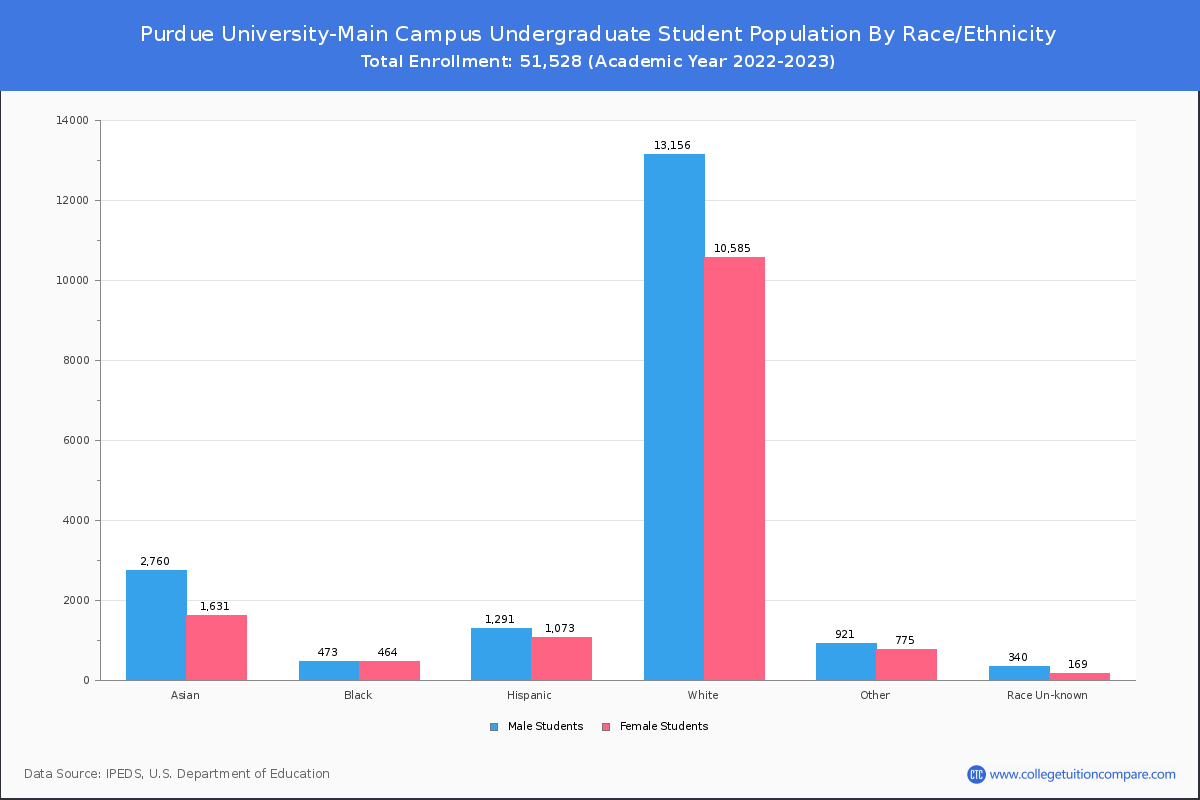
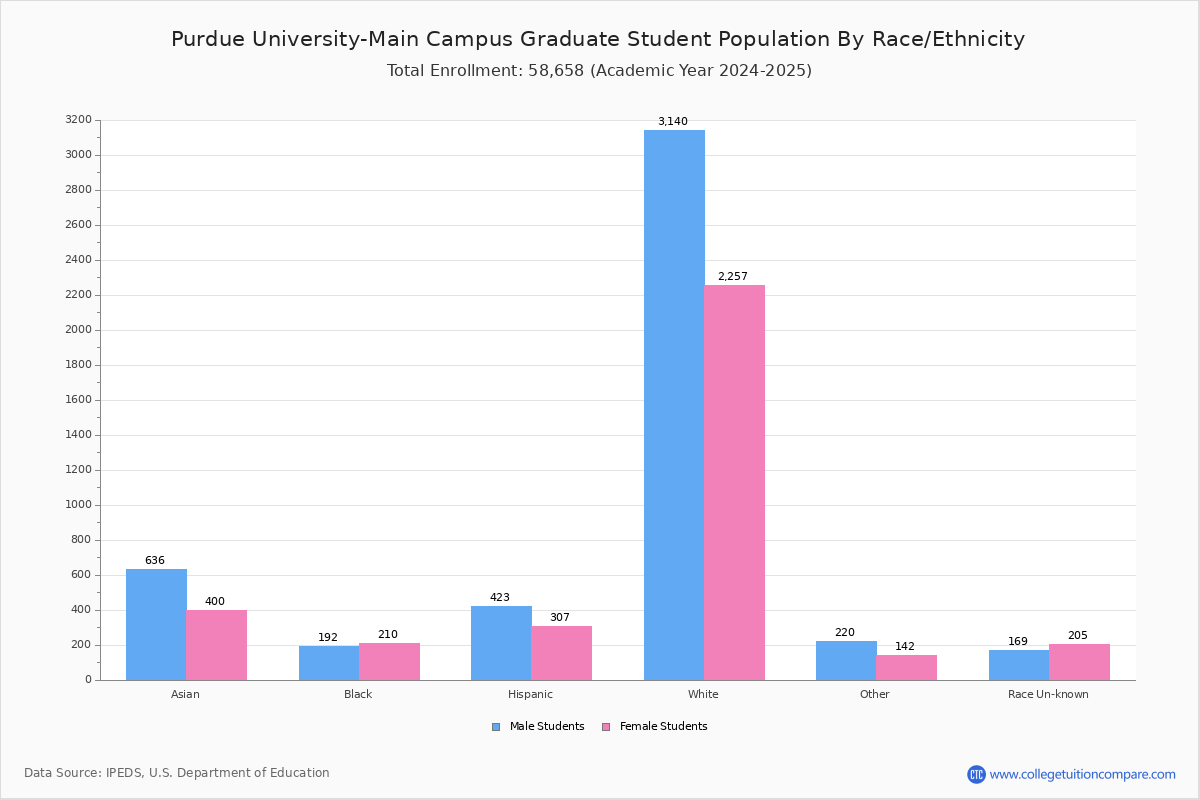
Student Distribution by Race/Ethnicity
By race/ethnicity, 28,537 White, 1,449 Black, and 6,498 Asian students out of a total of 52,905 are attending at Purdue University-Main Campus. Comprehensive enrollment statistic data by race/ethnicity is shown in chart below (academic year 2023-2024 data).
| Race | Total | Men | Women |
|---|---|---|---|
| American Indian or Native American | 58 | 31 | 27 |
| Asian | 6,498 | 4,030 | 2,468 |
| Black | 1,449 | 737 | 712 |
| Hispanic | 3,638 | 2,060 | 1,578 |
| Native Hawaiian or Other Pacific Islanders | 22 | 17 | 5 |
| White | 28,537 | 15,600 | 12,937 |
| Two or more races | 2,336 | 1,288 | 1,048 |
| Race Unknown | 980 | 575 | 405 |
| Race | Total | Men | Women |
|---|---|---|---|
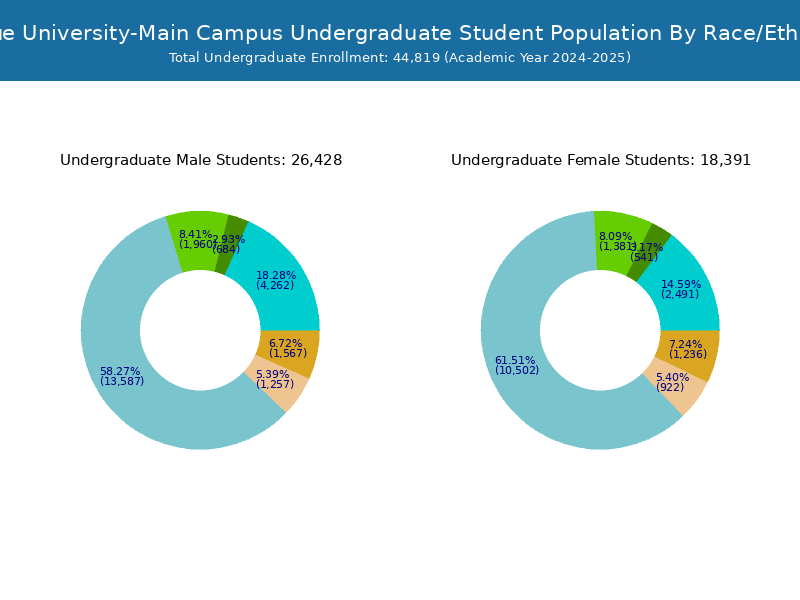
| American Indian or Native American | 35 | 20 | 15 |
| Asian | 5,553 | 3,482 | 2,071 |
| Black | 1,049 | 547 | 502 |
| Hispanic | 2,922 | 1,652 | 1,270 |
| Native Hawaiian or Other Pacific Islanders | 16 | 11 | 5 |
| White | 23,544 | 12,836 | 10,708 |
| Two or more races | 2,059 | 1,132 | 927 |
| Race Unknown | 662 | 436 | 226 |
| Race | Total | Men | Women |
|---|---|---|---|
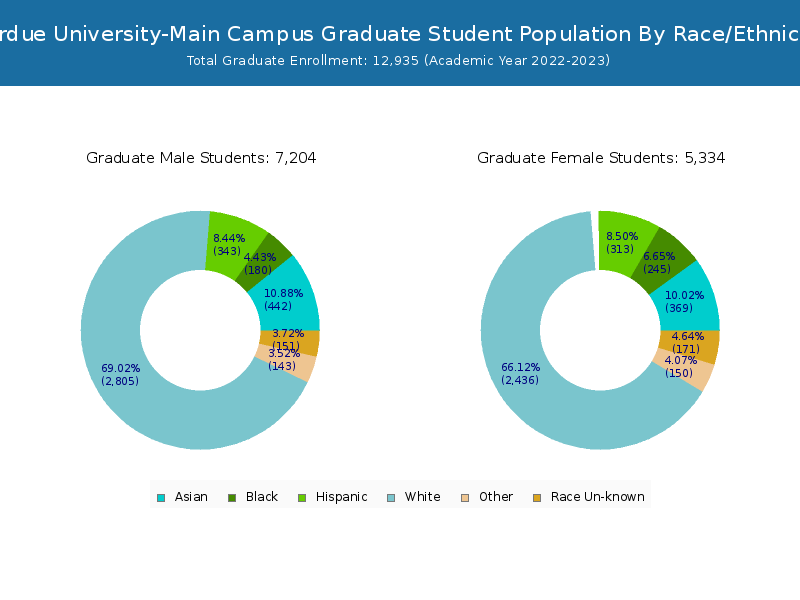
| American Indian or Native American | 23 | 11 | 12 |
| Asian | 945 | 548 | 397 |
| Black | 400 | 190 | 210 |
| Hispanic | 716 | 408 | 308 |
| Native Hawaiian or Other Pacific Islanders | 6 | 6 | 0 |
| White | 4,993 | 2,764 | 2,229 |
| Two or more races | 277 | 156 | 121 |
| Race Unknown | 318 | 139 | 179 |

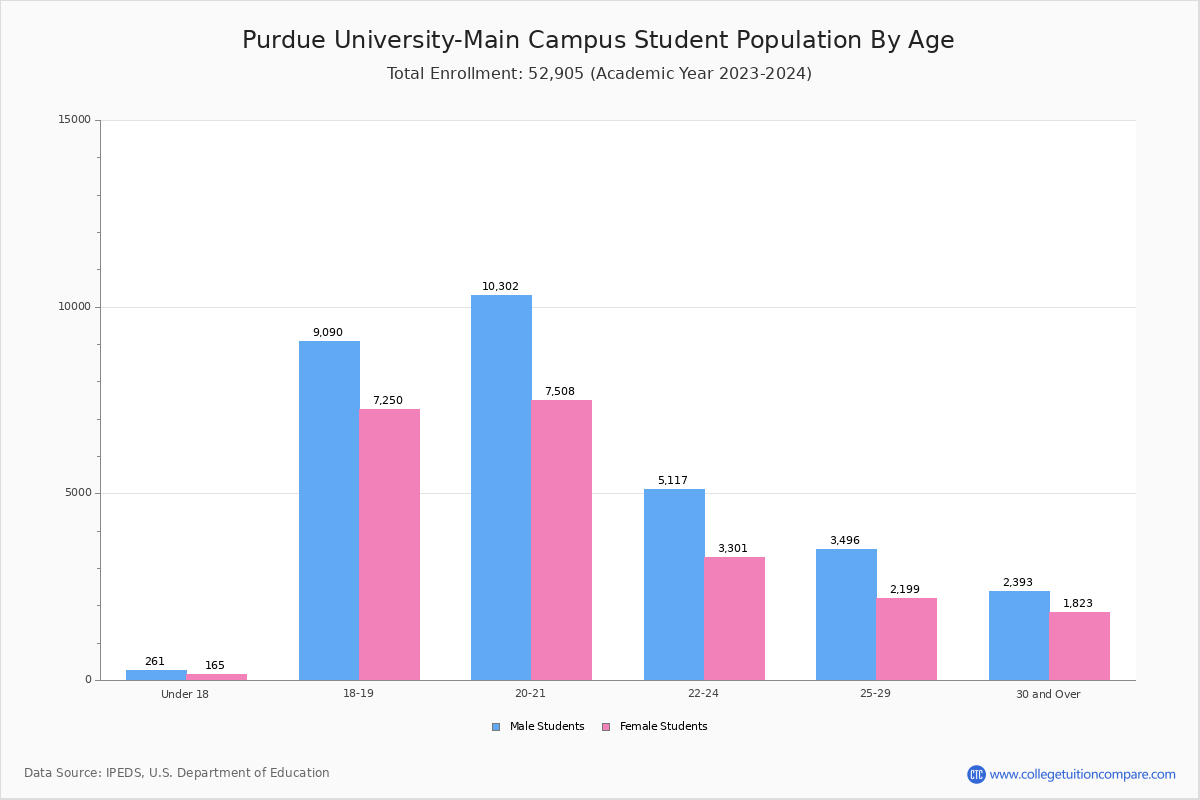
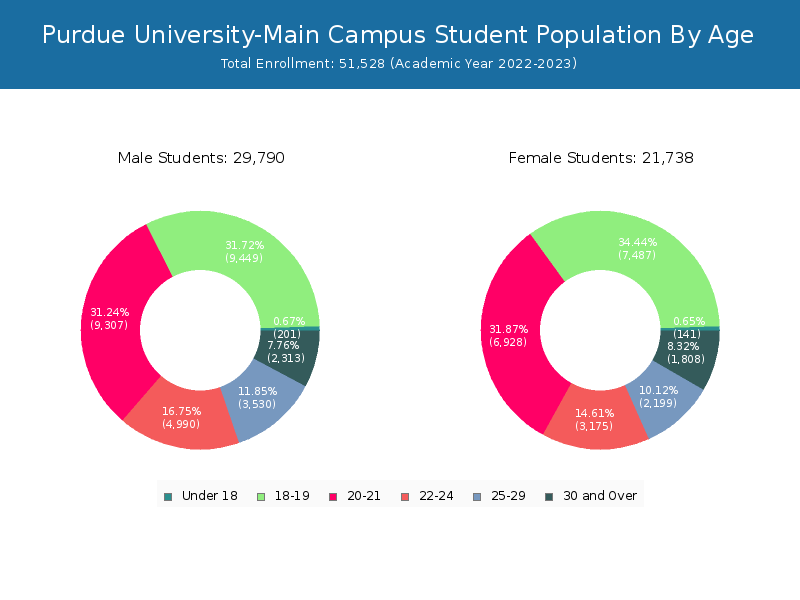
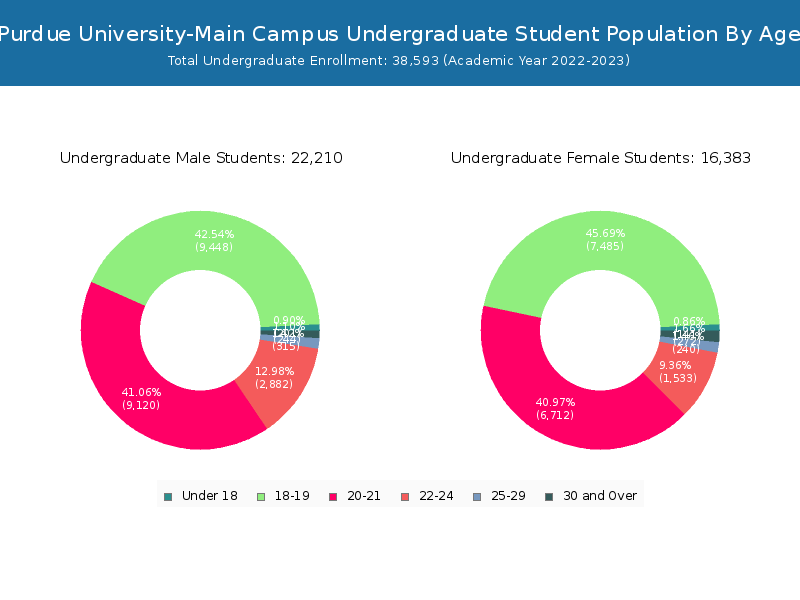
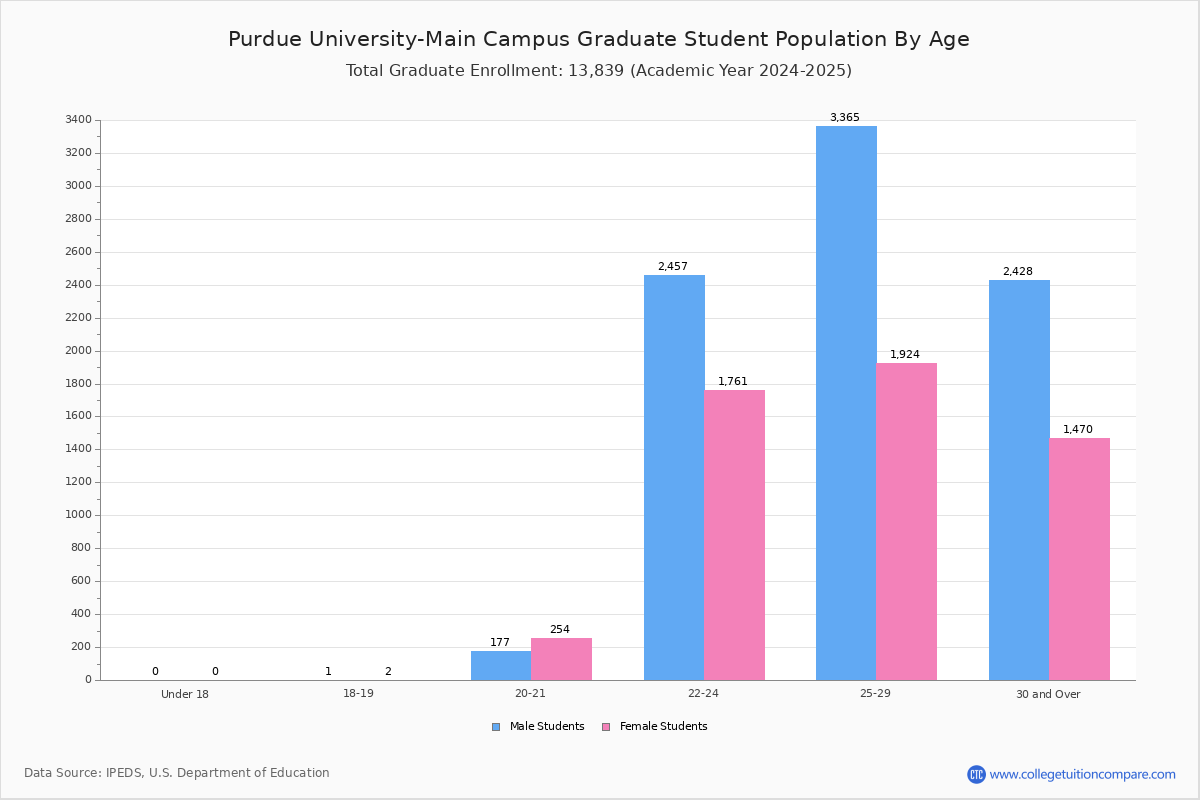
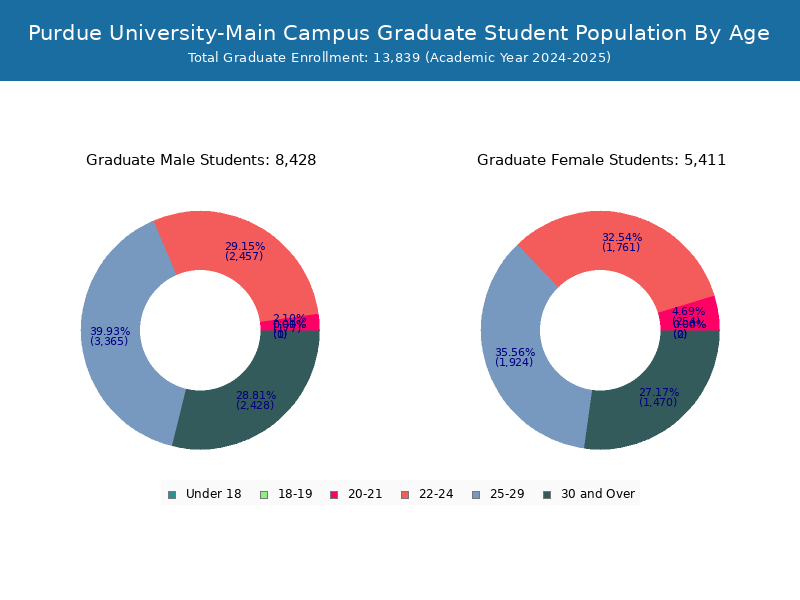
Student Age Distribution
By age, PU has 426 students under 18 years old and 32 students over 65 years old. There are 42,994 students under 25 years old, and 9,911 students over 25 years old out of 52,905 total students.
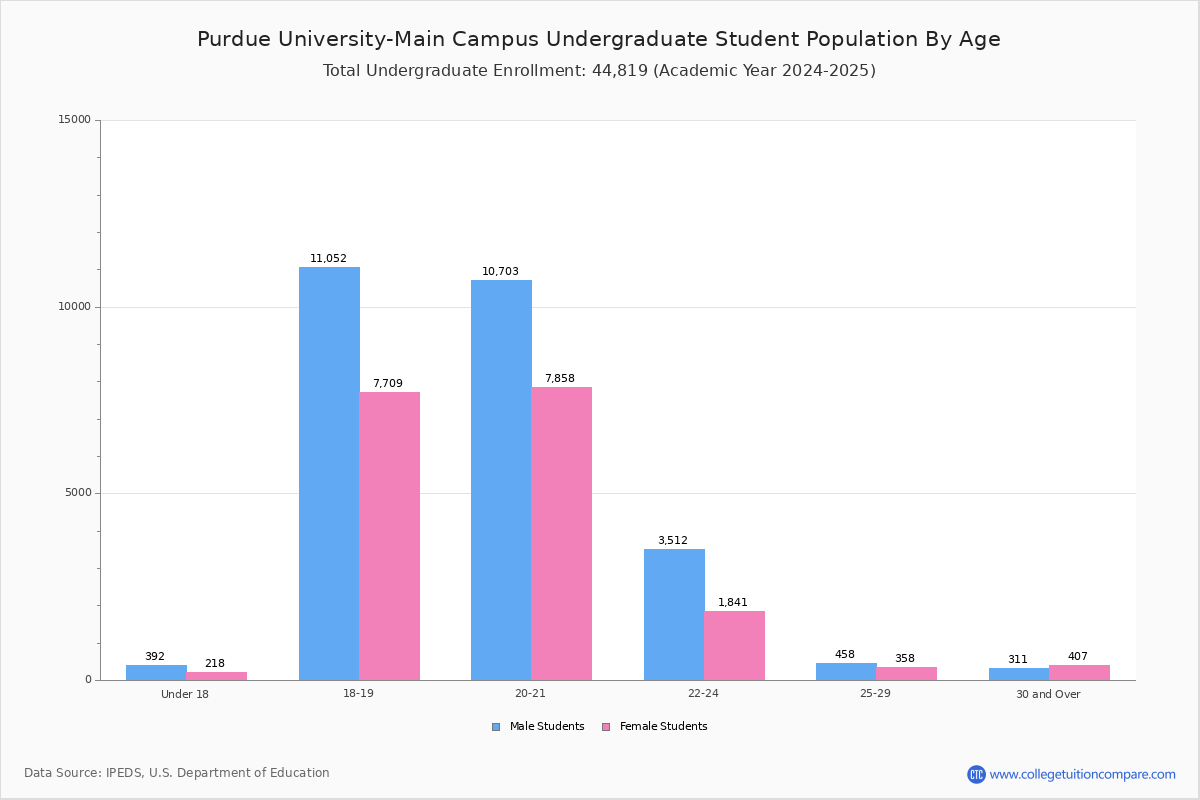
In undergraduate programs, 426 students are younger than 18 and 14 students are older than 65. PU has 38,773 undergraduate students aged under 25 and 1,091 students aged 25 and over.
It has 4,221 graduate students aged under 25 and 8,820 students aged 25 and over.
| Age | Total | Men | Women |
|---|---|---|---|
| Under 18 | 426 | 165 | 261 |
| 18-19 | 16,340 | 7,250 | 9,090 |
| 20-21 | 17,810 | 7,508 | 10,302 |
| 22-24 | 8,418 | 3,301 | 5,117 |
| 25-29 | 5,695 | 2,199 | 3,496 |
| 30-34 | 2,079 | 852 | 1,227 |
| 35-39 | 894 | 372 | 522 |
| 40-49 | 845 | 408 | 437 |
| 50-64 | 366 | 178 | 188 |
| Over 65 | 32 | 13 | 19 |
| Age | Total | Men | Women |
|---|---|---|---|
| Under 18 | 426 | 165 | 261 |
| 18-19 | 16,335 | 7,246 | 9,089 |
| 20-21 | 17,431 | 7,294 | 10,137 |
| 22-24 | 4,581 | 1,652 | 2,929 |
| 25-29 | 563 | 266 | 297 |
| 30-34 | 210 | 116 | 94 |
| 35-39 | 118 | 70 | 48 |
| 40-49 | 132 | 74 | 58 |
| 50-64 | 54 | 31 | 23 |
| Over 65 | 14 | 7 | 7 |
| Age | Total | Men | Women |
|---|---|---|---|
| 18-19 | 5 | 4 | 1 |
| 20-21 | 379 | 214 | 165 |
| 22-24 | 3,837 | 1,649 | 2,188 |
| 25-29 | 5,132 | 1,933 | 3,199 |
| 30-34 | 1,869 | 736 | 1,133 |
| 35-39 | 776 | 302 | 474 |
| 40-49 | 713 | 334 | 379 |
| 50-64 | 312 | 147 | 165 |
| Over 65 | 18 | 6 | 12 |
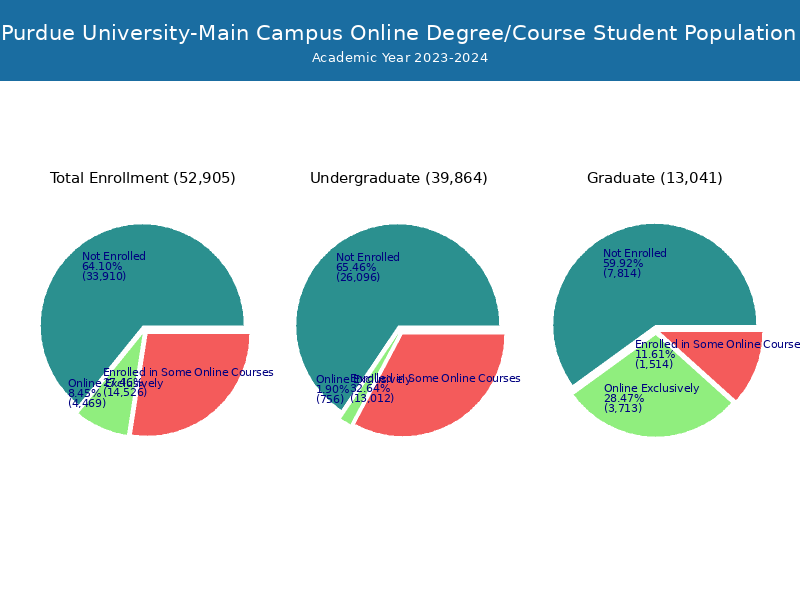
Online Student Enrollment
Distance learning, also called online education, is very attractive to students, especially who want to continue education and work in field. At Purdue University-Main Campus, 4,469 students are enrolled exclusively in online courses and 14,526 students are enrolled in some online courses.
1,079 students lived in Indiana or jurisdiction in which the school is located are enrolled exclusively in online courses and 3,390 students live in other State or outside of the United States.
| All Students | Enrolled Exclusively Online Courses | Enrolled in Some Online Courses | |
|---|---|---|---|
| All Students | 52,905 | 4,469 | 14,526 |
| Undergraduate | 39,864 | 756 | 13,012 |
| Graduate | 13,041 | 3,713 | 1,514 |
| Indiana Residents | Other States in U.S. | Outside of U.S. | |
|---|---|---|---|
| All Students | 1,079 | 2,997 | 393 |
| Undergraduate | 321 | 415 | 20 |
| Graduate | 758 | 2,582 | 373 |
Transfer-in Students (Undergraduate)
Among 39,864 enrolled in undergraduate programs, 1,084 students have transferred-in from other institutions. The percentage of transfer-in students is 2.72%.907 students have transferred in as full-time status and 177 students transferred in as part-time status.
| Number of Students | |
|---|---|
| Regular Full-time | 36,771 |
| Transfer-in Full-time | 907 |
| Regular Part-time | 2,009 |
| Transfer-in Part-time | 177 |
Ratings & Review
Share your experiences and thoughts about Purdue University-Main Campus. It will be a great help to applicants and prospective students!