Neumont College of Computer Science's Graduation Rate
At Neumont College of Computer Science, the graduation rate is 57 % within 150% normal time, the retention rate is 77 %, as of August 31, 2024.
Its graduation rate is relatively lower than the average rate when comparing similar colleges' rate of 71.60% (private (for-profit) technology-related school).
Graduation Rates in Reasonable Completion Time
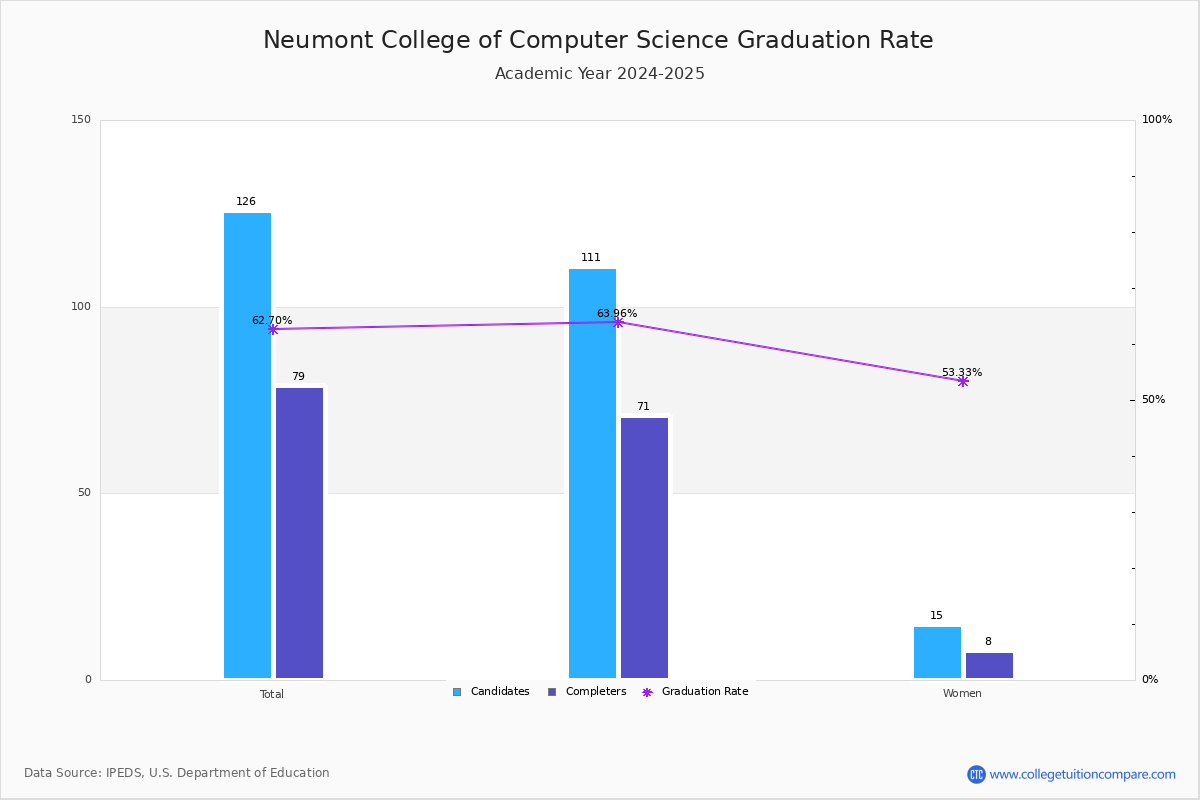
For the academic year 2023-2024, 95 students out of 168 candidates have completed their courses within 150% normal time (i.e. in 6 years for 4-year BS degree) at Neumont College of Computer Science.
By gender, 82 male and 13 female students graduated the school last year completing their jobs in the period.
| Candidates | Completers | Graduation Rates | |
|---|---|---|---|
| Total | 168 | 95 | 56.55% |
| Men | 149 | 82 | 55.03% |
| Women | 19 | 13 | 68.42% |
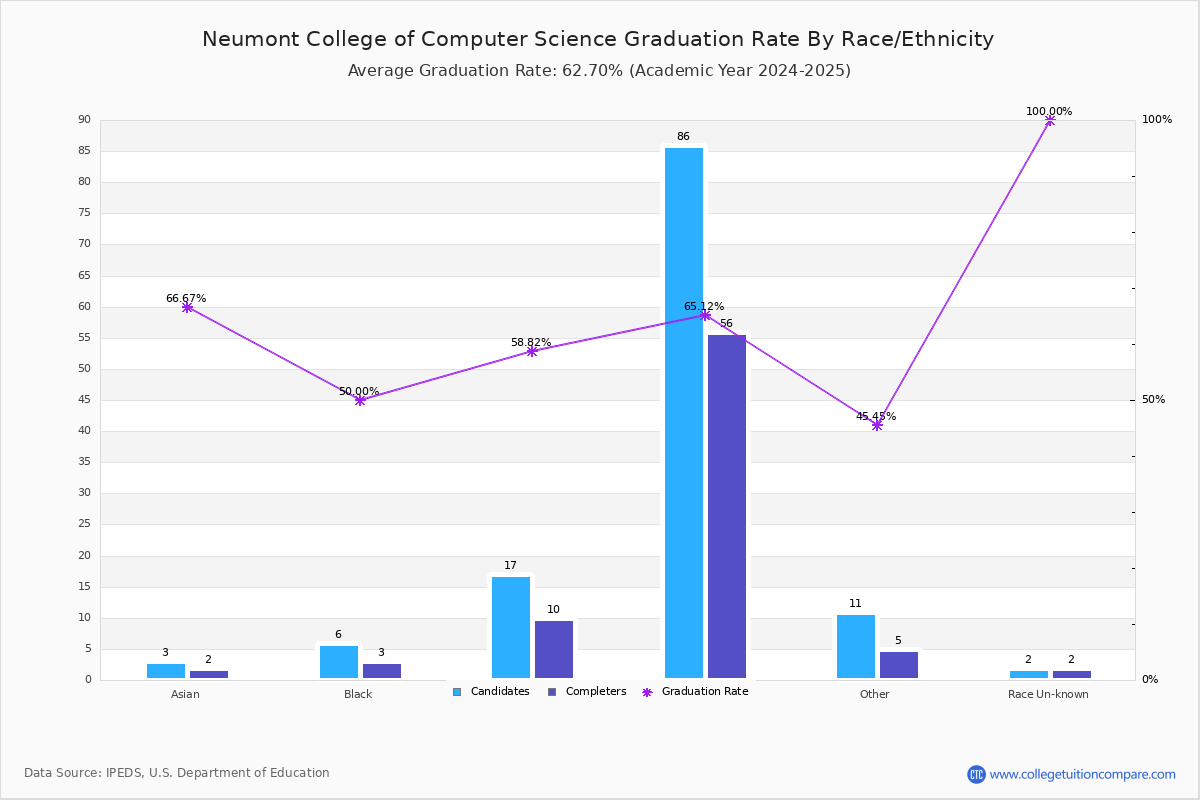
Graduation Rate By Race/Ethnicity
The following table shows graduation rate by race and at Neumont College of Computer Science.
- American Indian or Alaska Native: 75.00%
- Asian: 66.67%
- Black (Non-Hispanic): 50.00%
- Hispanic: 65.38%
- White: 55.26%
- Native Hawaiian or Other Pacific Islander: 0.00%
- Two or More Race: 50.00%
- Unknown: 50.00%
| Total | Male | Female | |
|---|---|---|---|
| American Indian or Alaska Native | 75.00%(3/4) | 100.00%(2/2) | 50.00%(1/2) |
| Asian | 66.67%(2/3) | 66.67%(2/3) | - |
| Black (Non-Hispanic) | 50.00%(3/6) | 50.00%(3/6) | - |
| Hispanic | 65.38%(17/26) | 65.22%(15/23) | 66.67%(2/3) |
| White | 55.26%(63/114) | 53.00%(53/100) | 71.43%(10/14) |
| Native Hawaiian or Other Pacific Islander | 0.00%(-/1) | - | - |
| Two or More Race | 50.00%(4/8) | 50.00%(4/8) | - |
| Unknown | 50.00%(3/6) | 50.00%(3/6) | - |
Ratings & Review
Share your experiences and thoughts about Neumont College of Computer Science. It will be a great help to applicants and prospective students!