At Boston University, the average acceptance rate over the past 11 years is 24.78%, and 2024's acceptance rate is 10.85%. BU's acceptance rate has been lower every year for the past 3 years. For 2024 admission, it was slightly harder to get into Boston University than the previous year. BU has beep kept its acceptance rate very low and it is hard that applicants admit into the school.
The average yield (enrollment rate) over the period is 25.06%, and the 2024 yield is 36.01%.
The number of BU applicants decreased by -0.37% (301 applicants) compared to the previous year.
Acceptance Rate Changes
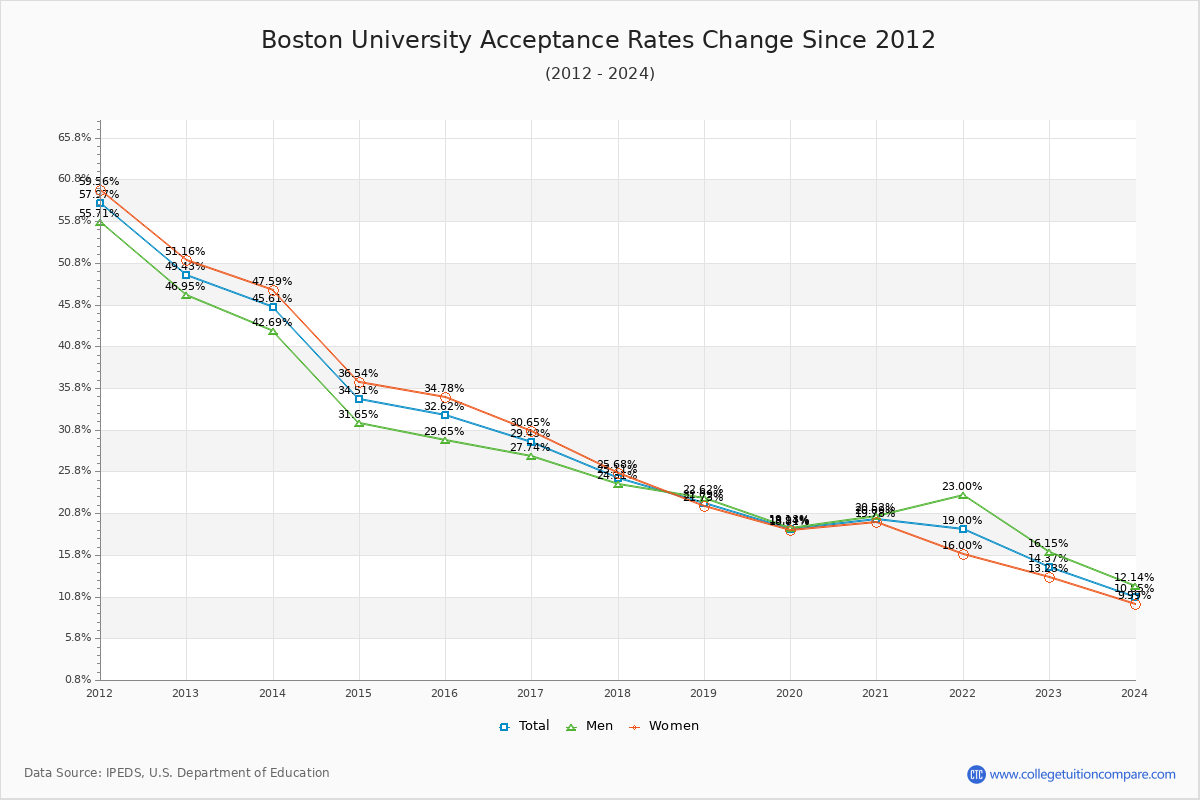
The average acceptance rate over the last 10 years is 24.78%, and this year's acceptance rate is 10.85% at Boston University. By gender, men students' acceptance rate is 24.51% and women students' rate is 24.98%. For 2024 admission, it was slightly harder to get into Boston University than the previous year. BU has beep kept its acceptance rate very low and it is hard that applicants admit into the school.
The following table and chart illustrate the acceptance rates changes at Boston University over the past 11 years (2013-2024).
| Year | Total | Men | Women |
|---|---|---|---|
| 2013-14 | 45.61% | 42.69% | 47.59% |
| 2014-15 | 34.51% -11.10% |
31.65% -11.04% |
36.54% -11.06% |
| 2015-16 | 32.62% -1.89% |
29.65% -2.01% |
34.78% -1.76% |
| 2016-17 | 29.43% -3.19% |
27.74% -1.91% |
30.65% -4.13% |
| 2017-18 | 25.11% -4.32% |
24.31% -3.43% |
25.68% -4.97% |
| 2018-19 | 22.09% -3.01% |
22.62% -1.69% |
21.73% -3.95% |
| 2019-20 | 18.94% -3.15% |
19.13% -3.49% |
18.81% -2.92% |
| 2020-21 | 20.09% 1.15% |
20.52% 1.40% |
19.78% 0.97% |
| 2021-22 | 19.00% -1.09% |
23.00% 2.47% |
16.00% -3.78% |
| 2022-23 | 14.37% -4.63% |
16.15% -6.84% |
13.23% -2.77% |
| 2023-24 | 10.85% -3.52% |
12.14% -4.02% |
9.99% -3.24% |
| Average | 24.78% | 24.51% | 24.98% |
Admission Yield (Enrollment Rate) Changes
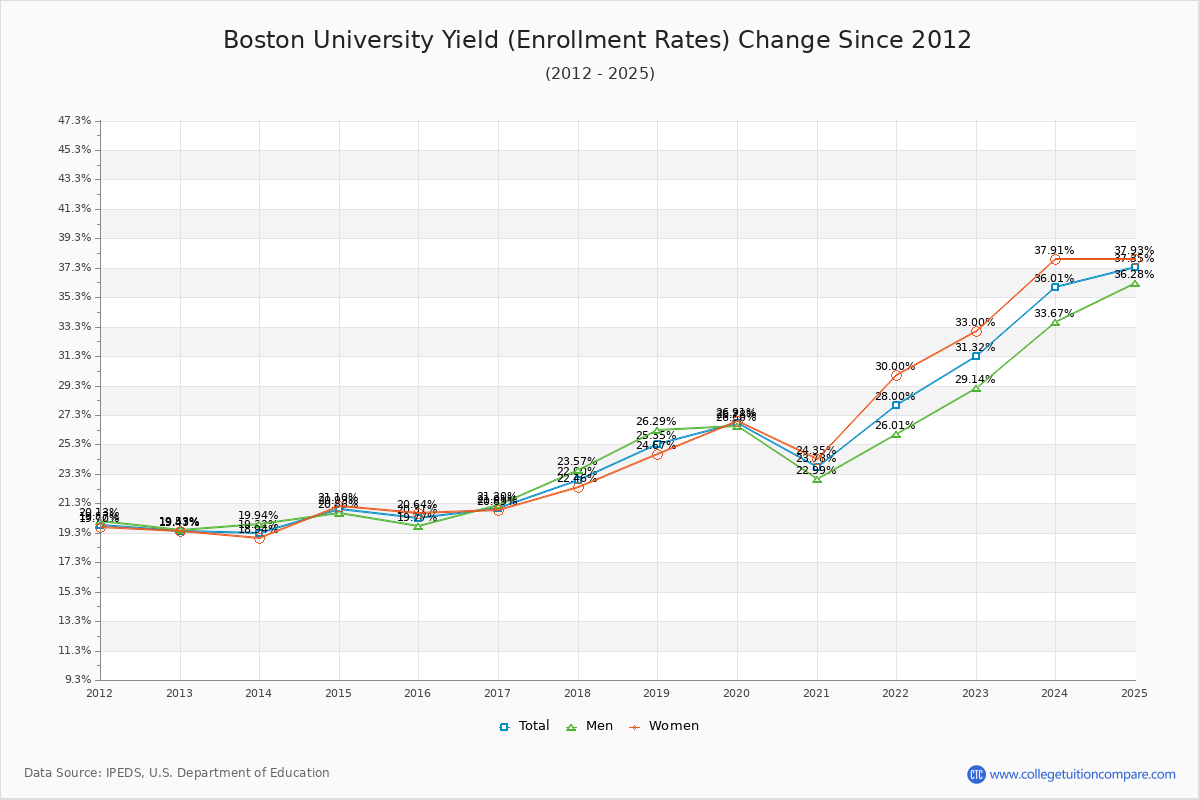
The average admission yield of the last 11 years is 25.06% where the current academic year yield is 36.01%.
The following table and chart illustrate the changes in yield at Boston University from 2013 to 2024.
| Year | Total | Men | Women |
|---|---|---|---|
| 2013-14 | 19.32% | 19.94% | 18.94% |
| 2014-15 | 20.93% 1.62% |
20.66% 0.72% |
21.10% 2.17% |
| 2015-16 | 20.31% -0.63% |
19.77% -0.90% |
20.64% -0.46% |
| 2016-17 | 21.01% 0.70% |
21.20% 1.43% |
20.89% 0.25% |
| 2017-18 | 22.90% 1.89% |
23.57% 2.38% |
22.46% 1.57% |
| 2018-19 | 25.35% 2.45% |
26.29% 2.72% |
24.67% 2.22% |
| 2019-20 | 26.78% 1.42% |
26.60% 0.31% |
26.91% 2.23% |
| 2020-21 | 23.78% -3.00% |
22.99% -3.61% |
24.35% -2.56% |
| 2021-22 | 28.00% 4.22% |
26.01% 3.02% |
30.00% 5.66% |
| 2022-23 | 31.32% 3.32% |
29.14% 3.14% |
33.00% 2.99% |
| 2023-24 | 36.01% 4.70% |
33.67% 4.52% |
37.91% 4.91% |
| Average | 25.06% | 24.53% | 25.53% |
Applicants, Admitted, and Enrolled Headcount Changes
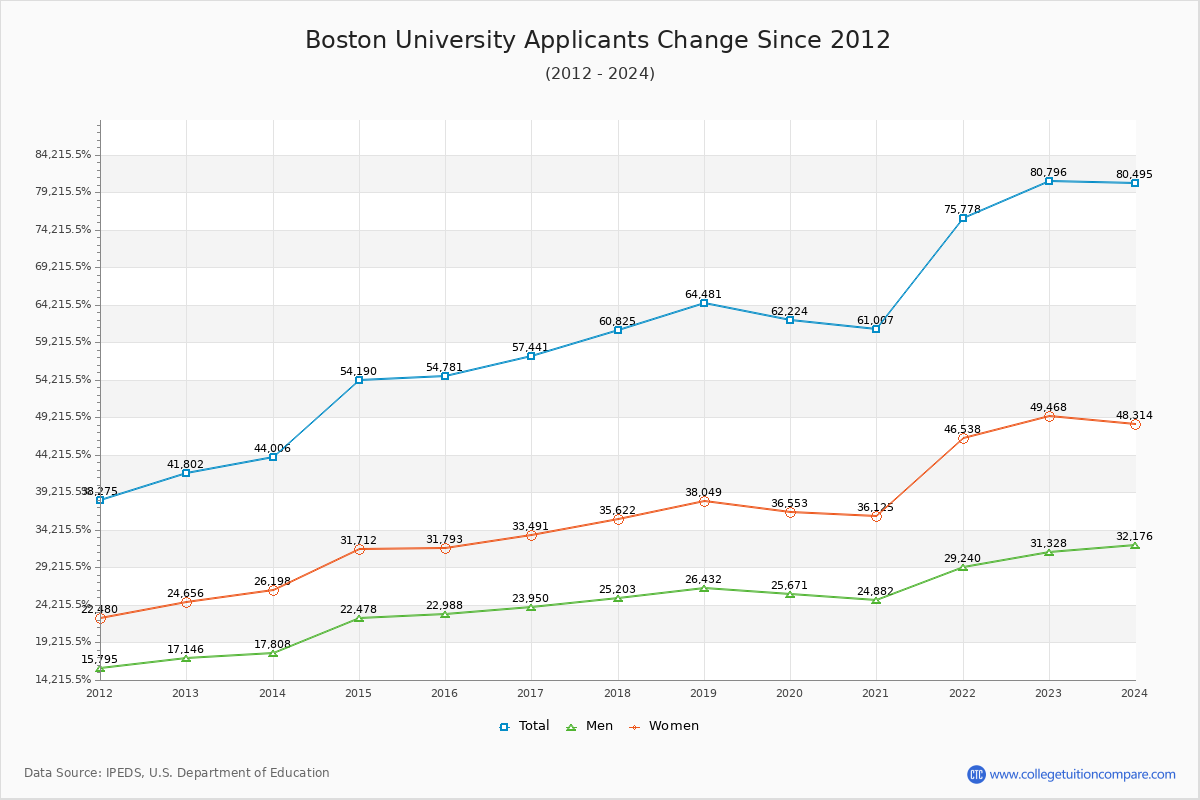
Over the past 10 years, The average number of applicants is 63,275, the average number of admitted is 14,713, and the average number of first-year enrolled students is 3,542.
The number of BU applicants decreased by -0.37% (301 applicants) compared to the previous year.
The following table and chart show the changes of applicants, admitted, and enrolled headcount at Boston University from 2013 to 2024.
| Year | Applicants | Admitted | Enrolled |
|---|---|---|---|
| 2013-14 | 44,006 | 20,071 | 3,877 |
| 2014-15 | 54,190 23.14% |
18,701 -6.83% |
3,915 0.98% |
| 2015-16 | 54,781 1.09% |
17,871 -4.44% |
3,629 -7.31% |
| 2016-17 | 57,441 4.86% |
16,907 -5.39% |
3,552 -2.12% |
| 2017-18 | 60,825 5.89% |
15,273 -9.66% |
3,498 -1.52% |
| 2018-19 | 64,481 6.01% |
14,247 -6.72% |
3,612 3.26% |
| 2019-20 | 62,224 -3.50% |
11,786 -17.27% |
3,156 -12.62% |
| 2020-21 | 61,007 -1.96% |
12,254 3.97% |
2,914 -7.67% |
| 2021-22 | 75,778 24.21% |
14,398 17.50% |
4,031 38.33% |
| 2022-23 | 80,796 6.62% |
11,607 -19.38% |
3,635 -9.82% |
| 2023-24 | 80,495 -0.37% |
8,733 -24.76% |
3,145 -13.48% |
| Average | 63,275 | 14,713 | 3,542 |
Compare Acceptance Rate Change to Similar Colleges
The following table compares acceptance rate changes from last year between Boston University and similar schools.
| 2024 | 2023 | Change % | |
|---|---|---|---|
| Boston University | 11.00% | 14.37% | -23.45% |
| Lehigh University | 29.00% | 36.98% | -21.58% |
| College of the Holy Cross | 21.00% | 36.36% | -42.24% |
| Lafayette College | 31.00% | 33.63% | -7.82% |
| American University | 47.00% | 40.63% | 15.68% |
| Bucknell University | 32.00% | 32.55% | -1.69% |
Ratings & Review
Share your experiences and thoughts about Boston University. It will be a great help to applicants and prospective students!