At Clark University, the average acceptance rate over the past 11 years is 52.81%, and 2024's acceptance rate is 41.67%. For 2024 admission, it was slightly harder to get into Clark University than the previous year.
The average yield (enrollment rate) over the period is 14.51%, and the 2024 yield is 14.07%.
The number of Clark applicants increased by 22.11% (1,943 applicants) compared to the previous year.
Acceptance Rate Changes
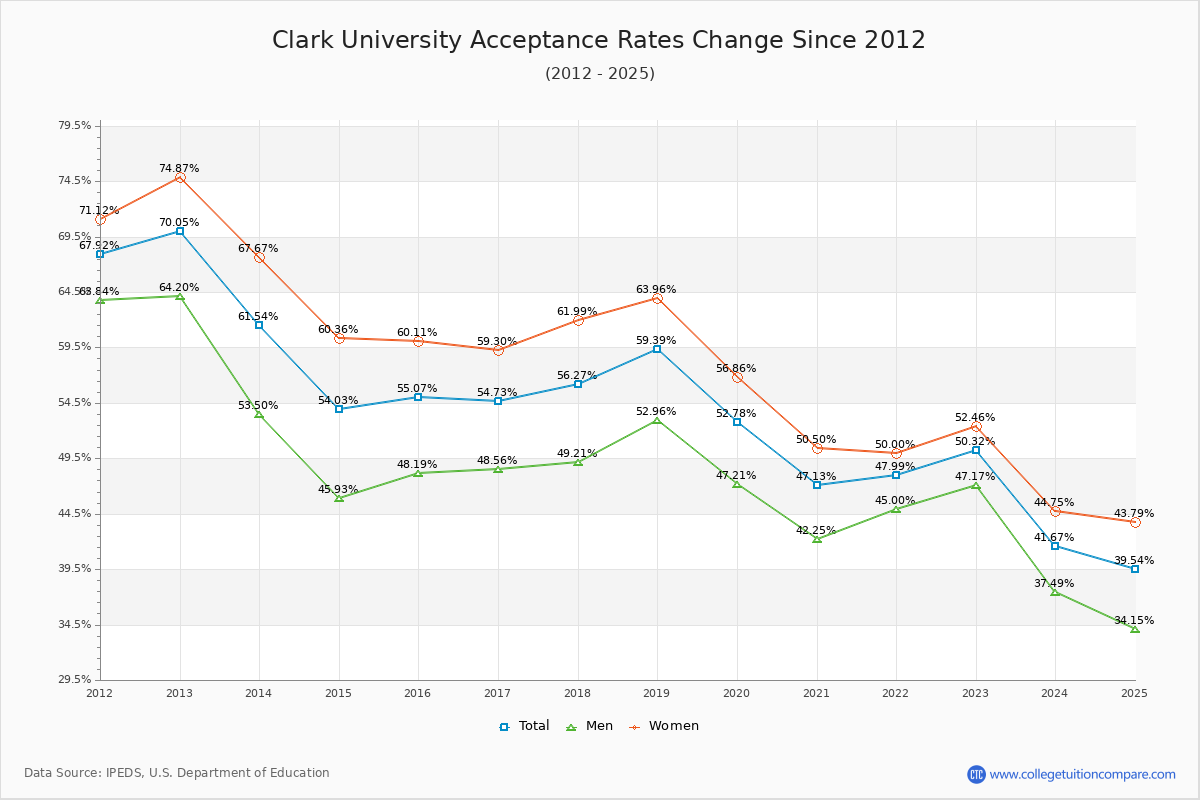
The average acceptance rate over the last 10 years is 52.81%, and this year's acceptance rate is 41.67% at Clark University. By gender, men students' acceptance rate is 47.04% and women students' rate is 57.09%. For 2024 admission, it was slightly harder to get into Clark University than the previous year.
The following table and chart illustrate the acceptance rates changes at Clark University over the past 11 years (2013-2024).
| Year | Total | Men | Women |
|---|---|---|---|
| 2013-14 | 61.54% | 53.50% | 67.67% |
| 2014-15 | 54.03% -7.51% |
45.93% -7.57% |
60.36% -7.31% |
| 2015-16 | 55.07% 1.04% |
48.19% 2.26% |
60.11% -0.25% |
| 2016-17 | 54.73% -0.34% |
48.56% 0.37% |
59.30% -0.81% |
| 2017-18 | 56.27% 1.54% |
49.21% 0.65% |
61.99% 2.69% |
| 2018-19 | 59.39% 3.12% |
52.96% 3.74% |
63.96% 1.98% |
| 2019-20 | 52.78% -6.60% |
47.21% -5.74% |
56.86% -7.10% |
| 2020-21 | 47.13% -5.65% |
42.25% -4.96% |
50.50% -6.36% |
| 2021-22 | 47.99% 0.87% |
45.00% 2.74% |
50.00% -0.50% |
| 2022-23 | 50.32% 2.33% |
47.17% 2.17% |
52.46% 2.46% |
| 2023-24 | 41.67% -8.66% |
37.49% -9.68% |
44.75% -7.71% |
| Average | 52.81% | 47.04% | 57.09% |
Admission Yield (Enrollment Rate) Changes
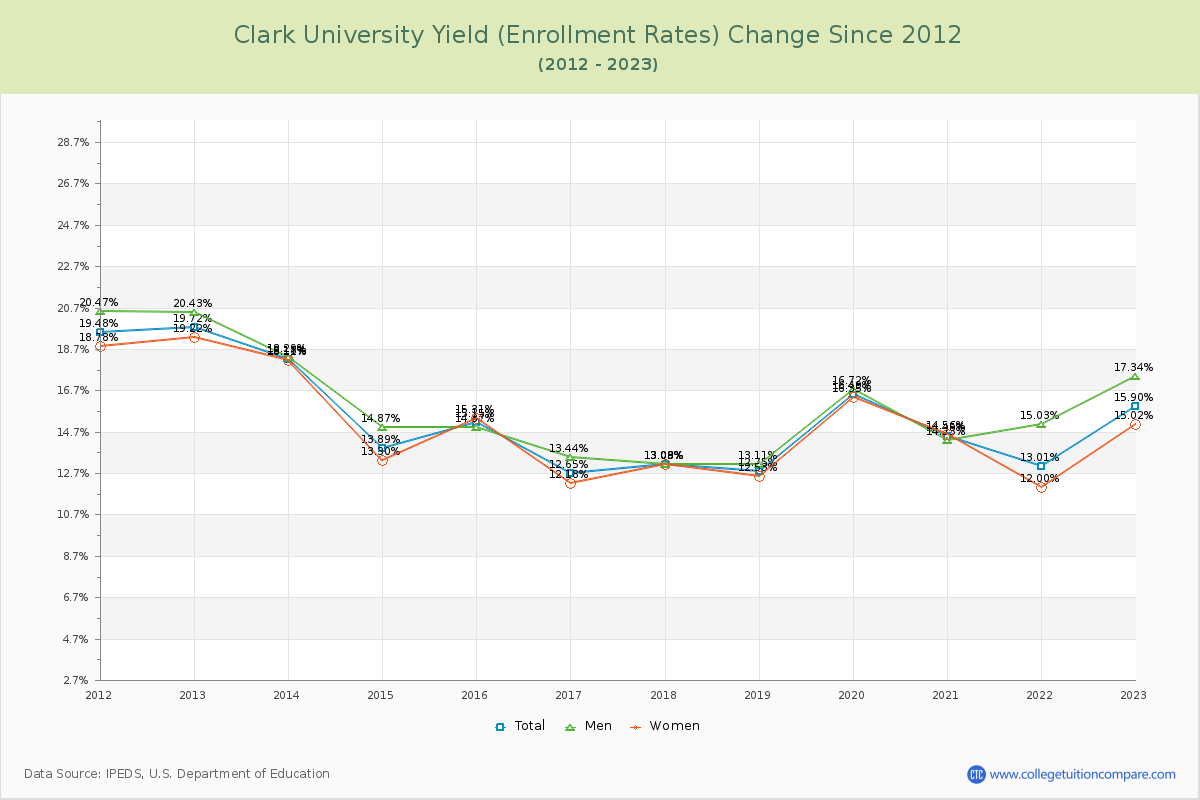
The average admission yield of the last 11 years is 14.51% where the current academic year yield is 14.07%.
The following table and chart illustrate the changes in yield at Clark University from 2013 to 2024.
| Year | Total | Men | Women |
|---|---|---|---|
| 2013-14 | 18.18% | 18.29% | 18.11% |
| 2014-15 | 13.89% -4.29% |
14.87% -3.42% |
13.30% -4.81% |
| 2015-16 | 15.15% 1.26% |
14.87% 0.00% |
15.31% 2.01% |
| 2016-17 | 12.65% -2.49% |
13.44% -1.43% |
12.18% -3.13% |
| 2017-18 | 13.08% 0.43% |
13.09% -0.35% |
13.08% 0.90% |
| 2018-19 | 12.75% -0.33% |
13.11% 0.02% |
12.53% -0.54% |
| 2019-20 | 16.49% 3.74% |
16.72% 3.61% |
16.35% 3.82% |
| 2020-21 | 14.45% -2.05% |
14.25% -2.47% |
14.56% -1.79% |
| 2021-22 | 13.01% -1.44% |
15.03% 0.78% |
12.00% -2.56% |
| 2022-23 | 15.90% 2.89% |
17.34% 2.31% |
15.02% 3.02% |
| 2023-24 | 14.07% -1.83% |
16.00% -1.34% |
12.88% -2.14% |
| Average | 14.51% | 15.18% | 14.12% |
Applicants, Admitted, and Enrolled Headcount Changes
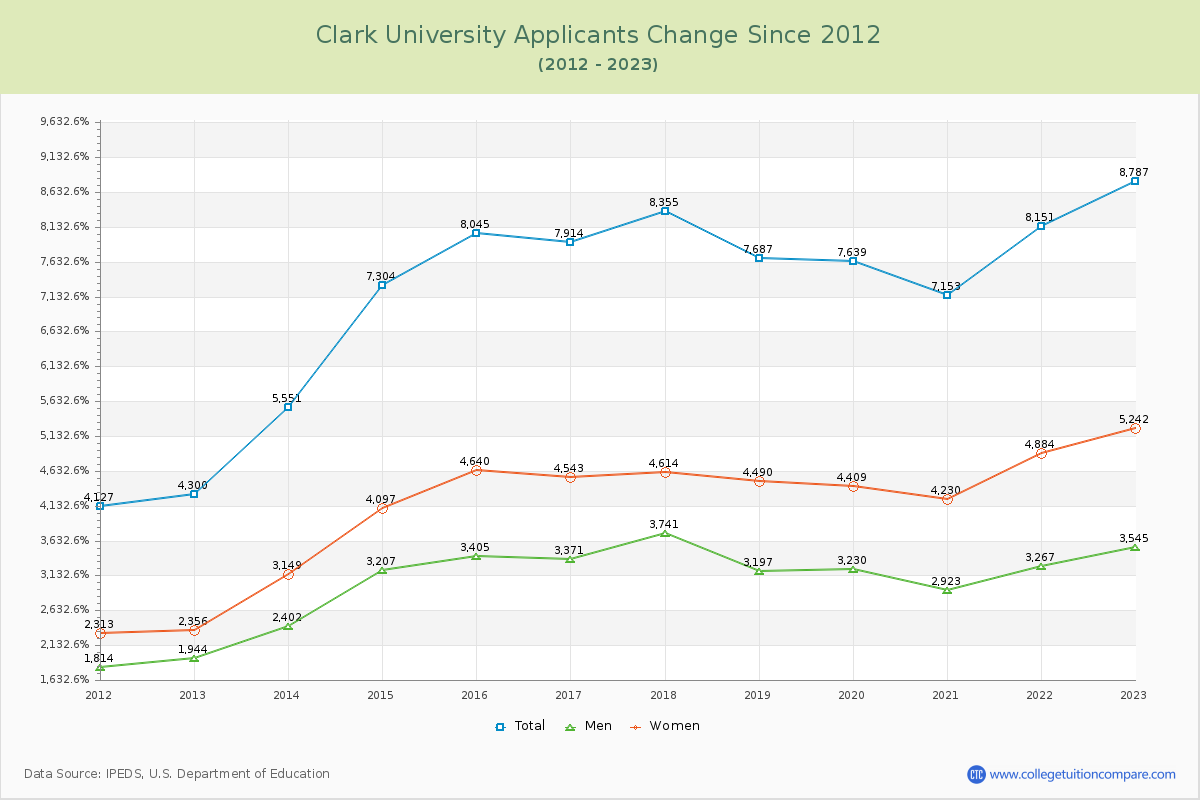
Over the past 10 years, The average number of applicants is 7,938, the average number of admitted is 4,145, and the average number of first-year enrolled students is 598.
The number of Clark applicants increased by 22.11% (1,943 applicants) compared to the previous year.
The following table and chart show the changes of applicants, admitted, and enrolled headcount at Clark University from 2013 to 2024.
| Year | Applicants | Admitted | Enrolled |
|---|---|---|---|
| 2013-14 | 5,551 | 3,416 | 621 |
| 2014-15 | 7,304 31.58% |
3,946 15.52% |
548 -11.76% |
| 2015-16 | 8,045 10.15% |
4,430 12.27% |
671 22.45% |
| 2016-17 | 7,914 -1.63% |
4,331 -2.23% |
548 -18.33% |
| 2017-18 | 8,355 5.57% |
4,701 8.54% |
615 12.23% |
| 2018-19 | 7,687 -8.00% |
4,565 -2.89% |
582 -5.37% |
| 2019-20 | 7,639 -0.62% |
4,032 -11.68% |
665 14.26% |
| 2020-21 | 7,153 -6.36% |
3,371 -16.39% |
487 -26.77% |
| 2021-22 | 8,151 13.95% |
3,912 16.05% |
509 4.52% |
| 2022-23 | 8,787 7.80% |
4,422 13.04% |
703 38.11% |
| 2023-24 | 10,730 22.11% |
4,471 1.11% |
629 -10.53% |
| Average | 7,938 | 4,145 | 598 |
Compare Acceptance Rate Change to Similar Colleges
The following table compares acceptance rate changes from last year between Clark University and similar schools.
| 2024 | 2023 | Change % | |
|---|---|---|---|
| Clark University | 42.00% | 50.32% | -16.53% |
| Boston University | 11.00% | 14.37% | -23.45% |
| Northeastern University | 6.00% | 6.80% | -11.76% |
| Harvard University | 3.00% | 3.24% | -7.41% |
| Boston College | 16.00% | 16.66% | -3.96% |
| Tufts University | 10.00% | 9.69% | 3.20% |
Ratings & Review
Share your experiences and thoughts about Clark University. It will be a great help to applicants and prospective students!