At Columbia University in the City of New York, the average acceptance rate over the past 11 years is 5.87%, and 2024's acceptance rate is 4.23%. Columbia University has beep kept its acceptance rate definitely low and it is very hard that applicants admit into the school.
The average yield (enrollment rate) over the period is 61.97%, and the 2024 yield is 63.14%.
The number of Columbia University applicants decreased by -5.36% (3,266 applicants) compared to the previous year.
Acceptance Rate Changes
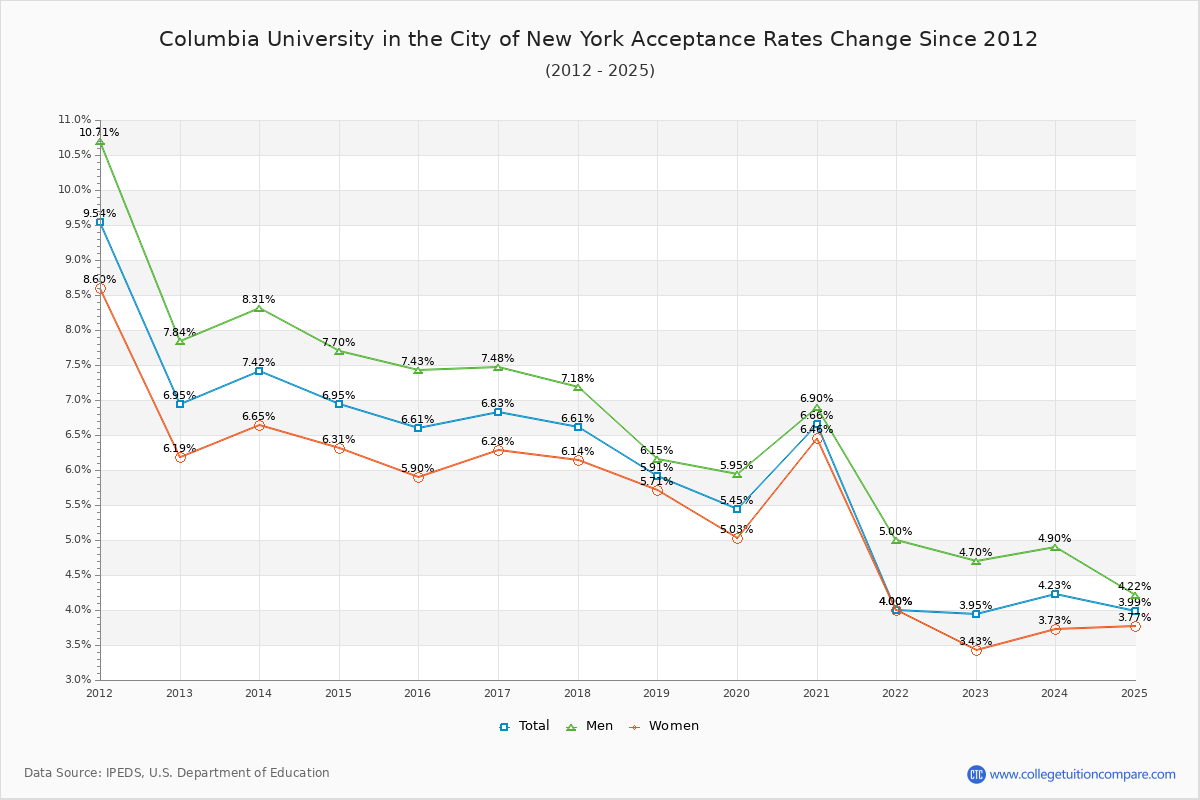
The average acceptance rate over the last 10 years is 5.87%, and this year's acceptance rate is 4.23% at Columbia University in the City of New York. By gender, men students' acceptance rate is 6.52% and women students' rate is 5.42%. Columbia University has beep kept its acceptance rate definitely low and it is very hard that applicants admit into the school.
The following table and chart illustrate the acceptance rates changes at Columbia University in the City of New York over the past 11 years (2013-2024).
| Year | Total | Men | Women |
|---|---|---|---|
| 2013-14 | 7.42% | 8.31% | 6.65% |
| 2014-15 | 6.95% -0.47% |
7.70% -0.61% |
6.31% -0.34% |
| 2015-16 | 6.61% -0.34% |
7.43% -0.27% |
5.90% -0.41% |
| 2016-17 | 6.83% 0.22% |
7.48% 0.05% |
6.28% 0.38% |
| 2017-18 | 6.61% -0.22% |
7.18% -0.30% |
6.14% -0.15% |
| 2018-19 | 5.91% -0.70% |
6.15% -1.02% |
5.71% -0.42% |
| 2019-20 | 5.45% -0.47% |
5.95% -0.20% |
5.03% -0.68% |
| 2020-21 | 6.66% 1.21% |
6.90% 0.95% |
6.46% 1.43% |
| 2021-22 | 4.00% -2.66% |
5.00% -1.90% |
4.00% -2.46% |
| 2022-23 | 3.95% -0.05% |
4.70% -0.30% |
3.43% -0.57% |
| 2023-24 | 4.23% 0.28% |
4.90% 0.20% |
3.73% 0.30% |
| Average | 5.87% | 6.52% | 5.42% |
Admission Yield (Enrollment Rate) Changes
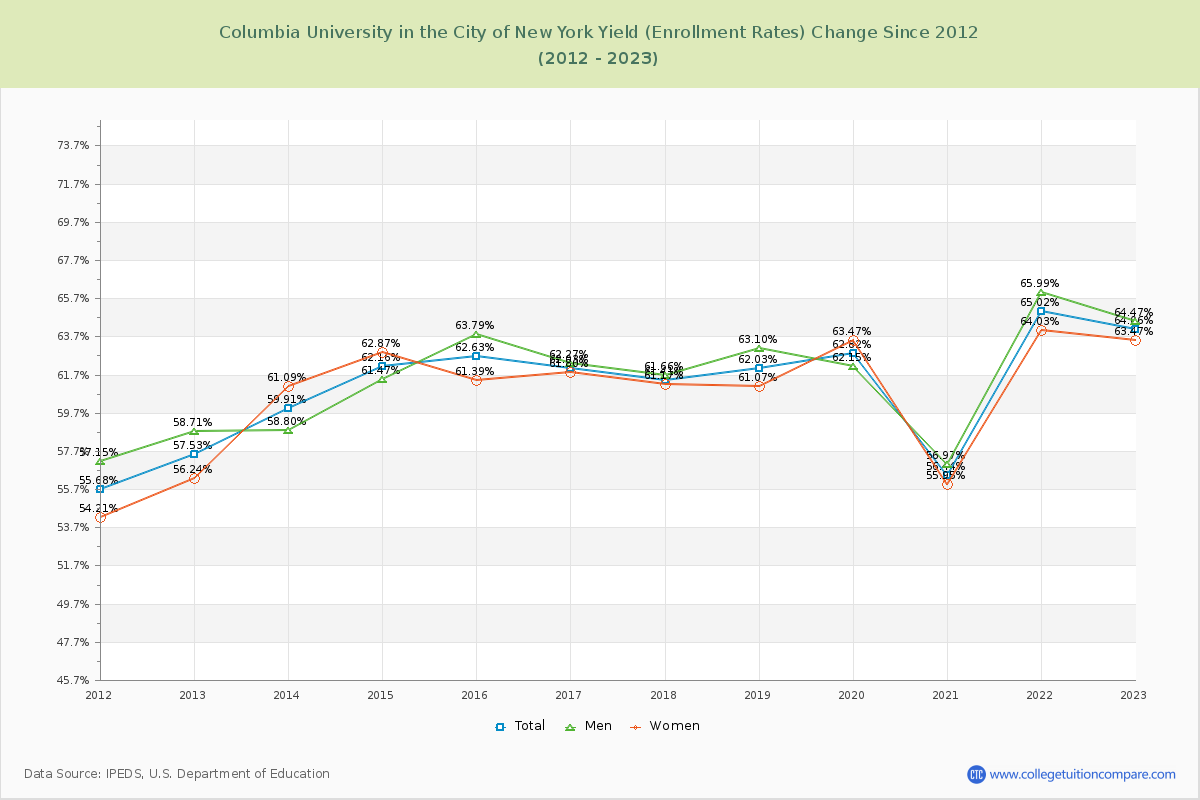
The average admission yield of the last 11 years is 61.97% where the current academic year yield is 63.14%.
The following table and chart illustrate the changes in yield at Columbia University in the City of New York from 2013 to 2024.
| Year | Total | Men | Women |
|---|---|---|---|
| 2013-14 | 59.91% | 58.80% | 61.09% |
| 2014-15 | 62.16% 2.25% |
61.47% 2.67% |
62.87% 1.78% |
| 2015-16 | 62.63% 0.48% |
63.79% 2.32% |
61.39% -1.47% |
| 2016-17 | 62.03% -0.60% |
62.27% -1.52% |
61.80% 0.40% |
| 2017-18 | 61.41% -0.62% |
61.66% -0.61% |
61.17% -0.63% |
| 2018-19 | 62.03% 0.61% |
63.10% 1.43% |
61.07% -0.10% |
| 2019-20 | 62.82% 0.80% |
62.15% -0.94% |
63.47% 2.40% |
| 2020-21 | 56.44% -6.38% |
56.97% -5.18% |
55.95% -7.52% |
| 2021-22 | 65.02% 8.58% |
65.99% 9.01% |
64.03% 8.07% |
| 2022-23 | 64.06% -0.96% |
64.47% -1.52% |
63.47% -0.56% |
| 2023-24 | 63.14% -0.92% |
63.63% -0.84% |
62.98% -0.49% |
| Average | 61.97% | 62.21% | 61.75% |
Applicants, Admitted, and Enrolled Headcount Changes
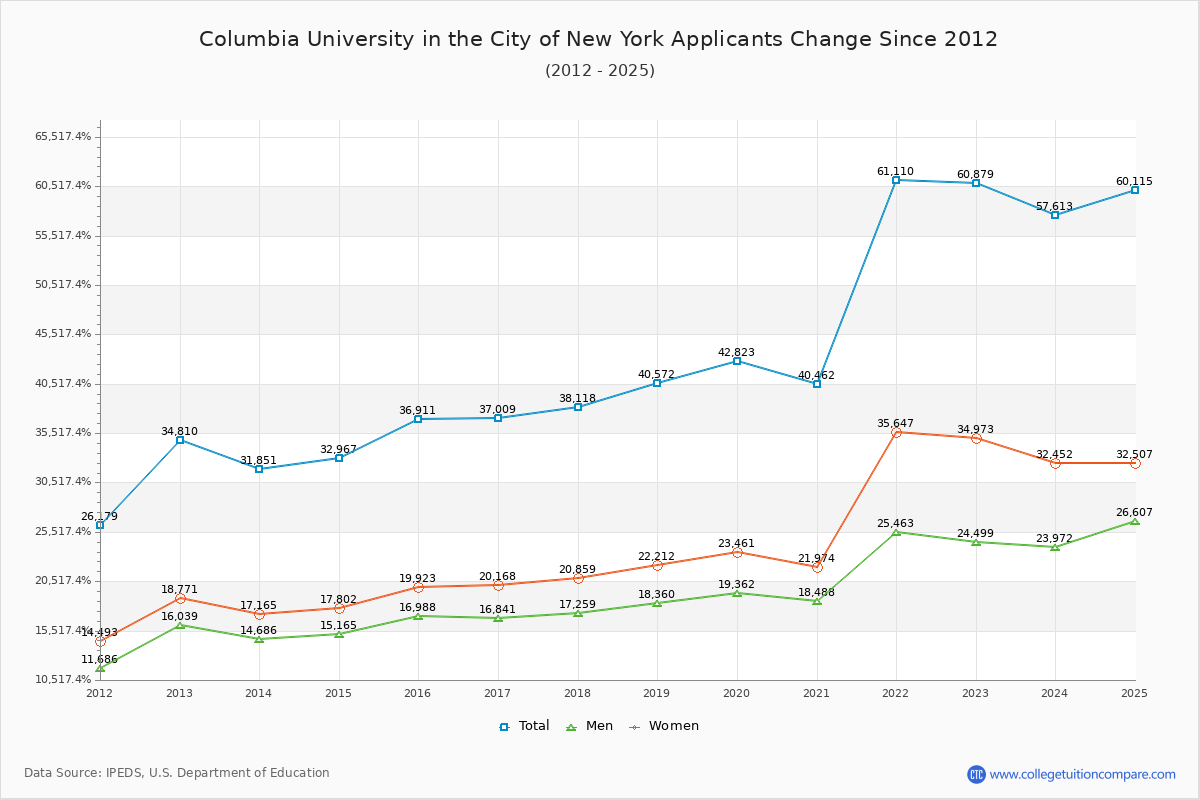
Over the past 10 years, The average number of applicants is 43,665, the average number of admitted is 2,441, and the average number of first-year enrolled students is 1,511.
The number of Columbia University applicants decreased by -5.36% (3,266 applicants) compared to the previous year.
The following table and chart show the changes of applicants, admitted, and enrolled headcount at Columbia University in the City of New York from 2013 to 2024.
| Year | Applicants | Admitted | Enrolled |
|---|---|---|---|
| 2013-14 | 31,851 | 2,362 | 1,415 |
| 2014-15 | 32,967 3.50% |
2,291 -3.01% |
1,424 0.64% |
| 2015-16 | 36,911 11.96% |
2,438 6.42% |
1,527 7.23% |
| 2016-17 | 37,009 0.27% |
2,526 3.61% |
1,567 2.62% |
| 2017-18 | 38,118 3.00% |
2,519 -0.28% |
1,547 -1.28% |
| 2018-19 | 40,572 6.44% |
2,399 -4.76% |
1,488 -3.81% |
| 2019-20 | 42,823 5.55% |
2,332 -2.79% |
1,465 -1.55% |
| 2020-21 | 40,462 -5.51% |
2,695 15.57% |
1,521 3.82% |
| 2021-22 | 61,110 51.03% |
2,444 -9.31% |
1,589 4.47% |
| 2022-23 | 60,879 -0.38% |
2,404 -1.64% |
1,540 -3.08% |
| 2023-24 | 57,613 -5.36% |
2,439 1.46% |
1,540 |
| Average | 43,665 | 2,441 | 1,511 |
Compare Acceptance Rate Change to Similar Colleges
The following table compares acceptance rate changes from last year between Columbia University in the City of New York and similar schools.
| 2024 | 2023 | Change % | |
|---|---|---|---|
| Columbia University in the City of New York | 4.00% | 3.95% | 1.27% |
| Princeton University | 4.00% | 5.70% | -29.82% |
| Dartmouth College | 6.00% | 6.38% | -5.96% |
| Cornell University | 8.00% | 7.47% | 7.10% |
| Yale University | 5.00% | 4.57% | 9.41% |
| Harvard University | 3.00% | 3.24% | -7.41% |
Ratings & Review
Share your experiences and thoughts about Columbia University in the City of New York. It will be a great help to applicants and prospective students!