The student population at CUNY Graduate School and University Center is 9,116 (3,237 undergraduate and 5,879 graduate students) . The number of students has increased by 2,380 over the past decade.
The percentage of undergraduate students at CUNY Graduate Center is 35.51% which is increased by 1,890 over last 10 years. The graduate student population increased by 490 and it has been increasing.
The female to male ratio is 2.01 to 1 which means that majority of population is on female students.
4,305 students enrolled in online degree program exclusively and the number of online students has increased by 159.34% since 2014.
Student Population Changes
The average student population over the last 12 years is 8,042 where 9,116 students are attending the school for the academic year 2023-2024.
35.51% of total students is undergraduate students and 64.49% students is graduate students. The number of undergraduate students has increased by 1,890 and the graduate enrollment has increased by 490 over past 10 years.
The female to male ratio is 2.01 to 1 and it means that there are far more female students enrolled in CUNY Graduate Center than male students.
The following table and chart illustrate the changes in student population by gender at CUNY Graduate School and University Center since 2013.
| Year | Total | Undergraduate | Graduate | ||||
|---|---|---|---|---|---|---|---|
| Total | Men | Women | Total | Men | Women | ||
| 2013-14 | 6,736 | 1,347 | 428 | 919 | 5,389 | 2,180 | 3,209 |
| 2014-15 | 7,013 277 | 1,684 337 | 512 84 | 1,172 253 | 5,329 -60 | 2,149 -31 | 3,180 -29 |
| 2015-16 | 6,954 -59 | 1,795 111 | 539 27 | 1,256 84 | 5,159 -170 | 2,143 -6 | 3,016 -164 |
| 2016-17 | 7,378 424 | 1,794 -1 | 484 -55 | 1,310 54 | 5,584 425 | 2,236 93 | 3,348 332 |
| 2017-18 | 7,674 296 | 2,066 272 | 588 104 | 1,478 168 | 5,608 24 | 2,228 -8 | 3,380 32 |
| 2018-19 | 8,041 367 | 2,287 221 | 636 48 | 1,651 173 | 5,754 146 | 2,226 -2 | 3,528 148 |
| 2019-20 | 8,503 462 | 2,498 211 | 737 101 | 1,761 110 | 6,005 251 | 2,309 83 | 3,696 168 |
| 2020-21 | 9,300 797 | 2,973 475 | 841 104 | 2,132 371 | 6,327 322 | 2,328 19 | 3,999 303 |
| 2021-22 | 9,017 -283 | 2,748 -225 | 705 -136 | 2,043 -89 | 6,269 -58 | 2,296 -32 | 3,973 -26 |
| 2022-23 | 8,733 -284 | 2,793 45 | 725 20 | 2,068 25 | 5,940 -329 | 2,130 -166 | 3,810 -163 |
| 2023-24 | 9,116 383 | 3,237 444 | 901 176 | 2,336 268 | 5,879 -61 | 2,129 -1 | 3,750 -60 |
| Average | 8,042 | 2,293 | 645 | 1,648 | 5,749 | 2,214 | 3,535 |
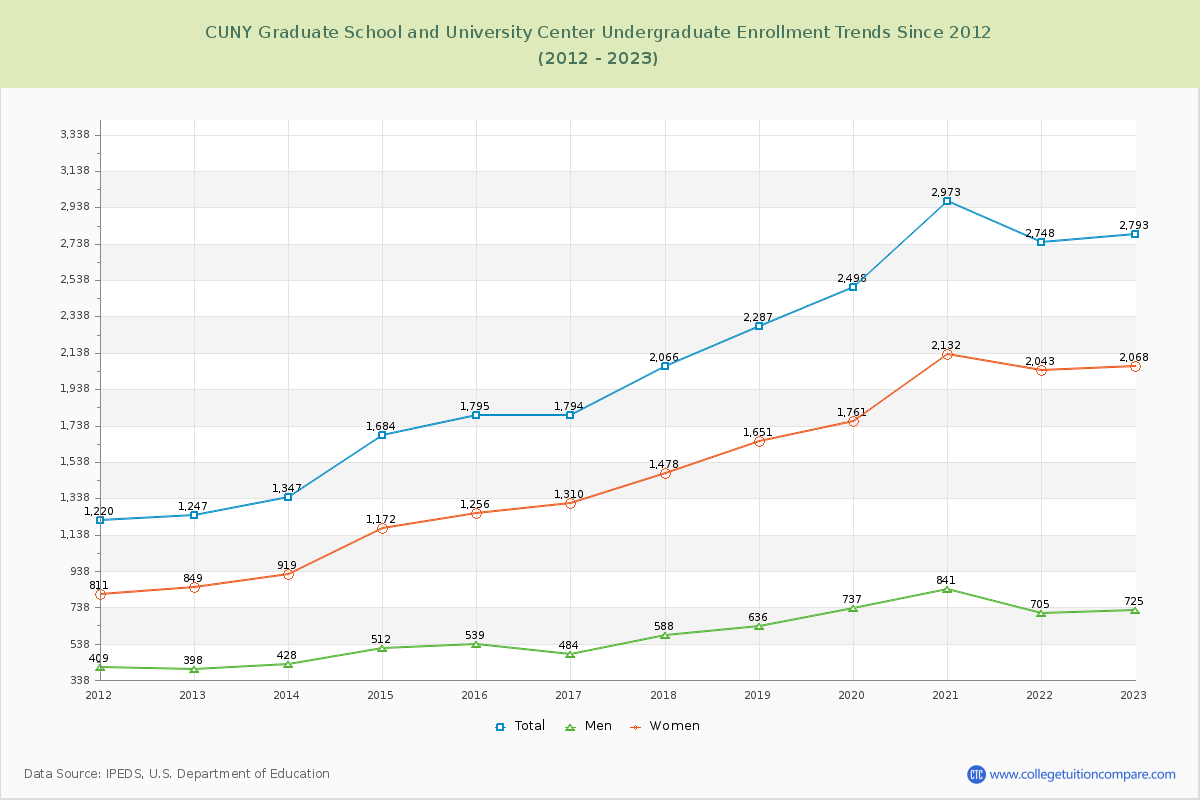
Undergraduate Enrollment Changes
The average number of Undergraduate students over the last 12 years is 2,293 where 3,237 students are attending the Undergraduate school for the academic year 2023-2024. The following table and chart illustrate the changes in Undergraduate enrollment by attending status and gender at CUNY Graduate School and University Center since 2013.
| Year | Total | Full-time | Part-time | ||||
|---|---|---|---|---|---|---|---|
| Total | Men | Women | Total | Men | Women | ||
| 2013-14 | 1,347 | 296 | 85 | 211 | 1,051 | 343 | 708 |
| 2014-15 | 1,684 | 342 | 81 | 261 | 1,342 | 431 | 911 |
| 2015-16 | 1,795 | 350 | 99 | 251 | 1,445 | 440 | 1,005 |
| 2016-17 | 1,794 | 354 | 88 | 266 | 1,440 | 396 | 1,044 |
| 2017-18 | 2,066 | 418 | 116 | 302 | 1,648 | 472 | 1,176 |
| 2018-19 | 2,287 | 411 | 120 | 291 | 1,876 | 516 | 1,360 |
| 2019-20 | 2,498 | 468 | 131 | 337 | 2,030 | 606 | 1,424 |
| 2020-21 | 2,973 | 714 | 193 | 521 | 2,259 | 648 | 1,611 |
| 2021-22 | 2,748 | 734 | 178 | 556 | 2,014 | 527 | 1,487 |
| 2022-23 | 2,793 | 892 | 247 | 645 | 1,901 | 478 | 1,423 |
| 2023-24 | 3,237 | 1,031 | 315 | 716 | 2,206 | 586 | 1,620 |
| Average | 2,293 | 2,293 | 150 | 396 | 2,293 | 495 | 1,252 |
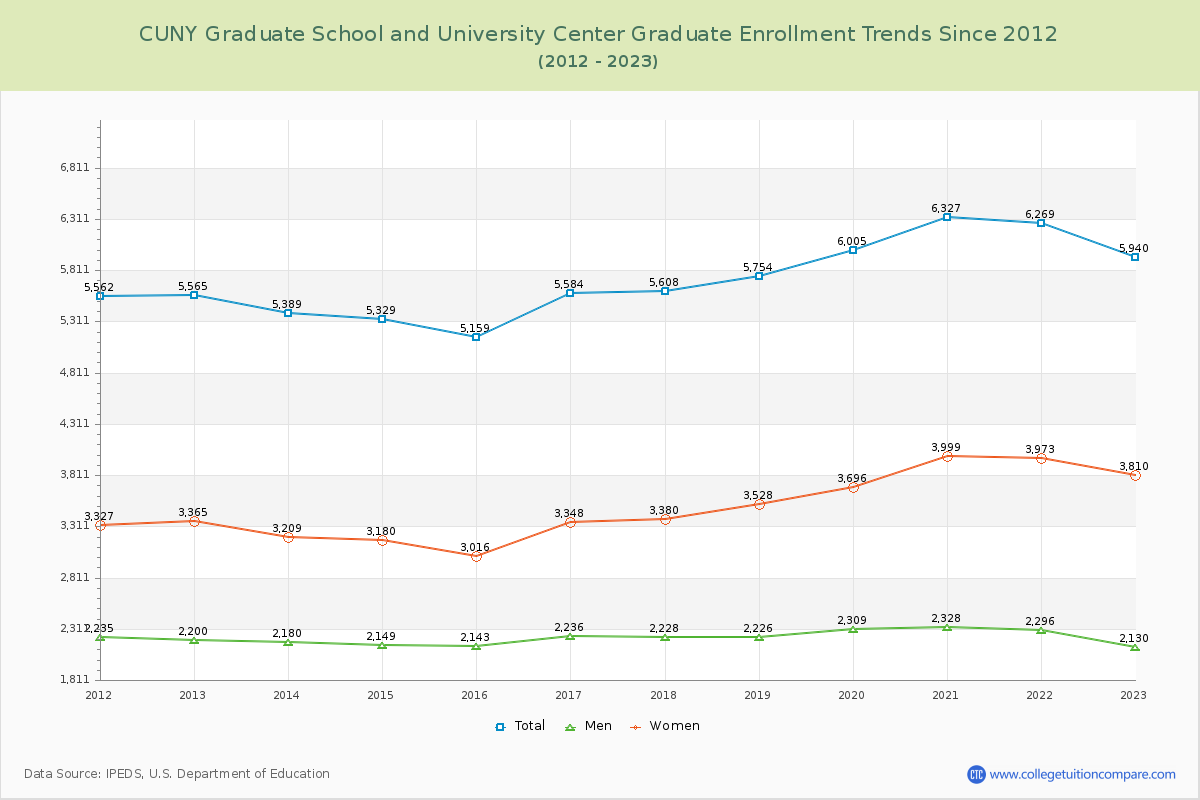
Graduate Enrollment Changes
The average number of Graduate students over the last 12 years is 5,749 where 5,879 students are attending the Graduate school for the academic year 2023-2024. The following table and chart illustrate the changes in Graduate enrollment by attending status and gender at CUNY Graduate School and University Center since 2013.
| Year | Total | Full-time | Part-time | ||||
|---|---|---|---|---|---|---|---|
| Total | Men | Women | Total | Men | Women | ||
| 2013-14 | 5,389 | 4,158 | 1,760 | 2,398 | 1,231 | 420 | 811 |
| 2014-15 | 5,329 | 3,978 | 1,690 | 2,288 | 1,351 | 459 | 892 |
| 2015-16 | 5,159 | 3,796 | 1,664 | 2,132 | 1,363 | 479 | 884 |
| 2016-17 | 5,584 | 3,630 | 1,581 | 2,049 | 1,954 | 655 | 1,299 |
| 2017-18 | 5,608 | 3,540 | 1,544 | 1,996 | 2,068 | 684 | 1,384 |
| 2018-19 | 5,754 | 3,558 | 1,541 | 2,017 | 2,196 | 685 | 1,511 |
| 2019-20 | 6,005 | 3,628 | 1,553 | 2,075 | 2,377 | 756 | 1,621 |
| 2020-21 | 6,327 | 3,577 | 1,481 | 2,096 | 2,750 | 847 | 1,903 |
| 2021-22 | 6,269 | 3,434 | 1,451 | 1,983 | 2,835 | 845 | 1,990 |
| 2022-23 | 5,940 | 3,291 | 1,345 | 1,946 | 2,649 | 785 | 1,864 |
| 2023-24 | 5,879 | 3,258 | 1,343 | 1,915 | 2,621 | 786 | 1,835 |
| Average | 5,749 | 5,749 | 1,541 | 2,081 | 5,749 | 673 | 1,454 |

Enrollment by Race/Ethnicity Changes
The percentage of white students is 31.58% and the percentage of black students is 19.70% at CUNY Graduate School and University Center. 12.00% of enrolled students is Asian.
The following table and chart illustrate the student population trends by race/ethnicity at CUNY Graduate School and University Center over the past 12 years (2013-2024).
| Year | American Indian or Native American | Asian | Black | Hispanic | Native Hawaiian or Other Pacific Islander | White | Two or More Races |
|---|---|---|---|---|---|---|---|
| 2013-14 | 4 | 288 | 943 | 2,156 | 5 | 2,431 | 20 |
| 2014-15 | 9 | 355 | 1,050 | 2,476 | 5 | 2,232 | 26 |
| 2015-16 | 8 | 357 | 1,029 | 2,772 | 8 | 1,785 | 64 |
| 2016-17 | 9 | 428 | 1,109 | 2,911 | 6 | 1,837 | 90 |
| 2017-18 | 14 | 509 | 1,085 | 3,138 | 11 | 1,752 | 120 |
| 2018-19 | 12 | 776 | 1,434 | 1,581 | 16 | 3,019 | 177 |
| 2019-20 | 11 | 880 | 1,630 | 1,692 | 21 | 3,046 | 189 |
| 2020-21 | 19 | 1,022 | 1,721 | 1,917 | 14 | 3,360 | 224 |
| 2021-22 | 14 | 1,048 | 1,620 | 1,898 | 16 | 3,241 | 207 |
| 2022-23 | 17 | 1,018 | 1,636 | 1,831 | 19 | 3,002 | 218 |
| 2023-24 | 22 | 1,094 | 1,796 | 2,011 | 13 | 2,879 | 241 |
| Average | 13 | 707 | 1,368 | 2,217 | 12 | 2,599 | 143 |

Distance Learning (Online Courses) Enrollment Changes
4,305 students are enrolled in online degree programs exclusively for the academic year 2023-2024, which is 47% of total students. The number of online students has increased 159.34% since 2014. The following table and chart illustrate the changes in the online student population by enrolled type at CUNY Graduate School and University Center from 2014 to 2024.
| Year | Total Enrollment | Online Completely | Enrolled in Some Online Courses | Not Enrolled in Online Courses |
|---|---|---|---|---|
| 2014-15 | 7,013 | 1,660 | 81 | 5,272 |
| 2015-16 | 6,954 | 1,817 | 82 | 5,055 |
| 2016-17 | 7,378 | 2,098 | 69 | 5,211 |
| 2017-18 | 7,674 | 2,414 | 237 | 5,023 |
| 2018-19 | 8,041 | 2,981 | 287 | 4,773 |
| 2019-20 | 8,503 | 3,452 | 365 | 4,686 |
| 2020-21 | 9,300 | 9,260 | 36 | 4 |
| 2021-22 | 9,017 | 7,230 | 1,191 | 596 |
| 2022-23 | 8,733 | 6,263 | 880 | 1,590 |
| 2023-24 | 9,116 | 4,305 | 1,260 | 3,551 |
| Average | 8,173 | 4,148 | 449 | 3,576 |
Ratings & Review
Share your experiences and thoughts about CUNY Graduate School and University Center. It will be a great help to applicants and prospective students!