The student population at DeVry University-Illinois is 29,346 (26,146 undergraduate and 3,200 graduate students) . The number of students has increased by 2,495 over the past decade.
The percentage of undergraduate students at DeVry University-Illinois is 89.10% which is increased by 5,780 over last 10 years. The graduate student population decreased by 3,285 and it has been decreasing.
The female to male ratio is 1.95 to 1 which means that female students enrolled more than male students.
28,245 students enrolled in online degree program exclusively and the number of online students has increased by 41.46% since 2014.
Student Population Changes
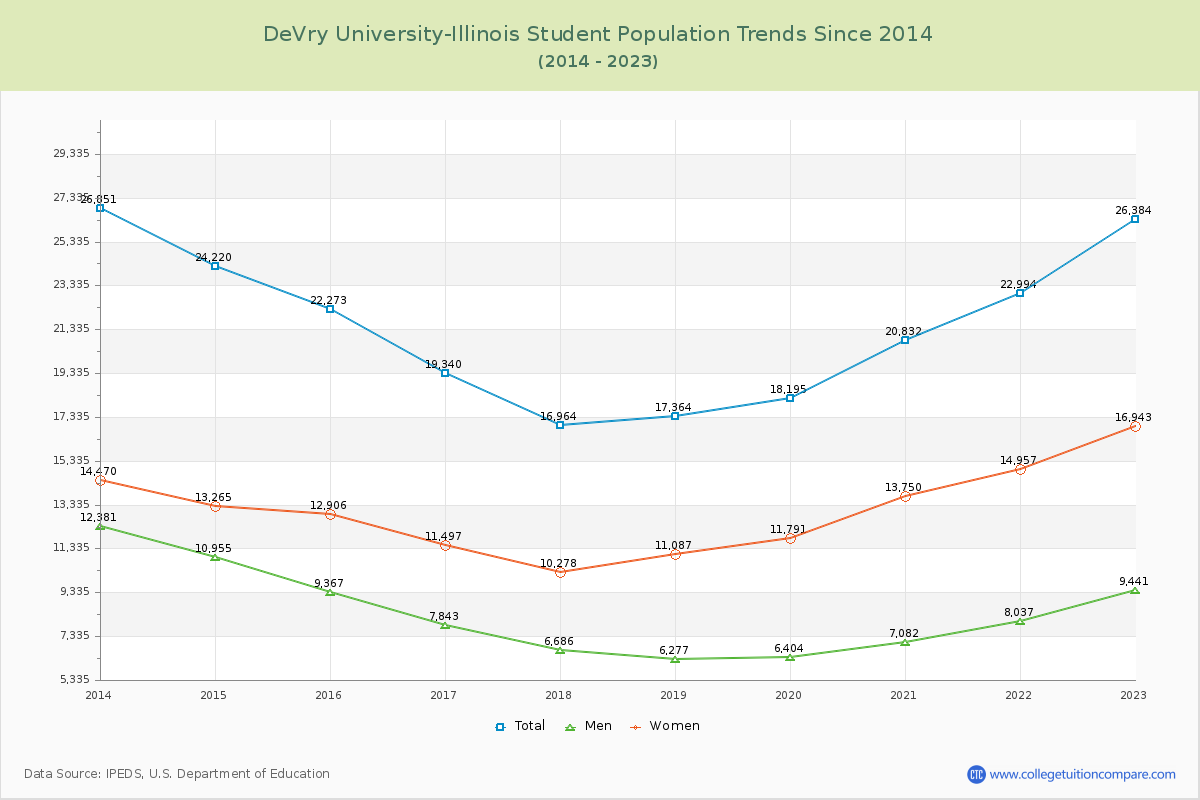
The average student population over the last 12 years is 22,251 where 29,346 students are attending the school for the academic year 2023-2024.
89.10% of total students is undergraduate students and 10.90% students is graduate students. The number of undergraduate students has increased by 5,780 and the graduate enrollment has decreased by 3,285 over past 10 years.
The female to male ratio is 1.95 to 1 and it means that there are more female students enrolled in DeVry University-Illinois than male students.
The following table and chart illustrate the changes in student population by gender at DeVry University-Illinois since 2013.
| Year | Total | Undergraduate | Graduate | ||||
|---|---|---|---|---|---|---|---|
| Total | Men | Women | Total | Men | Women | ||
| 2013-14 | 26,851 | 20,366 | 9,822 | 10,544 | 6,485 | 2,559 | 3,926 |
| 2014-15 | 24,220 -2,631 | 18,264 -2,102 | 8,576 -1,246 | 9,688 -856 | 5,956 -529 | 2,379 -180 | 3,577 -349 |
| 2015-16 | 22,273 -1,947 | 16,499 -1,765 | 7,011 -1,565 | 9,488 -200 | 5,774 -182 | 2,356 -23 | 3,418 -159 |
| 2016-17 | 19,340 -2,933 | 14,471 -2,028 | 5,872 -1,139 | 8,599 -889 | 4,869 -905 | 1,971 -385 | 2,898 -520 |
| 2017-18 | 16,964 -2,376 | 12,515 -1,956 | 4,850 -1,022 | 7,665 -934 | 4,449 -420 | 1,836 -135 | 2,613 -285 |
| 2018-19 | 17,364 400 | 13,068 553 | 4,624 -226 | 8,444 779 | 4,296 -153 | 1,653 -183 | 2,643 30 |
| 2019-20 | 18,195 831 | 14,163 1,095 | 4,912 288 | 9,251 807 | 4,032 -264 | 1,492 -161 | 2,540 -103 |
| 2020-21 | 20,832 2,637 | 17,174 3,011 | 5,689 777 | 11,485 2,234 | 3,658 -374 | 1,393 -99 | 2,265 -275 |
| 2021-22 | 22,994 2,162 | 19,866 2,692 | 6,843 1,154 | 13,023 1,538 | 3,128 -530 | 1,194 -199 | 1,934 -331 |
| 2022-23 | 26,384 3,390 | 23,357 3,491 | 8,217 1,374 | 15,140 2,117 | 3,027 -101 | 1,224 30 | 1,803 -131 |
| 2023-24 | 29,346 2,962 | 26,146 2,789 | 8,728 511 | 17,418 2,278 | 3,200 173 | 1,215 -9 | 1,985 182 |
| Average | 22,251 | 17,808 | 6,831 | 10,977 | 4,443 | 1,752 | 2,691 |
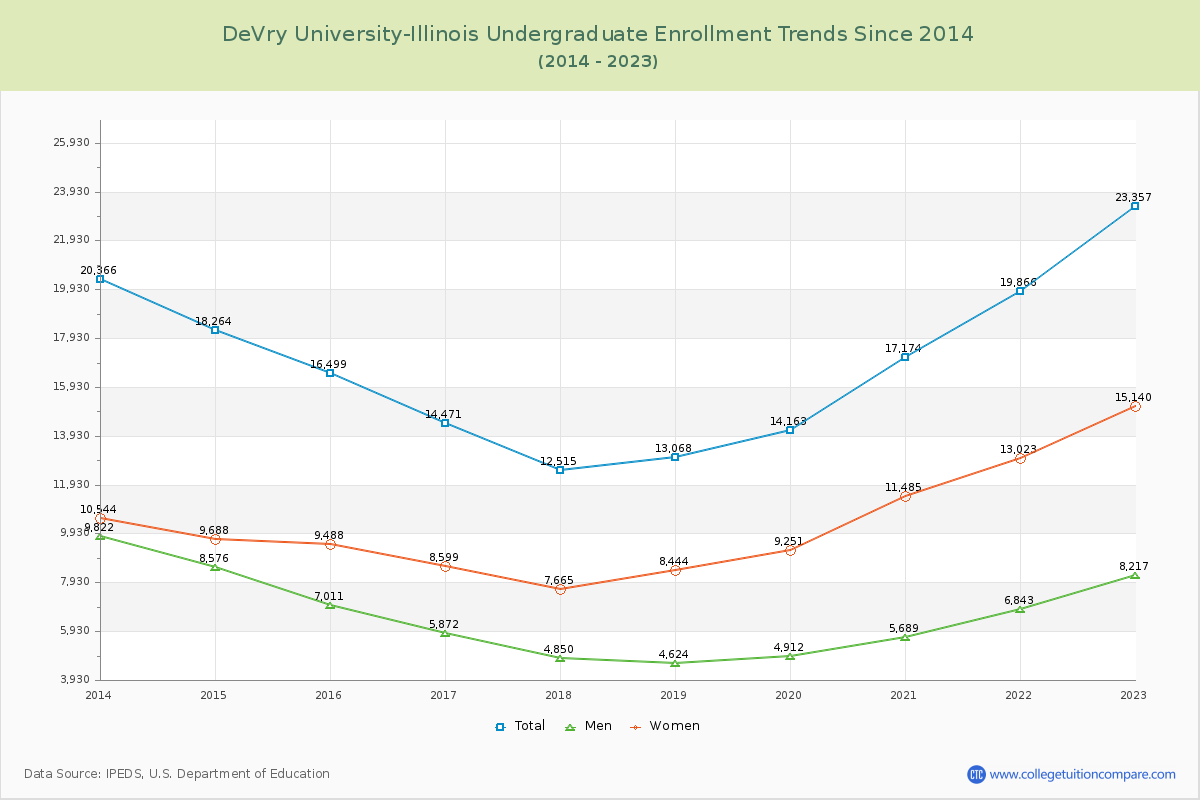
Undergraduate Enrollment Changes
The average number of Undergraduate students over the last 12 years is 17,808 where 26,146 students are attending the Undergraduate school for the academic year 2023-2024. The following table and chart illustrate the changes in Undergraduate enrollment by attending status and gender at DeVry University-Illinois since 2013.
| Year | Total | Full-time | Part-time | ||||
|---|---|---|---|---|---|---|---|
| Total | Men | Women | Total | Men | Women | ||
| 2013-14 | 20,366 | 6,370 | 3,250 | 3,120 | 13,996 | 6,572 | 7,424 |
| 2014-15 | 18,264 | 5,870 | 2,939 | 2,931 | 12,394 | 5,637 | 6,757 |
| 2015-16 | 16,499 | 5,543 | 2,566 | 2,977 | 10,956 | 4,445 | 6,511 |
| 2016-17 | 14,471 | 4,526 | 2,008 | 2,518 | 9,945 | 3,864 | 6,081 |
| 2017-18 | 12,515 | 4,234 | 1,828 | 2,406 | 8,281 | 3,022 | 5,259 |
| 2018-19 | 13,068 | 4,798 | 1,838 | 2,960 | 8,270 | 2,786 | 5,484 |
| 2019-20 | 14,163 | 5,366 | 2,080 | 3,286 | 8,797 | 2,832 | 5,965 |
| 2020-21 | 17,174 | 6,979 | 2,522 | 4,457 | 10,195 | 3,167 | 7,028 |
| 2021-22 | 19,866 | 7,870 | 2,825 | 5,045 | 11,996 | 4,018 | 7,978 |
| 2022-23 | 23,357 | 9,523 | 3,685 | 5,838 | 13,834 | 4,532 | 9,302 |
| 2023-24 | 26,146 | 11,077 | 4,004 | 7,073 | 15,069 | 4,724 | 10,345 |
| Average | 17,808 | 17,808 | 2,686 | 3,874 | 17,808 | 4,145 | 7,103 |
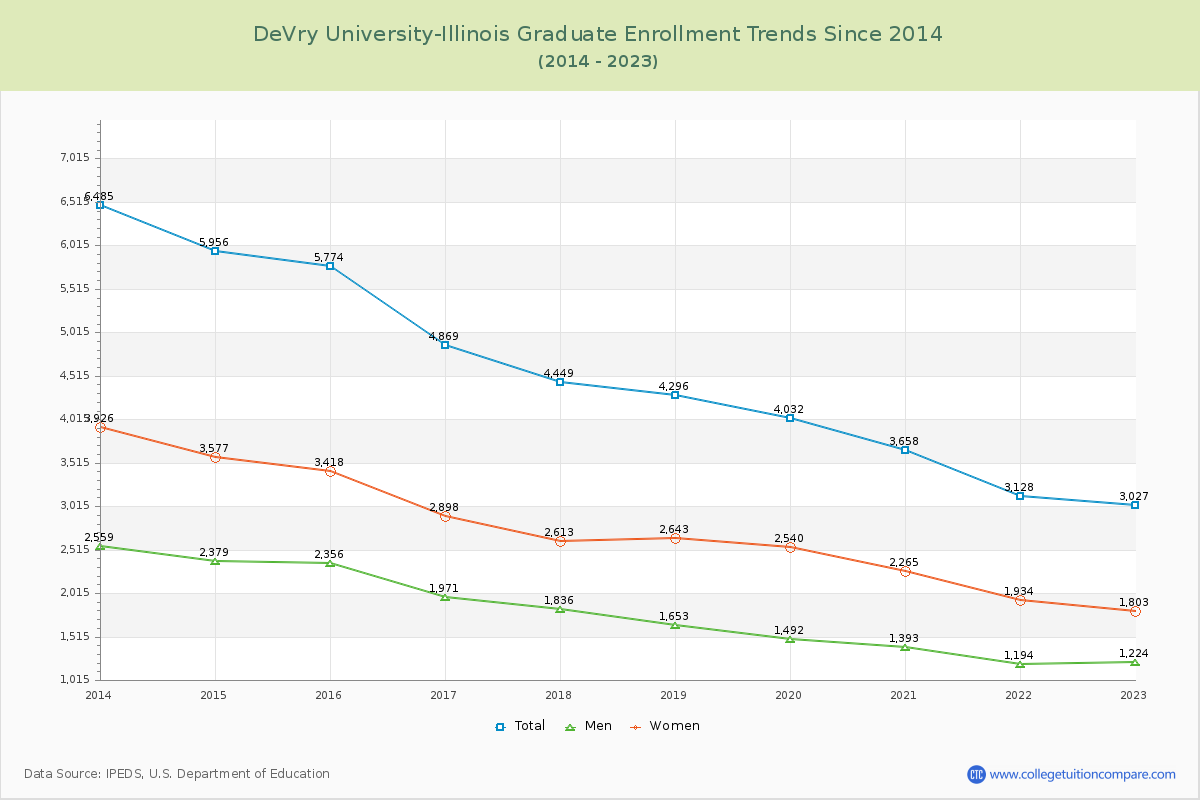
Graduate Enrollment Changes
The average number of Graduate students over the last 12 years is 4,443 where 3,200 students are attending the Graduate school for the academic year 2023-2024. The following table and chart illustrate the changes in Graduate enrollment by attending status and gender at DeVry University-Illinois since 2013.
| Year | Total | Full-time | Part-time | ||||
|---|---|---|---|---|---|---|---|
| Total | Men | Women | Total | Men | Women | ||
| 2013-14 | 6,485 | 1,201 | 436 | 765 | 5,284 | 2,123 | 3,161 |
| 2014-15 | 5,956 | 1,035 | 424 | 611 | 4,921 | 1,955 | 2,966 |
| 2015-16 | 5,774 | 989 | 399 | 590 | 4,785 | 1,957 | 2,828 |
| 2016-17 | 4,869 | 677 | 281 | 396 | 4,192 | 1,690 | 2,502 |
| 2017-18 | 4,449 | 617 | 268 | 349 | 3,832 | 1,568 | 2,264 |
| 2018-19 | 4,296 | 575 | 213 | 362 | 3,721 | 1,440 | 2,281 |
| 2019-20 | 4,032 | 511 | 206 | 305 | 3,521 | 1,286 | 2,235 |
| 2020-21 | 3,658 | 511 | 201 | 310 | 3,147 | 1,192 | 1,955 |
| 2021-22 | 3,128 | 354 | 147 | 207 | 2,774 | 1,047 | 1,727 |
| 2022-23 | 3,027 | 435 | 190 | 245 | 2,592 | 1,034 | 1,558 |
| 2023-24 | 3,200 | 2,511 | 957 | 1,554 | 689 | 258 | 431 |
| Average | 4,443 | 4,443 | 338 | 518 | 4,443 | 1,414 | 2,173 |
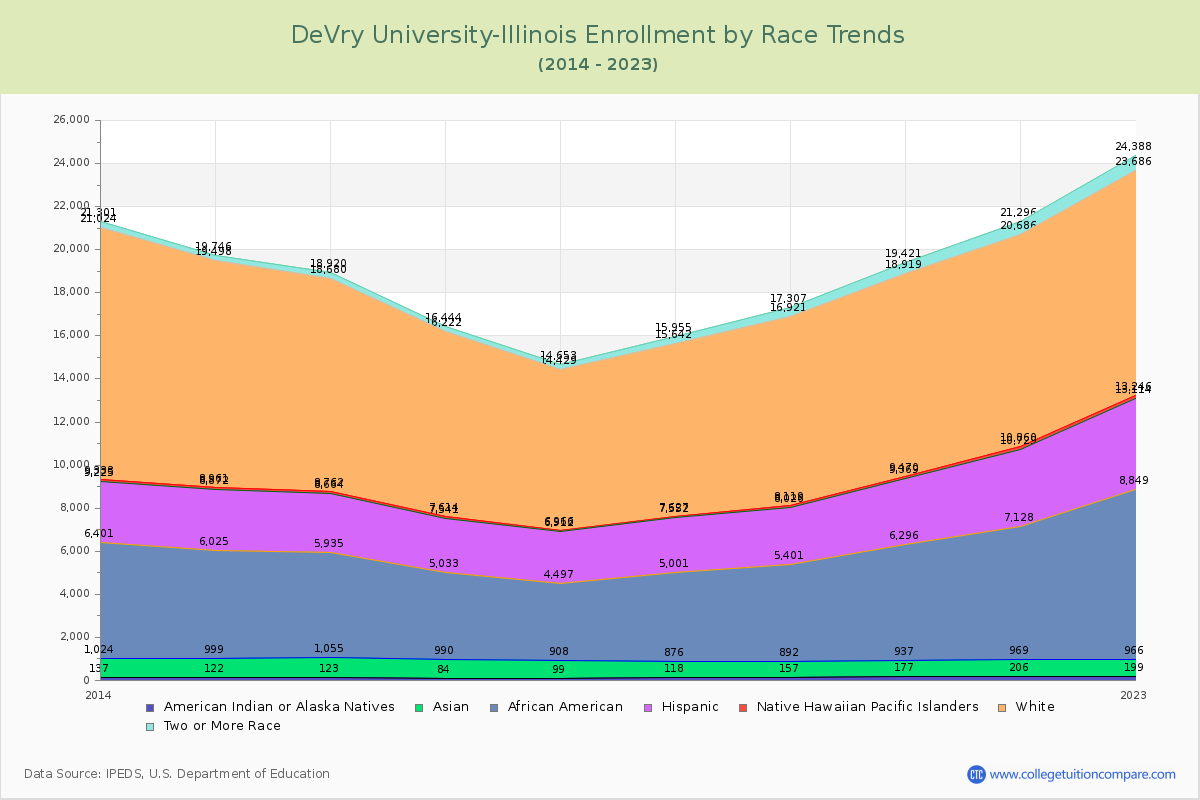
Enrollment by Race/Ethnicity Changes
The percentage of white students is 38.67% and the percentage of black students is 31.43% at DeVry University-Illinois. 2.51% of enrolled students is Asian.
The following table and chart illustrate the student population trends by race/ethnicity at DeVry University-Illinois over the past 12 years (2013-2024).
| Year | American Indian or Native American | Asian | Black | Hispanic | Native Hawaiian or Other Pacific Islander | White | Two or More Races |
|---|---|---|---|---|---|---|---|
| 2013-14 | 137 | 887 | 5,377 | 2,824 | 108 | 11,691 | 277 |
| 2014-15 | 122 | 877 | 5,026 | 2,847 | 89 | 10,537 | 248 |
| 2015-16 | 123 | 932 | 4,880 | 2,729 | 98 | 9,918 | 240 |
| 2016-17 | 84 | 906 | 4,043 | 2,508 | 73 | 8,608 | 222 |
| 2017-18 | 99 | 809 | 3,589 | 2,415 | 54 | 7,463 | 224 |
| 2018-19 | 118 | 758 | 4,125 | 2,551 | 75 | 8,015 | 313 |
| 2019-20 | 157 | 735 | 4,509 | 2,625 | 93 | 8,802 | 386 |
| 2020-21 | 177 | 760 | 5,359 | 3,073 | 101 | 9,449 | 502 |
| 2021-22 | 206 | 763 | 6,159 | 3,601 | 131 | 9,826 | 610 |
| 2022-23 | 199 | 767 | 7,883 | 4,265 | 132 | 10,440 | 702 |
| 2023-24 | 213 | 737 | 9,222 | 4,550 | 121 | 11,348 | 810 |
| Average | 149 | 812 | 5,470 | 3,090 | 98 | 9,645 | 412 |
Distance Learning (Online Courses) Enrollment Changes
28,245 students are enrolled in online degree programs exclusively for the academic year 2023-2024, which is 96% of total students. The number of online students has increased 41.46% since 2014. The following table and chart illustrate the changes in the online student population by enrolled type at DeVry University-Illinois from 2014 to 2024.
| Year | Total Enrollment | Online Completely | Enrolled in Some Online Courses | Not Enrolled in Online Courses |
|---|---|---|---|---|
| 2014-15 | 24,220 | 19,967 | 1,775 | 2,478 |
| 2015-16 | 22,273 | 18,588 | 1,870 | 1,815 |
| 2016-17 | 19,340 | 16,461 | 1,554 | 1,325 |
| 2017-18 | 16,964 | 14,896 | 1,223 | 845 |
| 2018-19 | 17,364 | 15,837 | 941 | 586 |
| 2019-20 | 18,195 | 17,086 | 711 | 398 |
| 2020-21 | 20,832 | 20,048 | 514 | 270 |
| 2021-22 | 22,994 | 22,261 | 476 | 257 |
| 2022-23 | 26,384 | 25,465 | 658 | 261 |
| 2023-24 | 29,346 | 28,245 | 840 | 261 |
| Average | 21,791 | 19,885 | 1,056 | 850 |
Ratings & Review
Share your experiences and thoughts about DeVry University-Illinois. It will be a great help to applicants and prospective students!