The student population at James Madison University is 22,758 (21,006 undergraduate and 1,752 graduate students) . The number of students has increased by 2,577 over the past decade.
The percentage of undergraduate students at JMU is 92.30% which is increased by 2,575 over last 10 years. The graduate student population increased by 2 and it has been increasing.
The female to male ratio is 1.36 to 1 which means that female students enrolled more than male students.
1,113 students enrolled in online degree program exclusively and the number of online students has increased by 196.01% since 2014.
Student Population Changes
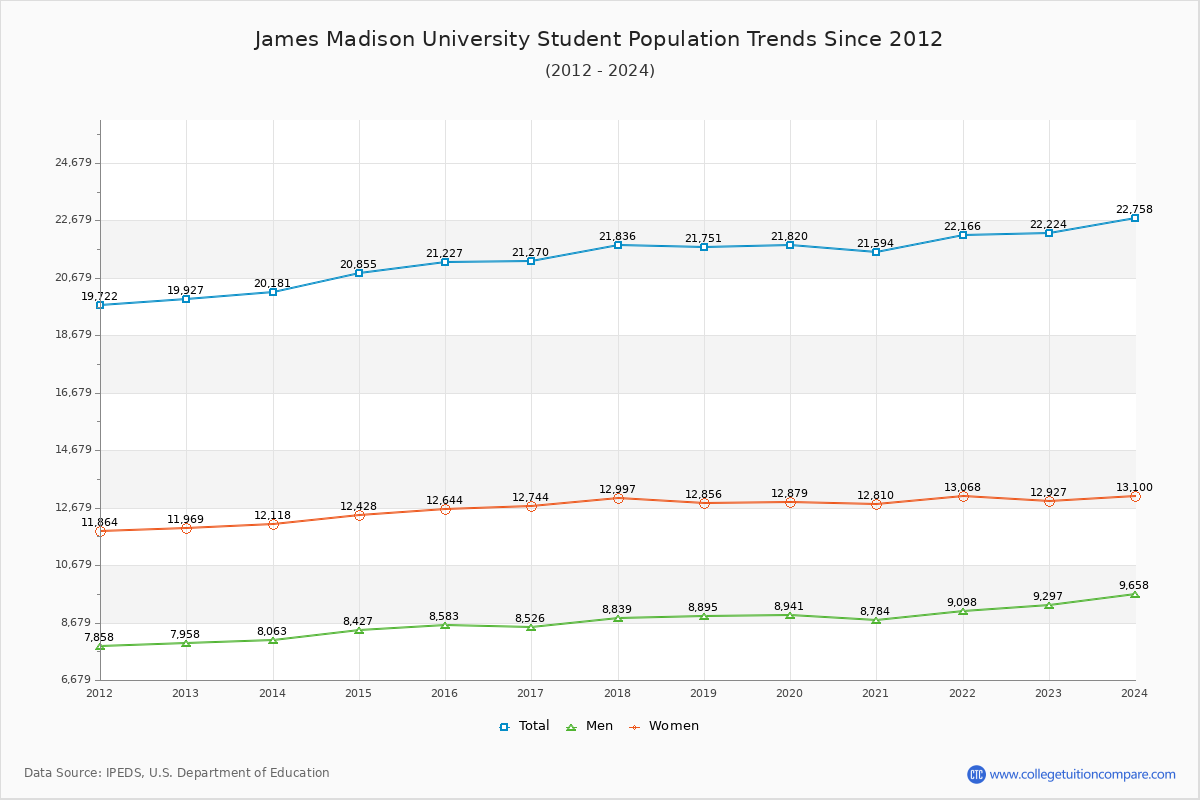
The average student population over the last 12 years is 21,607 where 22,758 students are attending the school for the academic year 2023-2024.
92.30% of total students is undergraduate students and 7.70% students is graduate students. The number of undergraduate students has increased by 2,575 and the graduate enrollment has increased by 2 over past 10 years.
The female to male ratio is 1.36 to 1 and it means that there are more female students enrolled in JMU than male students.
The following table and chart illustrate the changes in student population by gender at James Madison University since 2013.
| Year | Total | Undergraduate | Graduate | ||||
|---|---|---|---|---|---|---|---|
| Total | Men | Women | Total | Men | Women | ||
| 2013-14 | 20,181 | 18,431 | 7,526 | 10,905 | 1,750 | 537 | 1,213 |
| 2014-15 | 20,855 674 | 19,144 713 | 7,907 381 | 11,237 332 | 1,711 -39 | 520 -17 | 1,191 -22 |
| 2015-16 | 21,227 372 | 19,396 252 | 8,033 126 | 11,363 126 | 1,831 120 | 550 30 | 1,281 90 |
| 2016-17 | 21,270 43 | 19,548 152 | 8,013 -20 | 11,535 172 | 1,722 -109 | 513 -37 | 1,209 -72 |
| 2017-18 | 21,836 566 | 19,975 427 | 8,282 269 | 11,693 158 | 1,861 139 | 557 44 | 1,304 95 |
| 2018-19 | 21,751 -85 | 19,923 -52 | 8,347 65 | 11,576 -117 | 1,828 -33 | 548 -9 | 1,280 -24 |
| 2019-20 | 21,820 69 | 19,895 -28 | 8,406 59 | 11,489 -87 | 1,925 97 | 535 -13 | 1,390 110 |
| 2020-21 | 21,594 -226 | 19,727 -168 | 8,258 -148 | 11,469 -20 | 1,867 -58 | 526 -9 | 1,341 -49 |
| 2021-22 | 22,166 572 | 20,070 343 | 8,482 224 | 11,588 119 | 2,096 229 | 616 90 | 1,480 139 |
| 2022-23 | 22,224 58 | 20,346 276 | 8,741 259 | 11,605 17 | 1,878 -218 | 556 -60 | 1,322 -158 |
| 2023-24 | 22,758 534 | 21,006 660 | 9,108 367 | 11,898 293 | 1,752 -126 | 550 -6 | 1,202 -120 |
| Average | 21,607 | 19,769 | 8,282 | 11,487 | 1,838 | 546 | 1,292 |
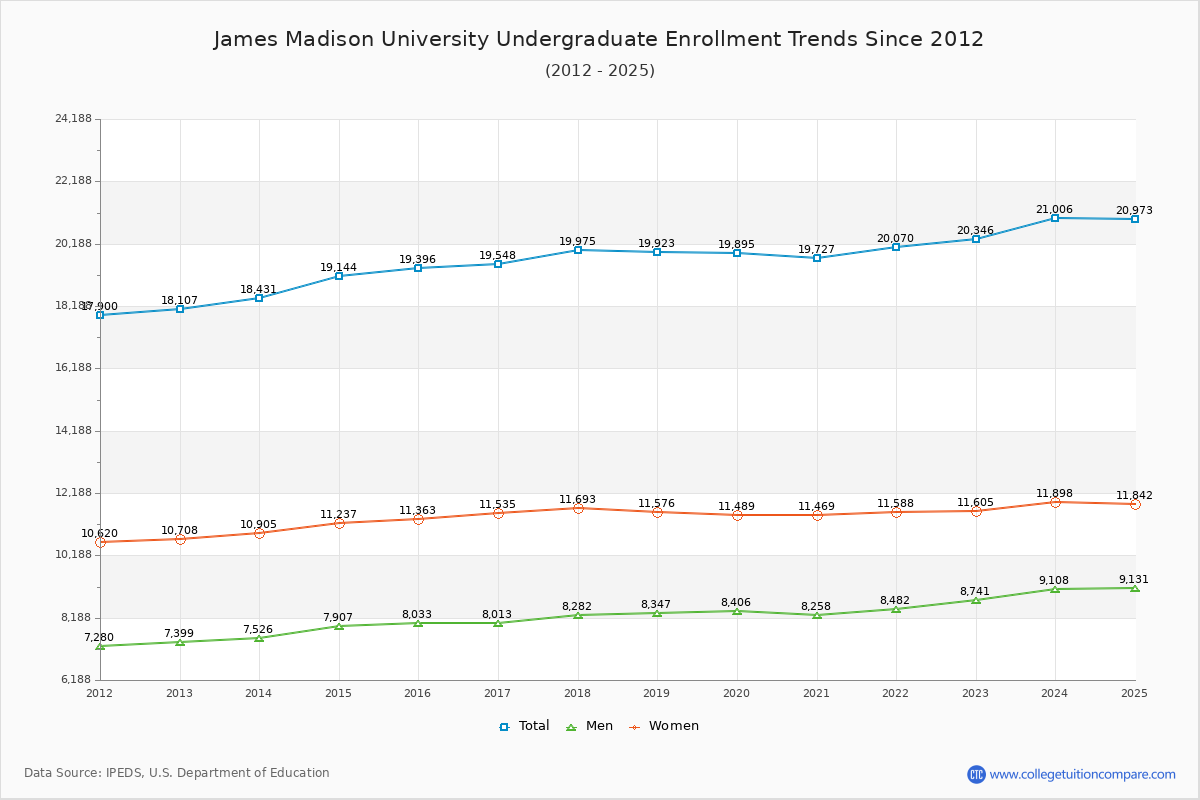
Undergraduate Enrollment Changes
The average number of Undergraduate students over the last 12 years is 19,769 where 21,006 students are attending the Undergraduate school for the academic year 2023-2024. The following table and chart illustrate the changes in Undergraduate enrollment by attending status and gender at James Madison University since 2013.
| Year | Total | Full-time | Part-time | ||||
|---|---|---|---|---|---|---|---|
| Total | Men | Women | Total | Men | Women | ||
| 2013-14 | 18,431 | 17,526 | 7,061 | 10,465 | 905 | 465 | 440 |
| 2014-15 | 19,144 | 18,057 | 7,297 | 10,760 | 1,087 | 610 | 477 |
| 2015-16 | 19,396 | 18,433 | 7,518 | 10,915 | 963 | 515 | 448 |
| 2016-17 | 19,548 | 18,554 | 7,499 | 11,055 | 994 | 514 | 480 |
| 2017-18 | 19,975 | 18,905 | 7,757 | 11,148 | 1,070 | 525 | 545 |
| 2018-19 | 19,923 | 18,881 | 7,831 | 11,050 | 1,042 | 516 | 526 |
| 2019-20 | 19,895 | 18,798 | 7,859 | 10,939 | 1,097 | 547 | 550 |
| 2020-21 | 19,727 | 18,420 | 7,626 | 10,794 | 1,307 | 632 | 675 |
| 2021-22 | 20,070 | 18,723 | 7,835 | 10,888 | 1,347 | 647 | 700 |
| 2022-23 | 20,346 | 18,937 | 8,080 | 10,857 | 1,409 | 661 | 748 |
| 2023-24 | 21,006 | 19,492 | 8,396 | 11,096 | 1,514 | 712 | 802 |
| Average | 19,769 | 19,769 | 7,705 | 10,906 | 19,769 | 577 | 581 |
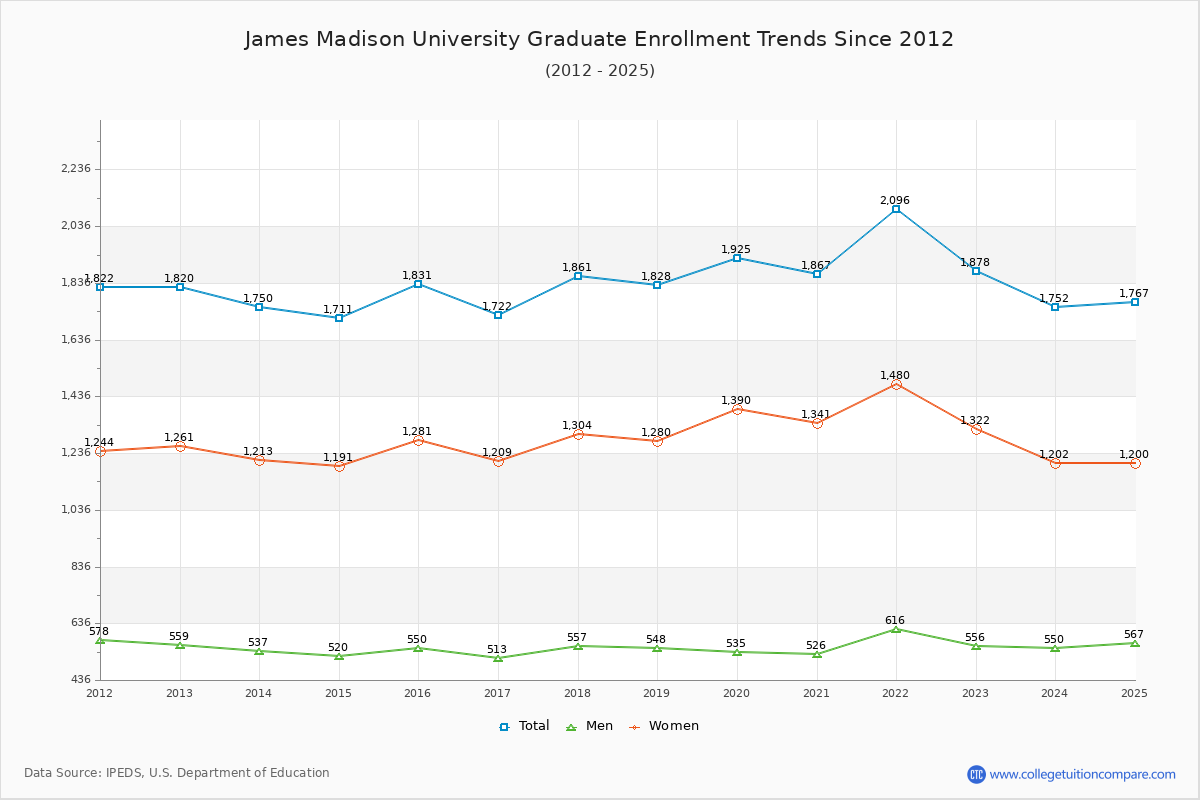
Graduate Enrollment Changes
The average number of Graduate students over the last 12 years is 1,838 where 1,752 students are attending the Graduate school for the academic year 2023-2024. The following table and chart illustrate the changes in Graduate enrollment by attending status and gender at James Madison University since 2013.
| Year | Total | Full-time | Part-time | ||||
|---|---|---|---|---|---|---|---|
| Total | Men | Women | Total | Men | Women | ||
| 2013-14 | 1,750 | 1,100 | 304 | 796 | 650 | 233 | 417 |
| 2014-15 | 1,711 | 1,066 | 289 | 777 | 645 | 231 | 414 |
| 2015-16 | 1,831 | 1,113 | 302 | 811 | 718 | 248 | 470 |
| 2016-17 | 1,722 | 1,043 | 294 | 749 | 679 | 219 | 460 |
| 2017-18 | 1,861 | 1,020 | 288 | 732 | 841 | 269 | 572 |
| 2018-19 | 1,828 | 1,033 | 289 | 744 | 795 | 259 | 536 |
| 2019-20 | 1,925 | 1,048 | 273 | 775 | 877 | 262 | 615 |
| 2020-21 | 1,867 | 1,094 | 282 | 812 | 773 | 244 | 529 |
| 2021-22 | 2,096 | 1,115 | 298 | 817 | 981 | 318 | 663 |
| 2022-23 | 1,878 | 1,047 | 288 | 759 | 831 | 268 | 563 |
| 2023-24 | 1,752 | 917 | 274 | 643 | 835 | 276 | 559 |
| Average | 1,838 | 1,838 | 289 | 765 | 1,838 | 257 | 527 |
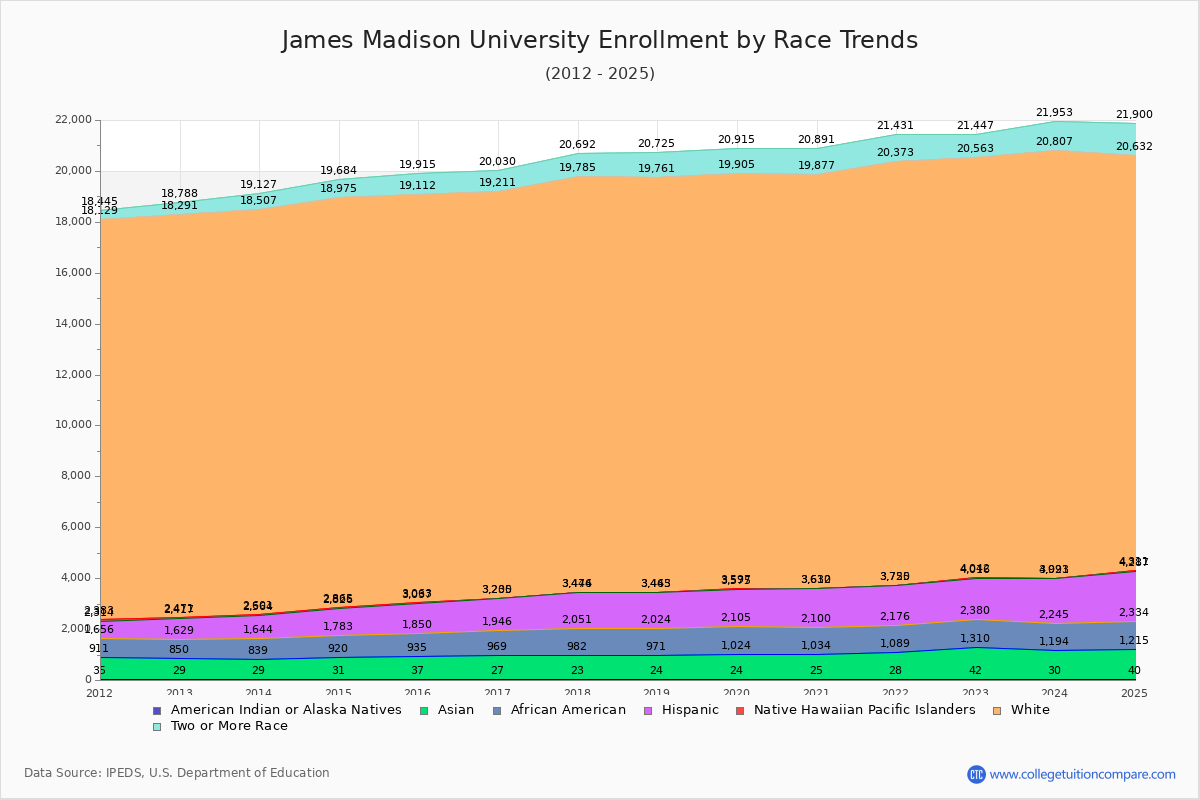
Enrollment by Race/Ethnicity Changes
The percentage of white students is 73.76%. The percentage was 78.82% 10 years ago and JMU still has a high percentage of white students. 5.11% of enrolled students is Asian and 4.62% is black students.
The following table and chart illustrate the student population trends by race/ethnicity at James Madison University over the past 12 years (2013-2024).
| Year | American Indian or Native American | Asian | Black | Hispanic | Native Hawaiian or Other Pacific Islander | White | Two or More Races |
|---|---|---|---|---|---|---|---|
| 2013-14 | 29 | 810 | 805 | 920 | 37 | 15,906 | 620 |
| 2014-15 | 31 | 889 | 863 | 1,043 | 39 | 16,110 | 709 |
| 2015-16 | 37 | 898 | 915 | 1,187 | 26 | 16,049 | 803 |
| 2016-17 | 27 | 942 | 977 | 1,259 | 25 | 15,981 | 819 |
| 2017-18 | 23 | 959 | 1,069 | 1,395 | 28 | 16,311 | 907 |
| 2018-19 | 24 | 947 | 1,053 | 1,419 | 22 | 16,296 | 964 |
| 2019-20 | 24 | 1,000 | 1,081 | 1,470 | 22 | 16,308 | 1,010 |
| 2020-21 | 25 | 1,009 | 1,066 | 1,510 | 22 | 16,245 | 1,014 |
| 2021-22 | 28 | 1,061 | 1,087 | 1,549 | 25 | 16,623 | 1,058 |
| 2022-23 | 42 | 1,268 | 1,070 | 1,636 | 26 | 16,521 | 884 |
| 2023-24 | 30 | 1,164 | 1,051 | 1,748 | 28 | 16,786 | 1,146 |
| Average | 29 | 995 | 1,003 | 1,376 | 27 | 16,285 | 903 |
Distance Learning (Online Courses) Enrollment Changes
1,113 students are enrolled in online degree programs exclusively for the academic year 2023-2024, which is 5% of total students. The number of online students has increased 196.01% since 2014. The following table and chart illustrate the changes in the online student population by enrolled type at James Madison University from 2014 to 2024.
| Year | Total Enrollment | Online Completely | Enrolled in Some Online Courses | Not Enrolled in Online Courses |
|---|---|---|---|---|
| 2014-15 | 20,855 | 376 | 1,941 | 18,538 |
| 2015-16 | 21,227 | 389 | 2,017 | 18,821 |
| 2016-17 | 21,270 | 416 | 1,878 | 18,976 |
| 2017-18 | 21,836 | 591 | 18,000 | 3,245 |
| 2018-19 | 21,751 | 545 | 1,087 | 20,119 |
| 2019-20 | 21,820 | 689 | 1,143 | 19,988 |
| 2020-21 | 21,594 | 4,653 | 15,979 | 962 |
| 2021-22 | 22,166 | 1,103 | 6,740 | 14,323 |
| 2022-23 | 22,224 | 1,036 | 5,689 | 15,499 |
| 2023-24 | 22,758 | 1,113 | 6,086 | 15,559 |
| Average | 21,750 | 1,091 | 6,056 | 14,603 |
Ratings & Review
Share your experiences and thoughts about James Madison University. It will be a great help to applicants and prospective students!