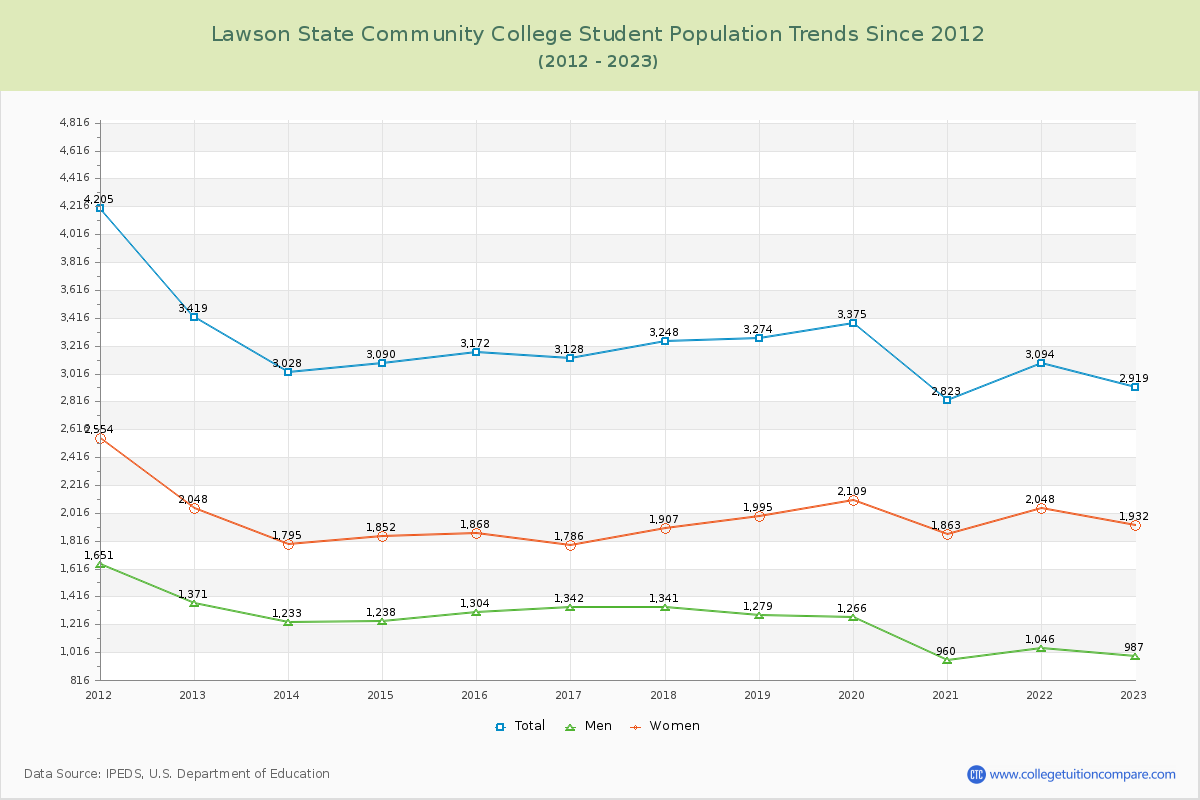
The student population at Lawson State Community College is 2,919 (all undergraduate). The number of students has decreased by 109 over the past decade.
The female to male ratio is 1.96 to 1 which means that female students enrolled more than male students.
604 students enrolled in online degree program exclusively and the number of online students has increased by 284.71% since 2014.
Student Population Changes
The average student population over the last 11 years is 3,115 where 2,919 students are attending the school for the academic year 2022-2023.
The female to male ratio is 1.96 to 1 and it means that there are more female students enrolled in Lawson State CC than male students.
The following table and chart illustrate the changes in student population by gender at Lawson State Community College since 2013.
| Year | Total | Men | Women |
|---|---|---|---|
| 2013-14 | 3,028 | 1,233 | 1,795 |
| 2014-15 | 3,090 62 | 1,238 5 | 1,852 57 |
| 2015-16 | 3,172 82 | 1,304 66 | 1,868 16 |
| 2016-17 | 3,128 -44 | 1,342 38 | 1,786 -82 |
| 2017-18 | 3,248 120 | 1,341 -1 | 1,907 121 |
| 2018-19 | 3,274 26 | 1,279 -62 | 1,995 88 |
| 2019-20 | 3,375 101 | 1,266 -13 | 2,109 114 |
| 2020-21 | 2,823 -552 | 960 -306 | 1,863 -246 |
| 2021-22 | 3,094 271 | 1,046 86 | 2,048 185 |
| 2022-23 | 2,919 -175 | 987 -59 | 1,932 -116 |
| Average | 3,115 | 1,200 | 1,916 |

Enrollment by Race/Ethnicity Changes
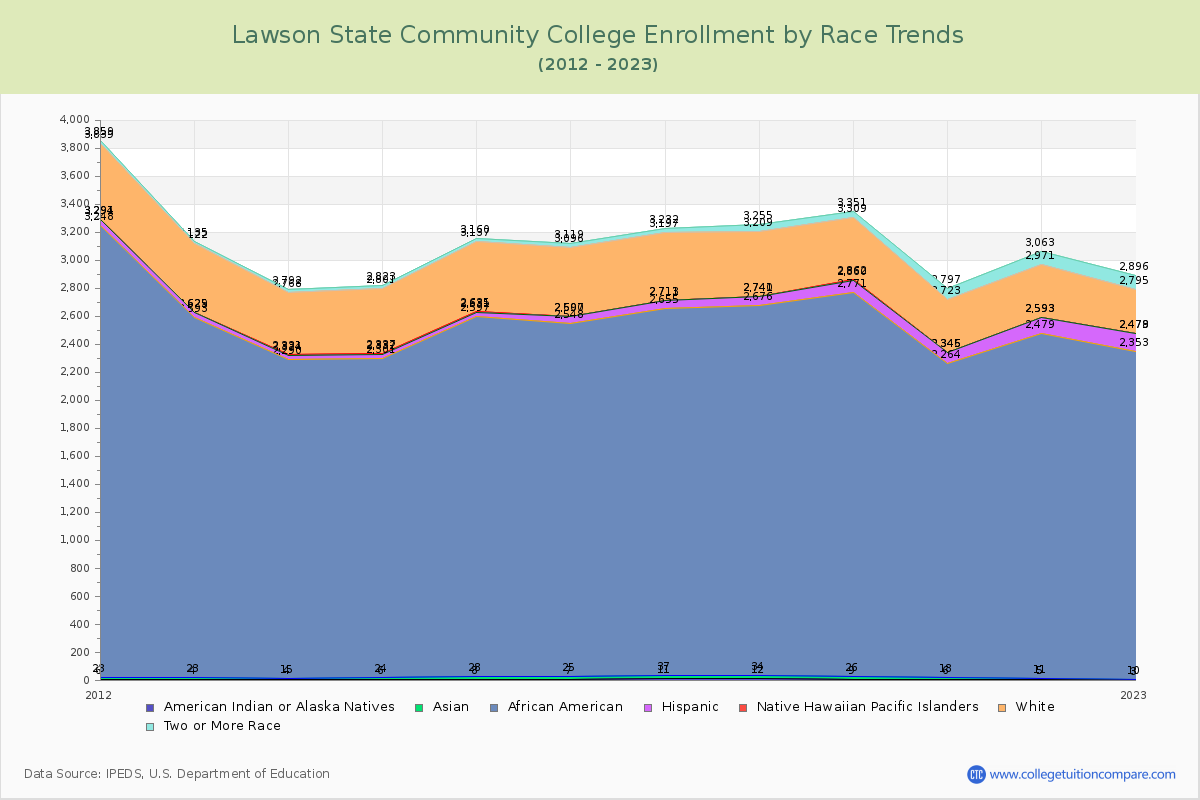
The percentage of white students is 10.83% and the percentage of black students is 80.27% at Lawson State Community College. 0.24% of enrolled students is Asian.
The following table and chart illustrate the student population trends by race/ethnicity at Lawson State Community College over the past 11 years (2013-2023).
| Year | American Indian or Native American | Asian | Black | Hispanic | Native Hawaiian or Other Pacific Islander | White | Two or More Races |
|---|---|---|---|---|---|---|---|
| 2013-14 | 4 | 11 | 2,275 | 34 | 7 | 437 | 24 |
| 2014-15 | 6 | 18 | 2,277 | 31 | 5 | 464 | 22 |
| 2015-16 | 8 | 20 | 2,569 | 34 | 4 | 502 | 23 |
| 2016-17 | 7 | 18 | 2,523 | 49 | 3 | 496 | 23 |
| 2017-18 | 11 | 26 | 2,618 | 56 | 2 | 484 | 35 |
| 2018-19 | 12 | 22 | 2,642 | 64 | 1 | 468 | 46 |
| 2019-20 | 9 | 17 | 2,745 | 89 | 2 | 447 | 42 |
| 2020-21 | 6 | 12 | 2,246 | 81 | 1 | 377 | 74 |
| 2021-22 | 5 | 6 | 2,468 | 114 | 0 | 378 | 92 |
| 2022-23 | 3 | 7 | 2,343 | 125 | 1 | 316 | 101 |
| Average | 7 | 16 | 2,471 | 68 | 3 | 437 | 48 |

Distance Learning (Online Courses) Enrollment Changes
604 students are enrolled in online degree programs exclusively for the academic year 2022-2023, which is 21% of total students. The number of online students has increased 284.71% since 2014. The following table and chart illustrate the changes in the online student population by enrolled type at Lawson State Community College from 2014 to 2023.
| Year | Total Enrollment | Online Completely | Enrolled in Some Online Courses | Not Enrolled in Online Courses |
|---|---|---|---|---|
| 2014-15 | 3,090 | 157 | 560 | 2,373 |
| 2015-16 | 3,172 | 226 | 549 | 2,397 |
| 2016-17 | 3,128 | 214 | 514 | 2,400 |
| 2017-18 | 3,248 | 229 | 661 | 2,358 |
| 2018-19 | 3,274 | 167 | 504 | 2,603 |
| 2019-20 | 3,375 | 257 | 642 | 2,476 |
| 2020-21 | 2,823 | 2,065 | 334 | 424 |
| 2021-22 | 3,094 | 1,518 | 899 | 677 |
| 2022-23 | 2,919 | 604 | 995 | 1,320 |
| Average | 3,125 | 604 | 629 | 1,892 |
Ratings & Review
Share your experiences and thoughts about Lawson State Community College. It will be a great help to applicants and prospective students!