The student population at Loyola University Chicago is 17,397 (12,487 undergraduate and 4,910 graduate students) . The number of students has increased by 1,440 over the past decade.
The percentage of undergraduate students at Loyola University Chicago is 71.78% which is increased by 2,319 over last 10 years. The graduate student population decreased by 879 and it has been decreasing.
The female to male ratio is 2.20 to 1 which means that majority of population is on female students.
1,359 students enrolled in online degree program exclusively and the number of online students has increased by 46.92% since 2014.
Student Population Changes
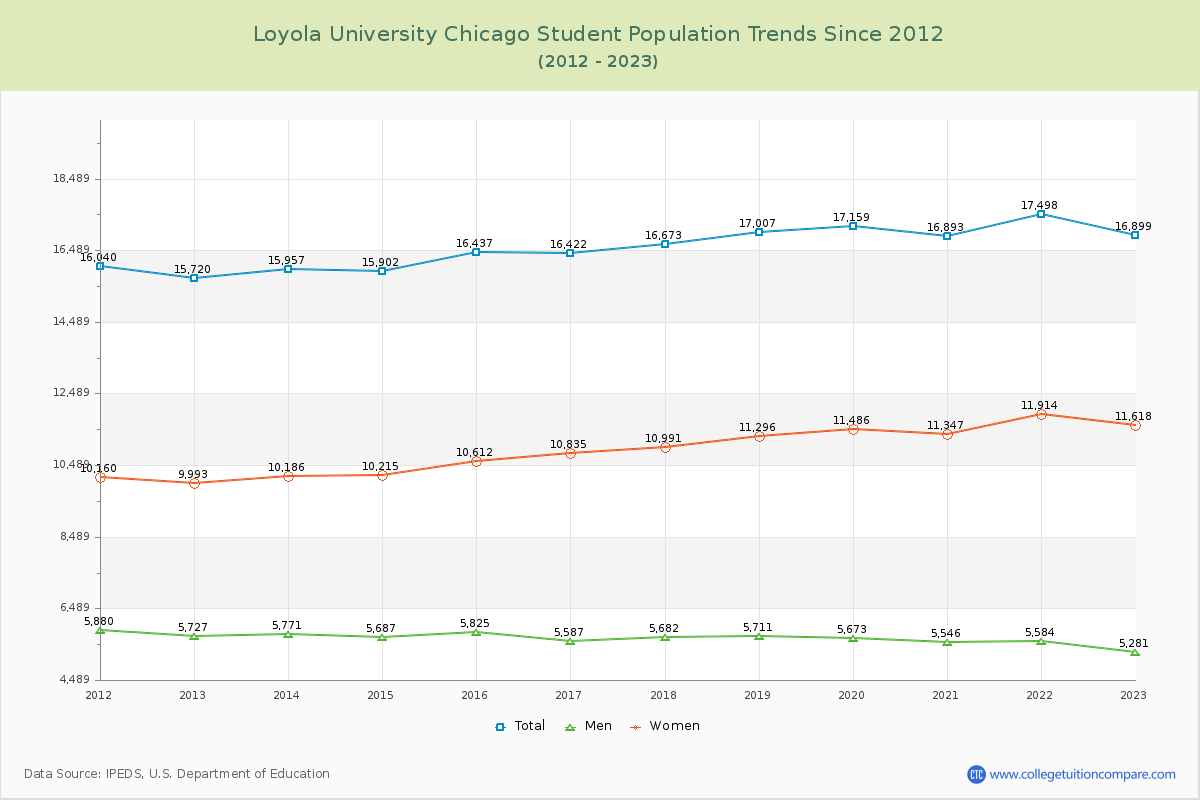
The average student population over the last 12 years is 16,749 where 17,397 students are attending the school for the academic year 2023-2024.
71.78% of total students is undergraduate students and 28.22% students is graduate students. The number of undergraduate students has increased by 2,319 and the graduate enrollment has decreased by 879 over past 10 years.
The female to male ratio is 2.20 to 1 and it means that there are far more female students enrolled in Loyola University Chicago than male students.
The following table and chart illustrate the changes in student population by gender at Loyola University Chicago since 2013.
| Year | Total | Undergraduate | Graduate | ||||
|---|---|---|---|---|---|---|---|
| Total | Men | Women | Total | Men | Women | ||
| 2013-14 | 15,957 | 10,168 | 3,688 | 6,480 | 5,789 | 2,083 | 3,706 |
| 2014-15 | 15,902 -55 | 10,322 154 | 3,665 -23 | 6,657 177 | 5,580 -209 | 2,022 -61 | 3,558 -148 |
| 2015-16 | 16,437 535 | 11,079 757 | 3,889 224 | 7,190 533 | 5,358 -222 | 1,936 -86 | 3,422 -136 |
| 2016-17 | 16,422 -15 | 11,129 50 | 3,764 -125 | 7,365 175 | 5,293 -65 | 1,823 -113 | 3,470 48 |
| 2017-18 | 16,673 251 | 11,420 291 | 3,856 92 | 7,564 199 | 5,253 -40 | 1,826 3 | 3,427 -43 |
| 2018-19 | 17,007 334 | 11,919 499 | 3,992 136 | 7,927 363 | 5,088 -165 | 1,719 -107 | 3,369 -58 |
| 2019-20 | 17,159 152 | 12,240 321 | 4,039 47 | 8,201 274 | 4,919 -169 | 1,634 -85 | 3,285 -84 |
| 2020-21 | 16,893 -266 | 11,612 -628 | 3,800 -239 | 7,812 -389 | 5,281 362 | 1,746 112 | 3,535 250 |
| 2021-22 | 17,498 605 | 11,819 207 | 3,763 -37 | 8,056 244 | 5,679 398 | 1,821 75 | 3,858 323 |
| 2022-23 | 16,899 -599 | 11,703 -116 | 3,649 -114 | 8,054 -2 | 5,196 -483 | 1,632 -189 | 3,564 -294 |
| 2023-24 | 17,397 498 | 12,487 784 | 3,955 306 | 8,532 478 | 4,910 -286 | 1,490 -142 | 3,420 -144 |
| Average | 16,749 | 11,445 | 3,824 | 7,622 | 5,304 | 1,794 | 3,510 |
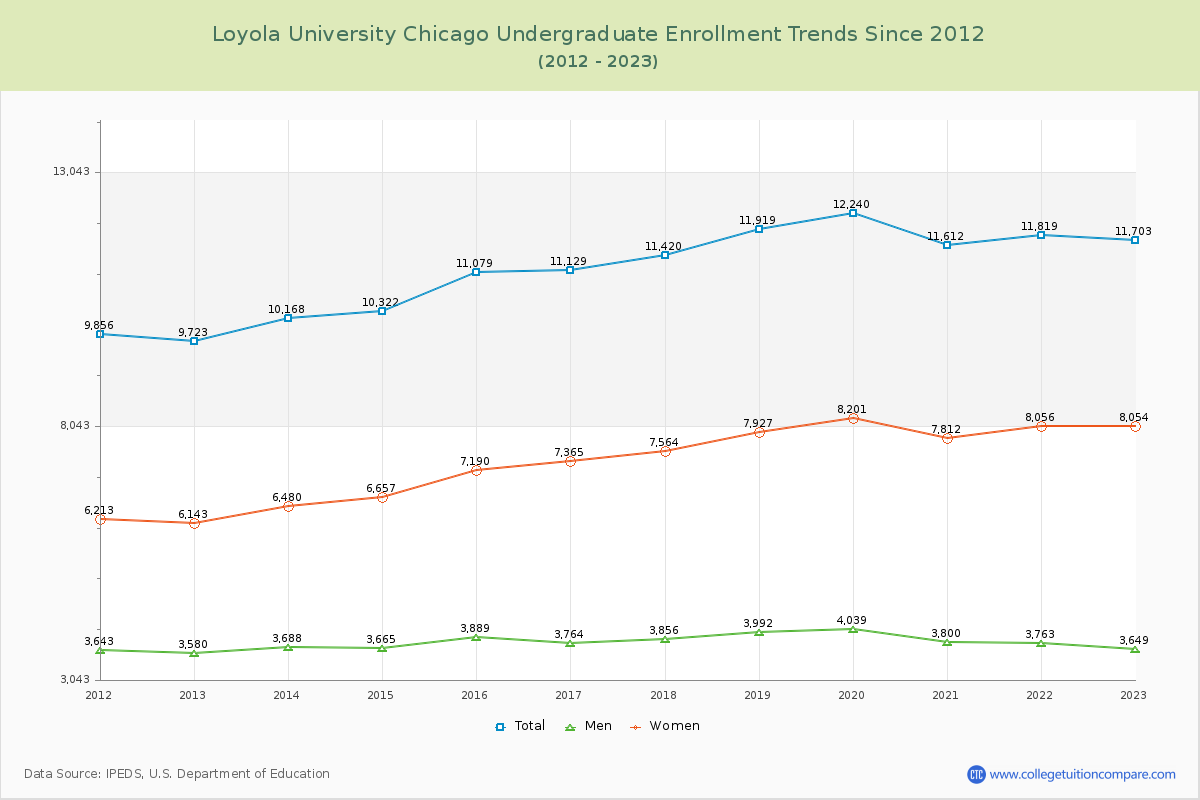
Undergraduate Enrollment Changes
The average number of Undergraduate students over the last 12 years is 11,445 where 12,487 students are attending the Undergraduate school for the academic year 2023-2024. The following table and chart illustrate the changes in Undergraduate enrollment by attending status and gender at Loyola University Chicago since 2013.
| Year | Total | Full-time | Part-time | ||||
|---|---|---|---|---|---|---|---|
| Total | Men | Women | Total | Men | Women | ||
| 2013-14 | 10,168 | 9,339 | 3,345 | 5,994 | 829 | 343 | 486 |
| 2014-15 | 10,322 | 9,331 | 3,275 | 6,056 | 991 | 390 | 601 |
| 2015-16 | 11,079 | 9,774 | 3,409 | 6,365 | 1,305 | 480 | 825 |
| 2016-17 | 11,129 | 10,362 | 3,503 | 6,859 | 767 | 261 | 506 |
| 2017-18 | 11,420 | 10,681 | 3,591 | 7,090 | 739 | 265 | 474 |
| 2018-19 | 11,919 | 11,189 | 3,724 | 7,465 | 730 | 268 | 462 |
| 2019-20 | 12,240 | 11,622 | 3,804 | 7,818 | 618 | 235 | 383 |
| 2020-21 | 11,612 | 10,924 | 3,535 | 7,389 | 688 | 265 | 423 |
| 2021-22 | 11,819 | 11,205 | 3,551 | 7,654 | 614 | 212 | 402 |
| 2022-23 | 11,703 | 11,174 | 3,459 | 7,715 | 529 | 190 | 339 |
| 2023-24 | 12,487 | 11,166 | 3,459 | 7,707 | 1,321 | 496 | 825 |
| Average | 11,445 | 11,445 | 3,514 | 7,101 | 11,445 | 310 | 521 |
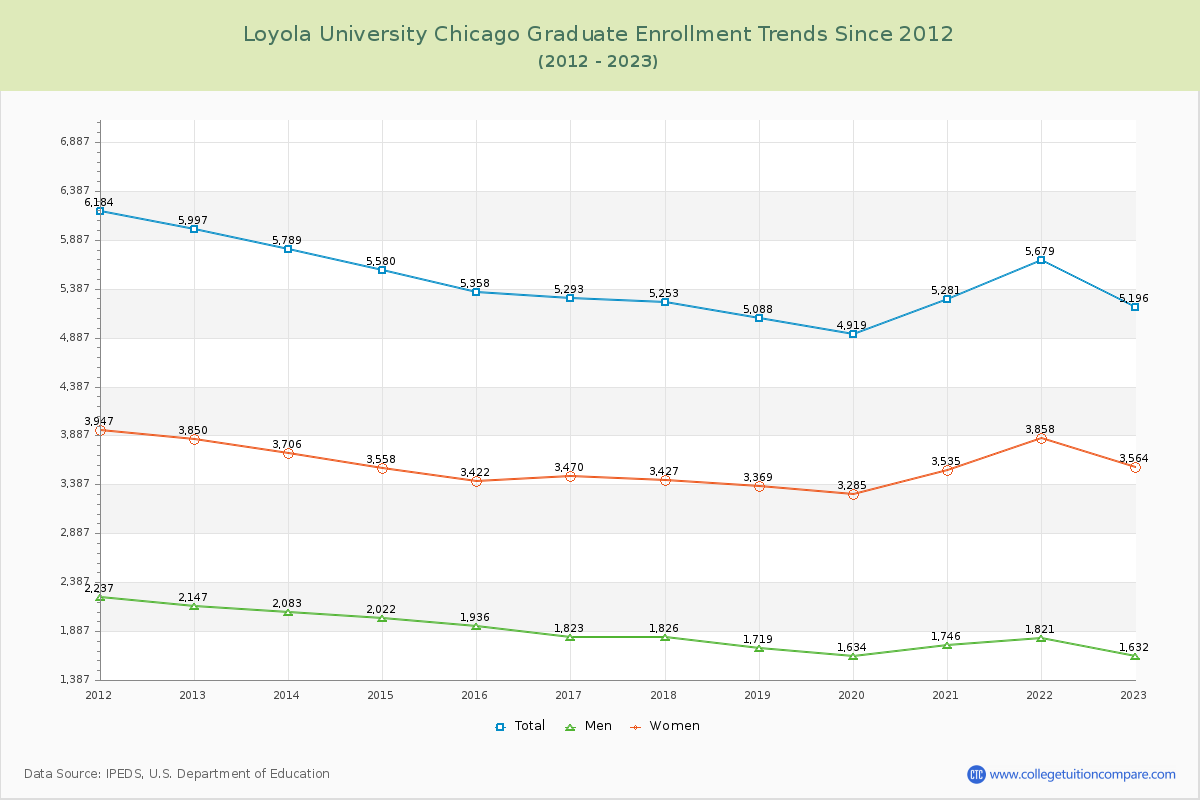
Graduate Enrollment Changes
The average number of Graduate students over the last 12 years is 5,304 where 4,910 students are attending the Graduate school for the academic year 2023-2024. The following table and chart illustrate the changes in Graduate enrollment by attending status and gender at Loyola University Chicago since 2013.
| Year | Total | Full-time | Part-time | ||||
|---|---|---|---|---|---|---|---|
| Total | Men | Women | Total | Men | Women | ||
| 2013-14 | 5,789 | 4,124 | 1,650 | 2,474 | 1,665 | 433 | 1,232 |
| 2014-15 | 5,580 | 4,100 | 1,593 | 2,507 | 1,480 | 429 | 1,051 |
| 2015-16 | 5,358 | 3,959 | 1,561 | 2,398 | 1,399 | 375 | 1,024 |
| 2016-17 | 5,293 | 3,924 | 1,447 | 2,477 | 1,369 | 376 | 993 |
| 2017-18 | 5,253 | 3,919 | 1,456 | 2,463 | 1,334 | 370 | 964 |
| 2018-19 | 5,088 | 3,808 | 1,352 | 2,456 | 1,280 | 367 | 913 |
| 2019-20 | 4,919 | 3,697 | 1,287 | 2,410 | 1,222 | 347 | 875 |
| 2020-21 | 5,281 | 4,029 | 1,395 | 2,634 | 1,252 | 351 | 901 |
| 2021-22 | 5,679 | 4,172 | 1,433 | 2,739 | 1,507 | 388 | 1,119 |
| 2022-23 | 5,196 | 3,923 | 1,294 | 2,629 | 1,273 | 338 | 935 |
| 2023-24 | 4,910 | 3,807 | 1,216 | 2,591 | 1,103 | 274 | 829 |
| Average | 5,304 | 5,304 | 1,426 | 2,525 | 5,304 | 368 | 985 |
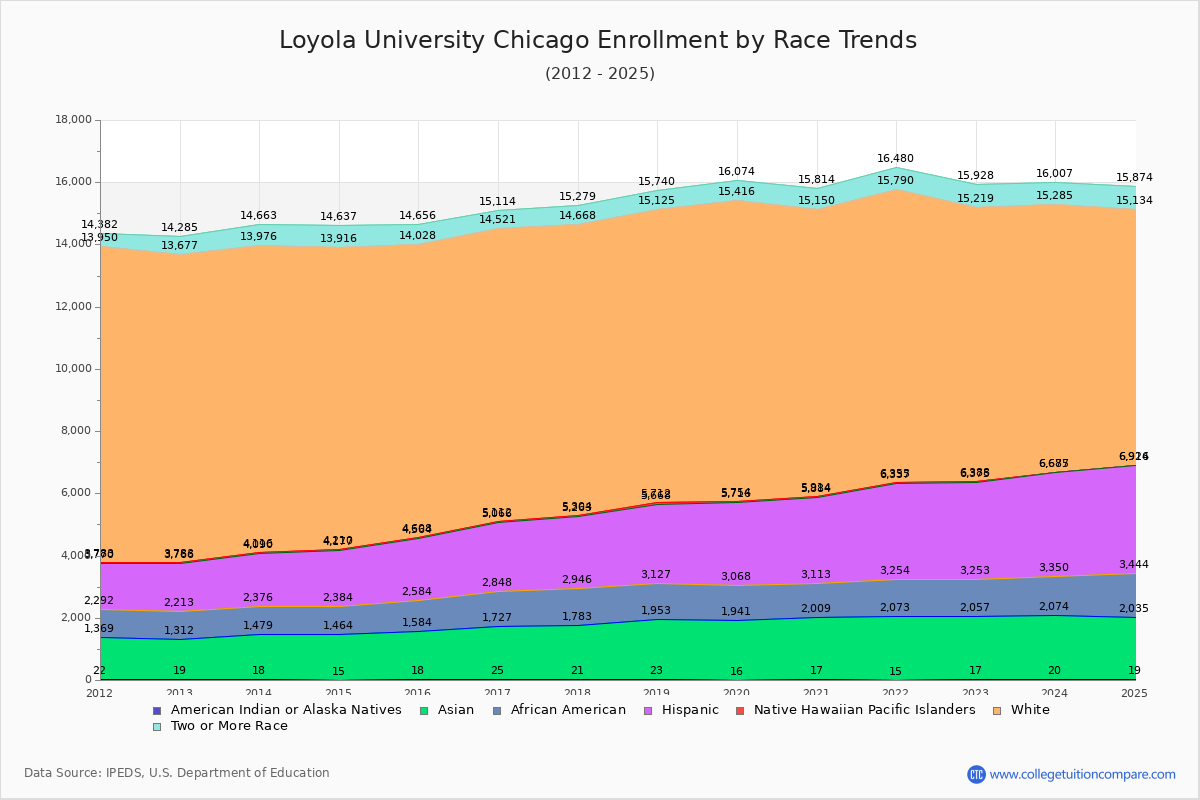
Enrollment by Race/Ethnicity Changes
The percentage of white students is 49.42% and the percentage of black students is 7.33% at Loyola University Chicago. 11.81% of enrolled students is Asian.
The following table and chart illustrate the student population trends by race/ethnicity at Loyola University Chicago over the past 12 years (2013-2024).
| Year | American Indian or Native American | Asian | Black | Hispanic | Native Hawaiian or Other Pacific Islander | White | Two or More Races |
|---|---|---|---|---|---|---|---|
| 2013-14 | 18 | 1,461 | 897 | 1,714 | 26 | 9,860 | 687 |
| 2014-15 | 15 | 1,449 | 920 | 1,793 | 33 | 9,706 | 721 |
| 2015-16 | 18 | 1,566 | 1,000 | 1,980 | 44 | 9,420 | 628 |
| 2016-17 | 25 | 1,702 | 1,121 | 2,218 | 46 | 9,409 | 593 |
| 2017-18 | 21 | 1,762 | 1,163 | 2,317 | 41 | 9,364 | 611 |
| 2018-19 | 23 | 1,930 | 1,174 | 2,541 | 44 | 9,413 | 615 |
| 2019-20 | 16 | 1,925 | 1,127 | 2,648 | 38 | 9,662 | 658 |
| 2020-21 | 17 | 1,992 | 1,104 | 2,771 | 30 | 9,236 | 664 |
| 2021-22 | 15 | 2,058 | 1,181 | 3,083 | 18 | 9,435 | 690 |
| 2022-23 | 17 | 2,040 | 1,196 | 3,122 | 13 | 8,831 | 709 |
| 2023-24 | 20 | 2,054 | 1,276 | 3,325 | 12 | 8,598 | 722 |
| Average | 19 | 1,813 | 1,105 | 2,501 | 31 | 9,358 | 663 |
Distance Learning (Online Courses) Enrollment Changes
1,359 students are enrolled in online degree programs exclusively for the academic year 2023-2024, which is 8% of total students. The number of online students has increased 46.92% since 2014. The following table and chart illustrate the changes in the online student population by enrolled type at Loyola University Chicago from 2014 to 2024.
| Year | Total Enrollment | Online Completely | Enrolled in Some Online Courses | Not Enrolled in Online Courses |
|---|---|---|---|---|
| 2014-15 | 15,902 | 925 | 712 | 14,265 |
| 2015-16 | 16,437 | 986 | 755 | 14,696 |
| 2016-17 | 16,422 | 972 | 978 | 14,472 |
| 2017-18 | 16,673 | 1,043 | 1,040 | 14,590 |
| 2018-19 | 17,007 | 1,136 | 1,022 | 14,849 |
| 2019-20 | 17,159 | 1,175 | 1,346 | 14,638 |
| 2020-21 | 16,893 | 15,143 | 999 | 751 |
| 2021-22 | 17,498 | 2,831 | 5,319 | 9,348 |
| 2022-23 | 16,899 | 2,215 | 3,269 | 11,415 |
| 2023-24 | 17,397 | 1,359 | 2,846 | 13,192 |
| Average | 16,829 | 2,779 | 1,829 | 12,222 |
Ratings & Review
Share your experiences and thoughts about Loyola University Chicago. It will be a great help to applicants and prospective students!