At Maine Maritime Academy, the average acceptance rate over the past 11 years is 63.07%, and 2024's acceptance rate is 61.40%.
The average yield (enrollment rate) over the period is 37.52%, and the 2024 yield is 32.72%.
The number of Maine Maritime Academy applicants decreased by -1.63% (19 applicants) compared to the previous year.
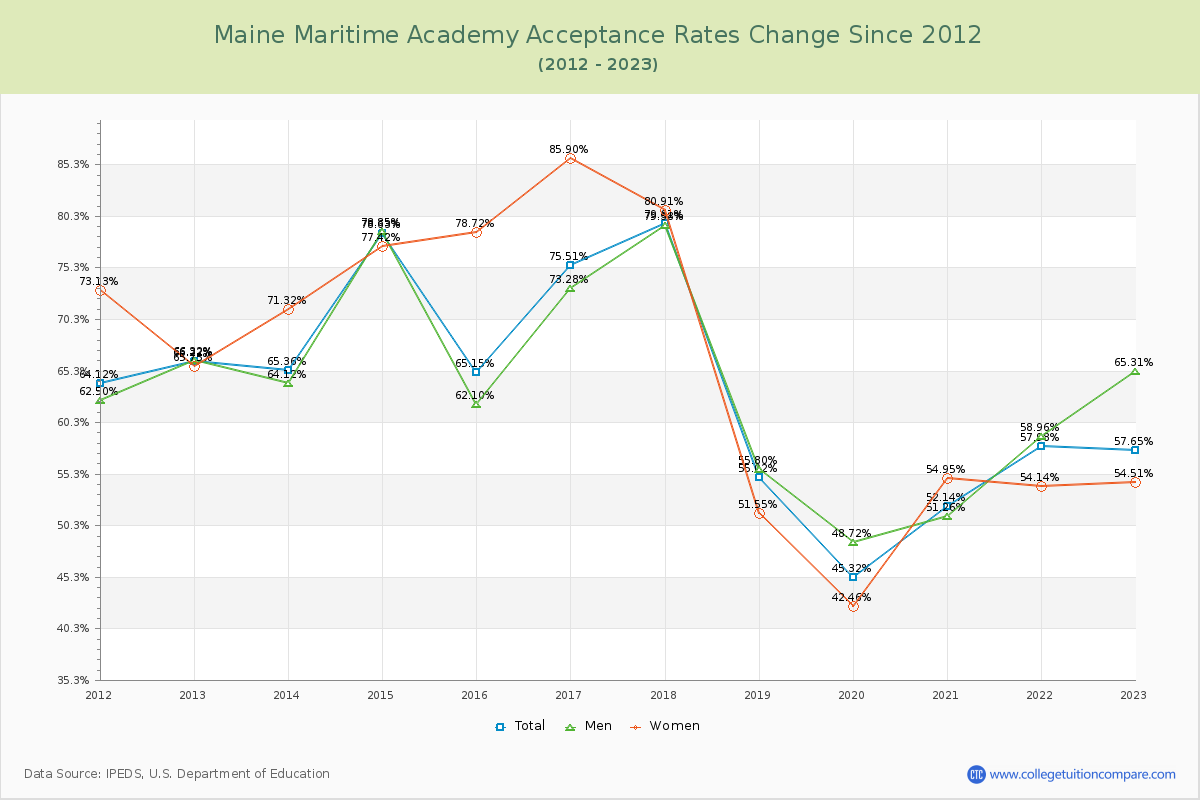
Acceptance Rate Changes
The average acceptance rate over the last 10 years is 63.07%, and this year's acceptance rate is 61.40% at Maine Maritime Academy. By gender, men students' acceptance rate is 63.96% and women students' rate is 64.25%.
The following table and chart illustrate the acceptance rates changes at Maine Maritime Academy over the past 11 years (2013-2024).
| Year | Total | Men | Women |
|---|---|---|---|
| 2013-14 | 65.36% | 64.12% | 71.32% |
| 2014-15 | 78.63% 13.27% |
78.85% 14.73% |
77.42% 6.10% |
| 2015-16 | 65.15% -13.48% |
62.10% -16.75% |
78.72% 1.30% |
| 2016-17 | 75.51% 10.36% |
73.28% 11.18% |
85.90% 7.17% |
| 2017-18 | 79.61% 4.10% |
79.38% 6.11% |
80.91% -4.99% |
| 2018-19 | 55.02% -24.59% |
55.80% -23.58% |
51.55% -29.36% |
| 2019-20 | 45.32% -9.70% |
48.72% -7.08% |
42.46% -9.09% |
| 2020-21 | 52.14% 6.82% |
51.26% 2.54% |
54.95% 12.49% |
| 2021-22 | 57.98% 5.84% |
58.96% 7.70% |
54.14% -0.81% |
| 2022-23 | 57.65% -0.33% |
65.31% 6.36% |
54.51% 0.38% |
| 2023-24 | 61.40% 3.75% |
65.76% 0.45% |
54.92% 0.41% |
| Average | 63.07% | 63.96% | 64.25% |
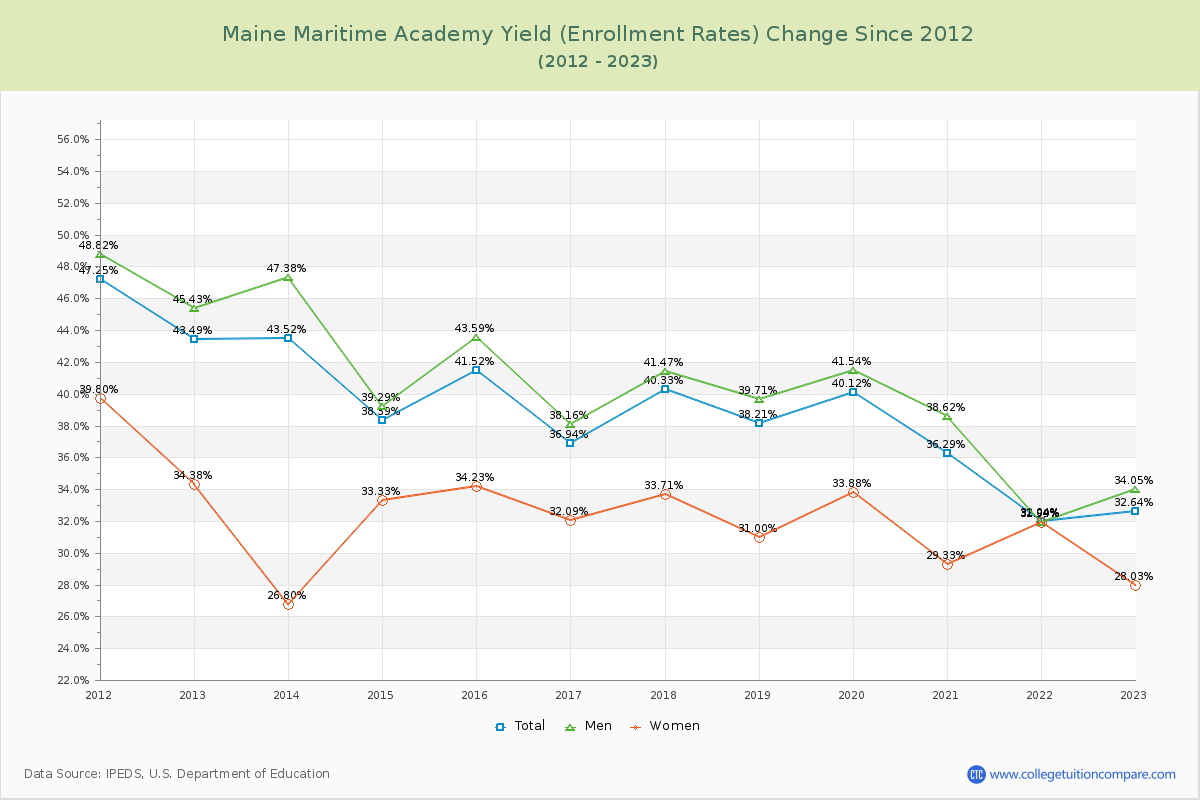
Admission Yield (Enrollment Rate) Changes
The average admission yield of the last 11 years is 37.52% where the current academic year yield is 32.72%.
The following table and chart illustrate the changes in yield at Maine Maritime Academy from 2013 to 2024.
| Year | Total | Men | Women |
|---|---|---|---|
| 2013-14 | 43.52% | 47.38% | 26.80% |
| 2014-15 | 38.39% -5.13% |
39.29% -8.09% |
33.33% 6.53% |
| 2015-16 | 41.52% 3.13% |
43.59% 4.30% |
34.23% 0.90% |
| 2016-17 | 36.94% -4.58% |
38.16% -5.43% |
32.09% -2.14% |
| 2017-18 | 40.33% 3.39% |
41.47% 3.32% |
33.71% 1.62% |
| 2018-19 | 38.21% -2.12% |
39.71% -1.76% |
31.00% -2.71% |
| 2019-20 | 40.12% 1.91% |
41.54% 1.83% |
33.88% 2.88% |
| 2020-21 | 36.29% -3.83% |
38.62% -2.93% |
29.33% -4.55% |
| 2021-22 | 32.04% -4.25% |
31.99% -6.62% |
31.94% 2.61% |
| 2022-23 | 32.64% 0.60% |
34.05% 2.05% |
28.03% -3.92% |
| 2023-24 | 32.72% 0.08% |
35.09% 1.05% |
25.43% -2.59% |
| Average | 37.52% | 39.17% | 30.89% |
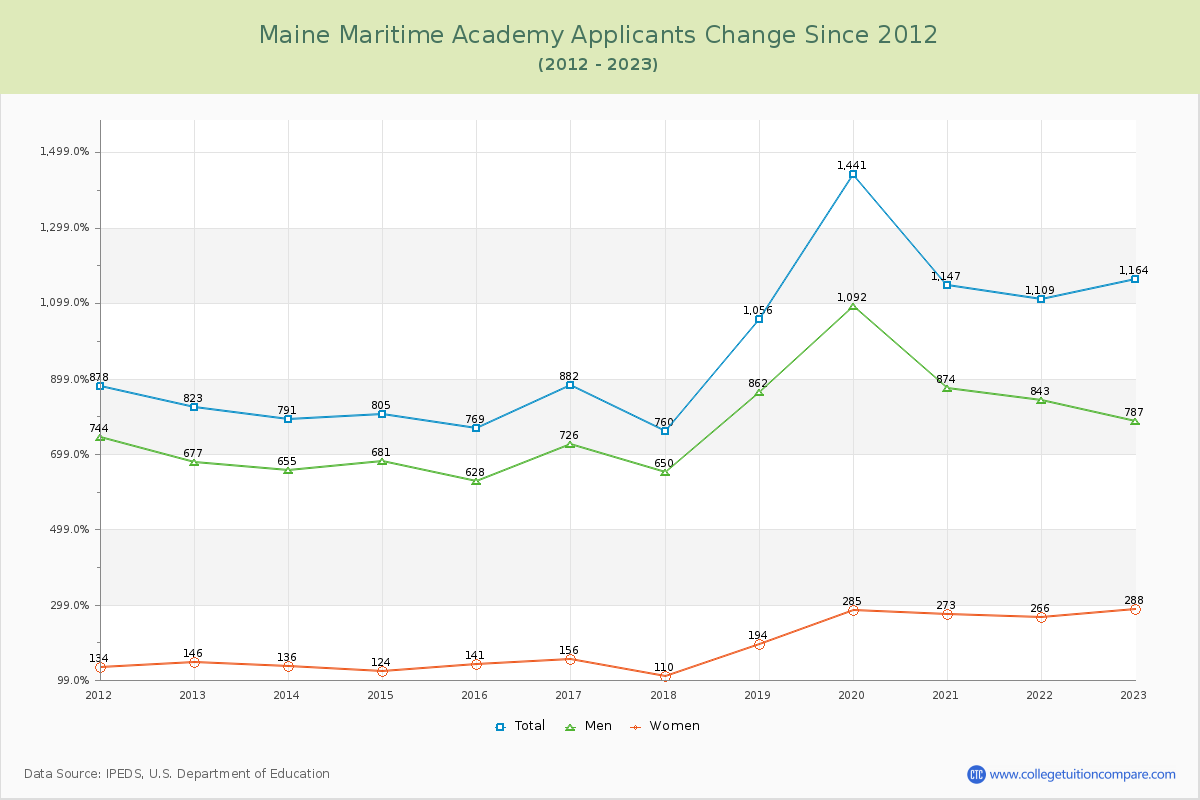
Applicants, Admitted, and Enrolled Headcount Changes
Over the past 10 years, The average number of applicants is 1,006, the average number of admitted is 616, and the average number of first-year enrolled students is 229.
The number of Maine Maritime Academy applicants decreased by -1.63% (19 applicants) compared to the previous year.
The following table and chart show the changes of applicants, admitted, and enrolled headcount at Maine Maritime Academy from 2013 to 2024.
| Year | Applicants | Admitted | Enrolled |
|---|---|---|---|
| 2013-14 | 791 | 517 | 225 |
| 2014-15 | 805 1.77% |
633 22.44% |
243 8.00% |
| 2015-16 | 769 -4.47% |
501 -20.85% |
208 -14.40% |
| 2016-17 | 882 14.69% |
666 32.93% |
246 18.27% |
| 2017-18 | 760 -13.83% |
605 -9.16% |
244 -0.81% |
| 2018-19 | 1,056 38.95% |
581 -3.97% |
222 -9.02% |
| 2019-20 | 1,441 36.46% |
653 12.39% |
262 18.02% |
| 2020-21 | 1,147 -20.40% |
598 -8.42% |
217 -17.18% |
| 2021-22 | 1,109 -3.31% |
643 7.53% |
206 -5.07% |
| 2022-23 | 1,164 4.96% |
671 4.35% |
219 6.31% |
| 2023-24 | 1,145 -1.63% |
703 4.77% |
230 5.02% |
| Average | 1,006 | 616 | 229 |
Compare Acceptance Rate Change to Similar Colleges
The following table compares acceptance rate changes from last year between Maine Maritime Academy and similar schools.
| 2024 | 2023 | Change % | |
|---|---|---|---|
| Maine Maritime Academy | 60.96% | 57.65% | 5.74% |
| University of Maine | 96.00% | 93.96% | 2.17% |
| University of Southern Maine | 79.00% | 85.43% | -7.53% |
| University of Maine at Augusta | - | - | - |
| University of Maine at Presque Isle | 96.95% | 96.99% | -0.04% |
| University of Maine at Farmington | 98.01% | 94.17% | 4.08% |
Ratings & Review
Share your experiences and thoughts about Maine Maritime Academy. It will be a great help to applicants and prospective students!