The student population at Middle Tennessee State University is 20,183 (17,668 undergraduate and 2,515 graduate students) . The number of students has decreased by 3,698 over the past decade.
The percentage of undergraduate students at Middle Tennessee State is 87.54% which is decreased by 3,494 over last 10 years. The graduate student population decreased by 204 and it has been decreasing.
The female to male ratio is 1.15 to 1 which means that female students enrolled slightly more than male students.
2,588 students enrolled in online degree program exclusively and the number of online students has increased by 62.05% since 2014.
Student Population Changes
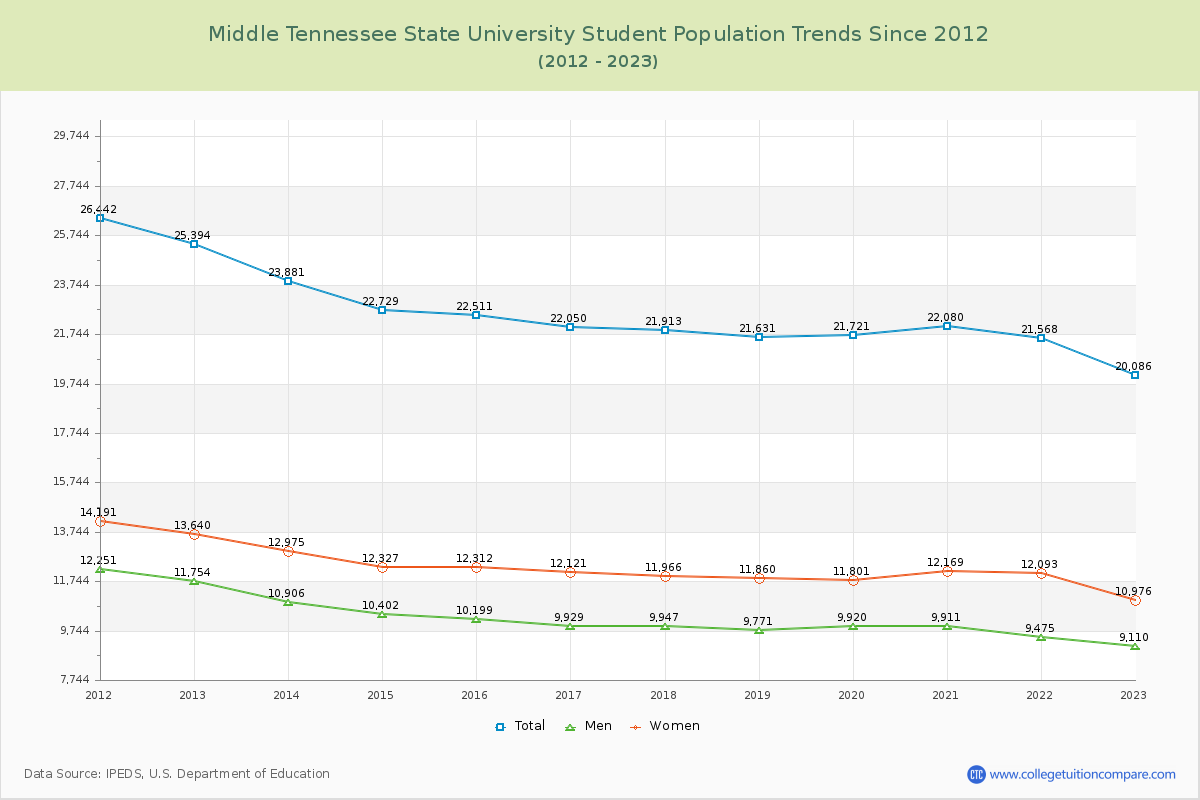
The average student population over the last 12 years is 21,850 where 20,183 students are attending the school for the academic year 2023-2024.
87.54% of total students is undergraduate students and 12.46% students is graduate students. The number of undergraduate students has decreased by 3,494 and the graduate enrollment has decreased by 204 over past 10 years.
The female to male ratio is 1.15 to 1 and it means that there are slightly more female students enrolled in Middle Tennessee State than male students.
The following table and chart illustrate the changes in student population by gender at Middle Tennessee State University since 2013.
| Year | Total | Undergraduate | Graduate | ||||
|---|---|---|---|---|---|---|---|
| Total | Men | Women | Total | Men | Women | ||
| 2013-14 | 23,881 | 21,162 | 9,867 | 11,295 | 2,719 | 1,039 | 1,680 |
| 2014-15 | 22,729 -1,152 | 20,262 -900 | 9,463 -404 | 10,799 -496 | 2,467 -252 | 939 -100 | 1,528 -152 |
| 2015-16 | 22,511 -218 | 20,140 -122 | 9,324 -139 | 10,816 17 | 2,371 -96 | 875 -64 | 1,496 -32 |
| 2016-17 | 22,050 -461 | 19,693 -447 | 9,050 -274 | 10,643 -173 | 2,357 -14 | 879 4 | 1,478 -18 |
| 2017-18 | 21,913 -137 | 19,523 -170 | 9,054 4 | 10,469 -174 | 2,390 33 | 893 14 | 1,497 19 |
| 2018-19 | 21,631 -282 | 19,252 -271 | 8,885 -169 | 10,367 -102 | 2,379 -11 | 886 -7 | 1,493 -4 |
| 2019-20 | 21,721 90 | 19,461 209 | 9,064 179 | 10,397 30 | 2,260 -119 | 856 -30 | 1,404 -89 |
| 2020-21 | 22,080 359 | 19,188 -273 | 8,828 -236 | 10,360 -37 | 2,892 632 | 1,083 227 | 1,809 405 |
| 2021-22 | 21,568 -512 | 18,603 -585 | 8,405 -423 | 10,198 -162 | 2,965 73 | 1,070 -13 | 1,895 86 |
| 2022-23 | 20,086 -1,482 | 17,438 -1,165 | 8,137 -268 | 9,301 -897 | 2,648 -317 | 973 -97 | 1,675 -220 |
| 2023-24 | 20,183 97 | 17,668 230 | 8,431 294 | 9,237 -64 | 2,515 -133 | 946 -27 | 1,569 -106 |
| Average | 21,850 | 19,308 | 8,955 | 10,353 | 2,542 | 949 | 1,593 |
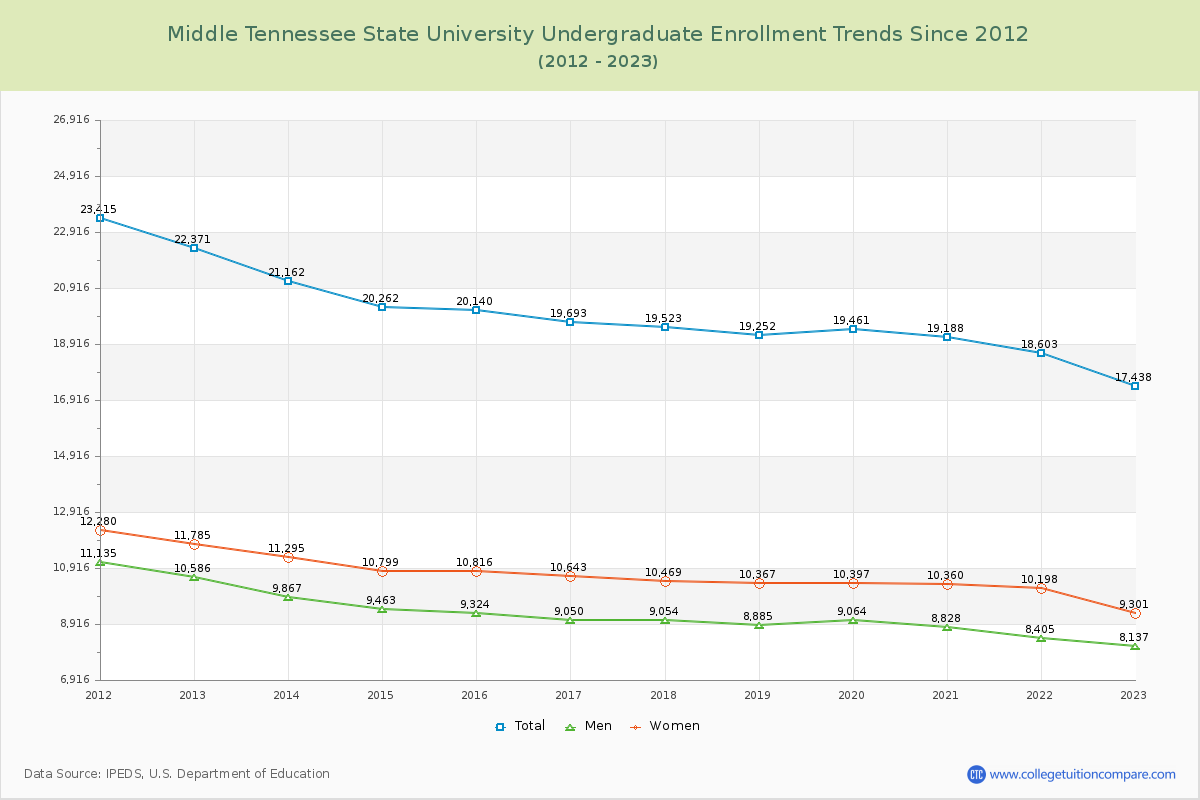
Undergraduate Enrollment Changes
The average number of Undergraduate students over the last 12 years is 19,308 where 17,668 students are attending the Undergraduate school for the academic year 2023-2024. The following table and chart illustrate the changes in Undergraduate enrollment by attending status and gender at Middle Tennessee State University since 2013.
| Year | Total | Full-time | Part-time | ||||
|---|---|---|---|---|---|---|---|
| Total | Men | Women | Total | Men | Women | ||
| 2013-14 | 21,162 | 17,381 | 8,106 | 9,275 | 3,781 | 1,761 | 2,020 |
| 2014-15 | 20,262 | 16,627 | 7,686 | 8,941 | 3,635 | 1,777 | 1,858 |
| 2015-16 | 20,140 | 16,167 | 7,507 | 8,660 | 3,973 | 1,817 | 2,156 |
| 2016-17 | 19,693 | 16,019 | 7,346 | 8,673 | 3,674 | 1,704 | 1,970 |
| 2017-18 | 19,523 | 15,812 | 7,333 | 8,479 | 3,711 | 1,721 | 1,990 |
| 2018-19 | 19,252 | 15,511 | 7,157 | 8,354 | 3,741 | 1,728 | 2,013 |
| 2019-20 | 19,461 | 15,721 | 7,363 | 8,358 | 3,740 | 1,701 | 2,039 |
| 2020-21 | 19,188 | 15,520 | 7,206 | 8,314 | 3,668 | 1,622 | 2,046 |
| 2021-22 | 18,603 | 15,112 | 6,903 | 8,209 | 3,491 | 1,502 | 1,989 |
| 2022-23 | 17,438 | 13,884 | 6,573 | 7,311 | 3,554 | 1,564 | 1,990 |
| 2023-24 | 17,668 | 13,950 | 6,760 | 7,190 | 3,718 | 1,671 | 2,047 |
| Average | 19,308 | 19,308 | 7,267 | 8,342 | 19,308 | 1,688 | 2,011 |
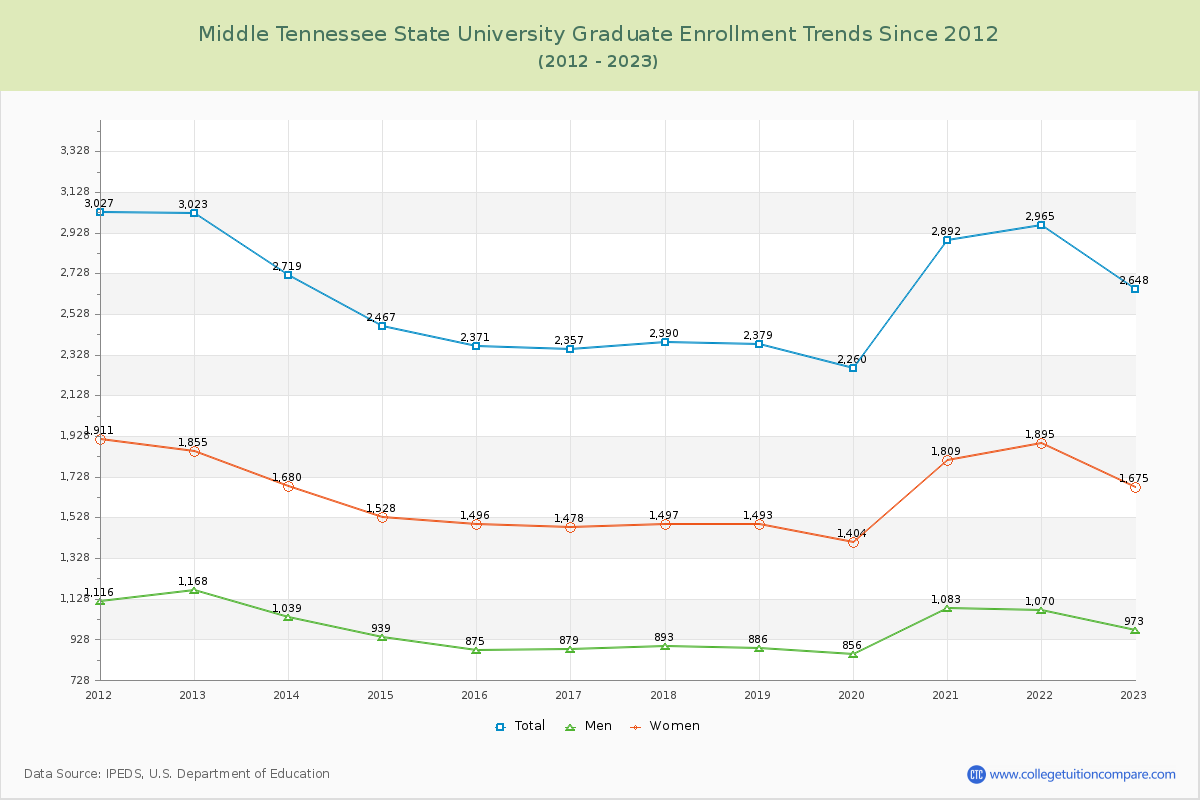
Graduate Enrollment Changes
The average number of Graduate students over the last 12 years is 2,542 where 2,515 students are attending the Graduate school for the academic year 2023-2024. The following table and chart illustrate the changes in Graduate enrollment by attending status and gender at Middle Tennessee State University since 2013.
| Year | Total | Full-time | Part-time | ||||
|---|---|---|---|---|---|---|---|
| Total | Men | Women | Total | Men | Women | ||
| 2013-14 | 2,719 | 899 | 405 | 494 | 1,820 | 634 | 1,186 |
| 2014-15 | 2,467 | 860 | 369 | 491 | 1,607 | 570 | 1,037 |
| 2015-16 | 2,371 | 794 | 335 | 459 | 1,577 | 540 | 1,037 |
| 2016-17 | 2,357 | 788 | 317 | 471 | 1,569 | 562 | 1,007 |
| 2017-18 | 2,390 | 763 | 328 | 435 | 1,627 | 565 | 1,062 |
| 2018-19 | 2,379 | 720 | 323 | 397 | 1,659 | 563 | 1,096 |
| 2019-20 | 2,260 | 681 | 305 | 376 | 1,579 | 551 | 1,028 |
| 2020-21 | 2,892 | 913 | 391 | 522 | 1,979 | 692 | 1,287 |
| 2021-22 | 2,965 | 880 | 334 | 546 | 2,085 | 736 | 1,349 |
| 2022-23 | 2,648 | 729 | 287 | 442 | 1,919 | 686 | 1,233 |
| 2023-24 | 2,515 | 834 | 329 | 505 | 1,681 | 617 | 1,064 |
| Average | 2,542 | 2,542 | 338 | 467 | 2,542 | 611 | 1,126 |
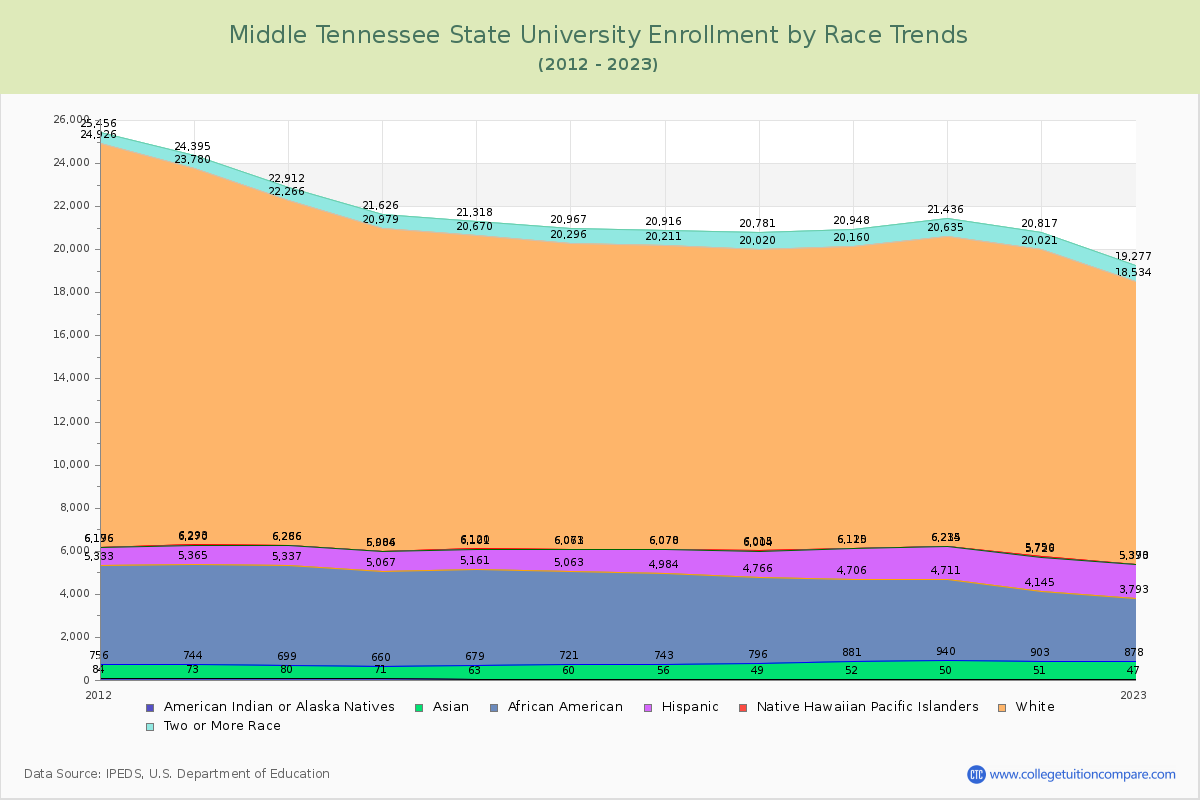
Enrollment by Race/Ethnicity Changes
The percentage of white students is 64.49%. The percentage was 66.92% 10 years ago and Middle Tennessee State still has a high percentage of white students. 4.37% of enrolled students is Asian and 13.48% is black students.
The following table and chart illustrate the student population trends by race/ethnicity at Middle Tennessee State University over the past 12 years (2013-2024).
| Year | American Indian or Native American | Asian | Black | Hispanic | Native Hawaiian or Other Pacific Islander | White | Two or More Races |
|---|---|---|---|---|---|---|---|
| 2013-14 | 80 | 619 | 4,638 | 929 | 20 | 15,980 | 646 |
| 2014-15 | 71 | 589 | 4,407 | 917 | 22 | 14,973 | 647 |
| 2015-16 | 63 | 616 | 4,482 | 940 | 19 | 14,550 | 648 |
| 2016-17 | 60 | 661 | 4,342 | 998 | 12 | 14,223 | 671 |
| 2017-18 | 56 | 687 | 4,241 | 1,086 | 8 | 14,133 | 705 |
| 2018-19 | 49 | 747 | 3,970 | 1,238 | 11 | 14,005 | 761 |
| 2019-20 | 52 | 829 | 3,825 | 1,404 | 15 | 14,035 | 788 |
| 2020-21 | 50 | 890 | 3,771 | 1,503 | 21 | 14,400 | 801 |
| 2021-22 | 51 | 852 | 3,242 | 1,581 | 24 | 14,271 | 796 |
| 2022-23 | 47 | 831 | 2,915 | 1,580 | 17 | 13,144 | 743 |
| 2023-24 | 54 | 883 | 2,721 | 1,785 | 17 | 13,016 | 783 |
| Average | 58 | 746 | 3,869 | 1,269 | 17 | 14,248 | 726 |
Distance Learning (Online Courses) Enrollment Changes
2,588 students are enrolled in online degree programs exclusively for the academic year 2023-2024, which is 13% of total students. The number of online students has increased 62.05% since 2014. The following table and chart illustrate the changes in the online student population by enrolled type at Middle Tennessee State University from 2014 to 2024.
| Year | Total Enrollment | Online Completely | Enrolled in Some Online Courses | Not Enrolled in Online Courses |
|---|---|---|---|---|
| 2014-15 | 22,729 | 1,597 | 4,224 | 16,908 |
| 2015-16 | 22,511 | 1,716 | 4,372 | 16,423 |
| 2016-17 | 22,050 | 1,670 | 4,908 | 15,472 |
| 2017-18 | 21,913 | 1,594 | 5,056 | 15,263 |
| 2018-19 | 21,631 | 1,634 | 5,857 | 14,140 |
| 2019-20 | 21,721 | 1,627 | 6,293 | 13,801 |
| 2020-21 | 22,080 | 2,276 | 9,976 | 9,828 |
| 2021-22 | 21,568 | 2,489 | 7,472 | 11,607 |
| 2022-23 | 20,086 | 3,020 | 7,846 | 9,220 |
| 2023-24 | 20,183 | 2,588 | 7,964 | 9,631 |
| Average | 21,647 | 2,021 | 6,397 | 13,229 |
Ratings & Review
Share your experiences and thoughts about Middle Tennessee State University. It will be a great help to applicants and prospective students!