At Montreat College, the average acceptance rate over the past 11 years is 62.48%, and 2024's acceptance rate is 65.55%. For 2024 admission, it was slightly harder to get into Montreat College than the previous year.
The average yield (enrollment rate) over the period is 26.90%, and the 2024 yield is 14.24%.
The number of Montreat applicants increased by 49.58% (714 applicants) compared to the previous year.
Acceptance Rate Changes
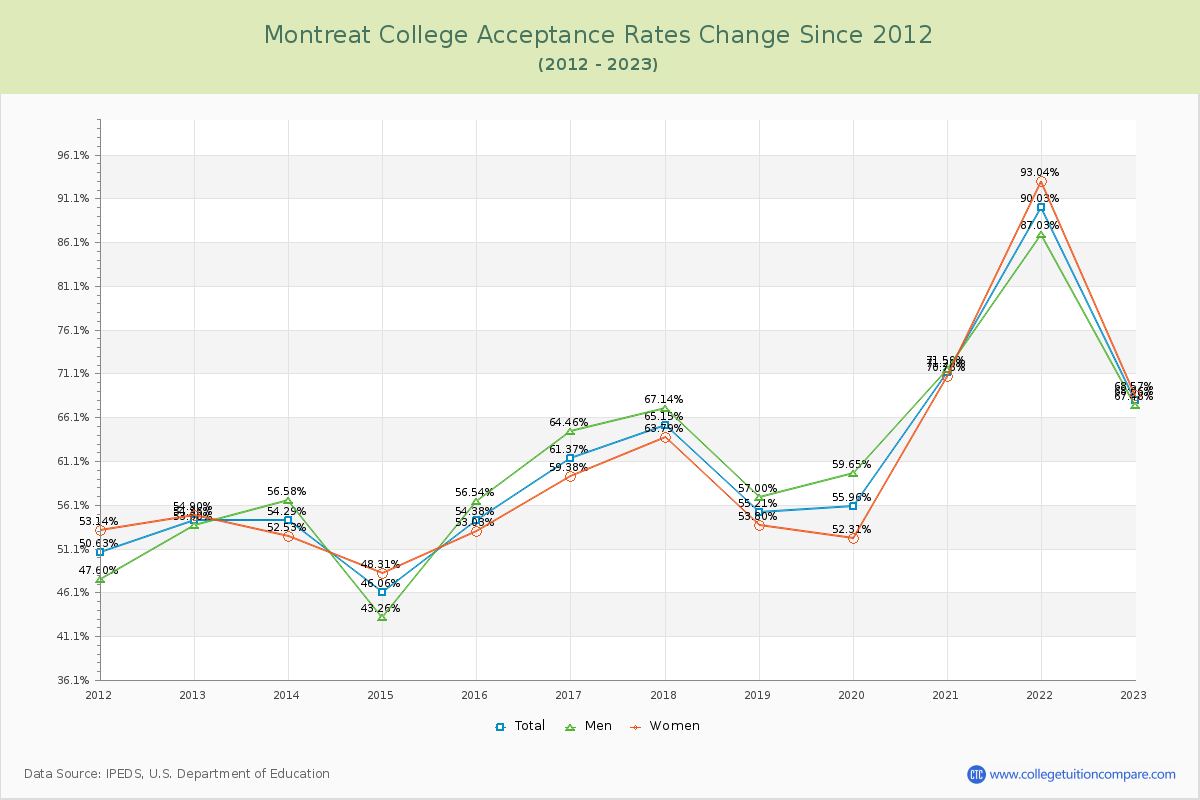
The average acceptance rate over the last 10 years is 62.48%, and this year's acceptance rate is 65.55% at Montreat College. By gender, men students' acceptance rate is 63.21% and women students' rate is 62.00%. For 2024 admission, it was slightly harder to get into Montreat College than the previous year.
The following table and chart illustrate the acceptance rates changes at Montreat College over the past 11 years (2013-2024).
| Year | Total | Men | Women |
|---|---|---|---|
| 2013-14 | 54.29% | 56.58% | 52.53% |
| 2014-15 | 46.06% -8.23% |
43.26% -13.32% |
48.31% -4.22% |
| 2015-16 | 54.38% 8.32% |
56.54% 13.28% |
53.03% 4.72% |
| 2016-17 | 61.37% 6.99% |
64.46% 7.92% |
59.38% 6.35% |
| 2017-18 | 65.15% 3.78% |
67.14% 2.69% |
63.79% 4.41% |
| 2018-19 | 55.21% -9.94% |
57.00% -10.14% |
53.80% -9.99% |
| 2019-20 | 55.96% 0.74% |
59.65% 2.64% |
52.31% -1.49% |
| 2020-21 | 71.20% 15.24% |
71.59% 11.94% |
70.76% 18.45% |
| 2021-22 | 90.03% 18.84% |
87.03% 15.45% |
93.04% 22.28% |
| 2022-23 | 68.06% -21.98% |
67.48% -19.55% |
68.57% -24.47% |
| 2023-24 | 65.55% -2.50% |
64.58% -2.90% |
66.52% -2.05% |
| Average | 62.48% | 63.21% | 62.00% |
Admission Yield (Enrollment Rate) Changes
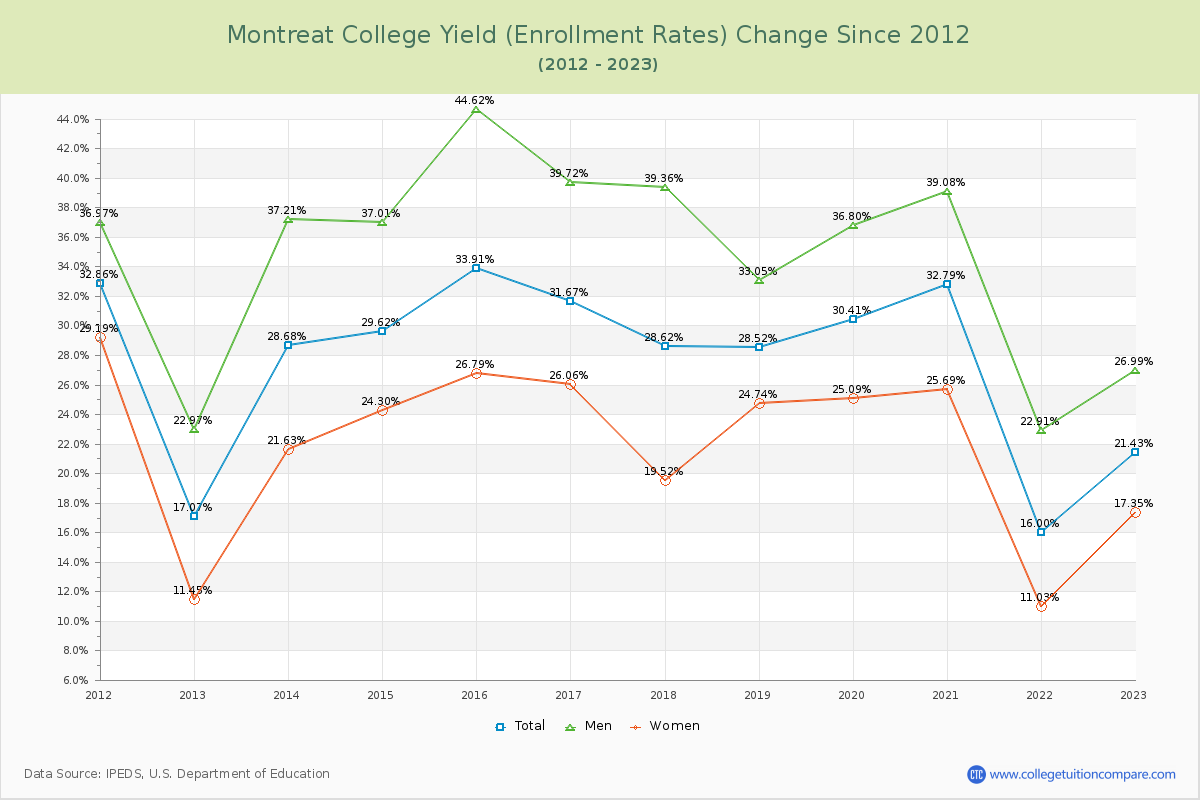
The average admission yield of the last 11 years is 26.90% where the current academic year yield is 14.24%.
The following table and chart illustrate the changes in yield at Montreat College from 2013 to 2024.
| Year | Total | Men | Women |
|---|---|---|---|
| 2013-14 | 28.68% | 37.21% | 21.63% |
| 2014-15 | 29.62% 0.94% |
37.01% -0.20% |
24.30% 2.66% |
| 2015-16 | 33.91% 4.29% |
44.62% 7.61% |
26.79% 2.49% |
| 2016-17 | 31.67% -2.24% |
39.72% -4.90% |
26.06% -0.73% |
| 2017-18 | 28.62% -3.05% |
39.36% -0.36% |
19.52% -6.54% |
| 2018-19 | 28.52% -0.10% |
33.05% -6.31% |
24.74% 5.22% |
| 2019-20 | 30.41% 1.90% |
36.80% 3.75% |
25.09% 0.35% |
| 2020-21 | 32.79% 2.38% |
39.08% 2.27% |
25.69% 0.61% |
| 2021-22 | 16.00% -16.79% |
22.91% -16.17% |
11.03% -14.67% |
| 2022-23 | 21.43% 5.43% |
26.99% 4.08% |
17.35% 6.32% |
| 2023-24 | 14.24% -7.19% |
19.41% -7.57% |
9.83% -7.52% |
| Average | 26.90% | 34.20% | 21.09% |
Applicants, Admitted, and Enrolled Headcount Changes
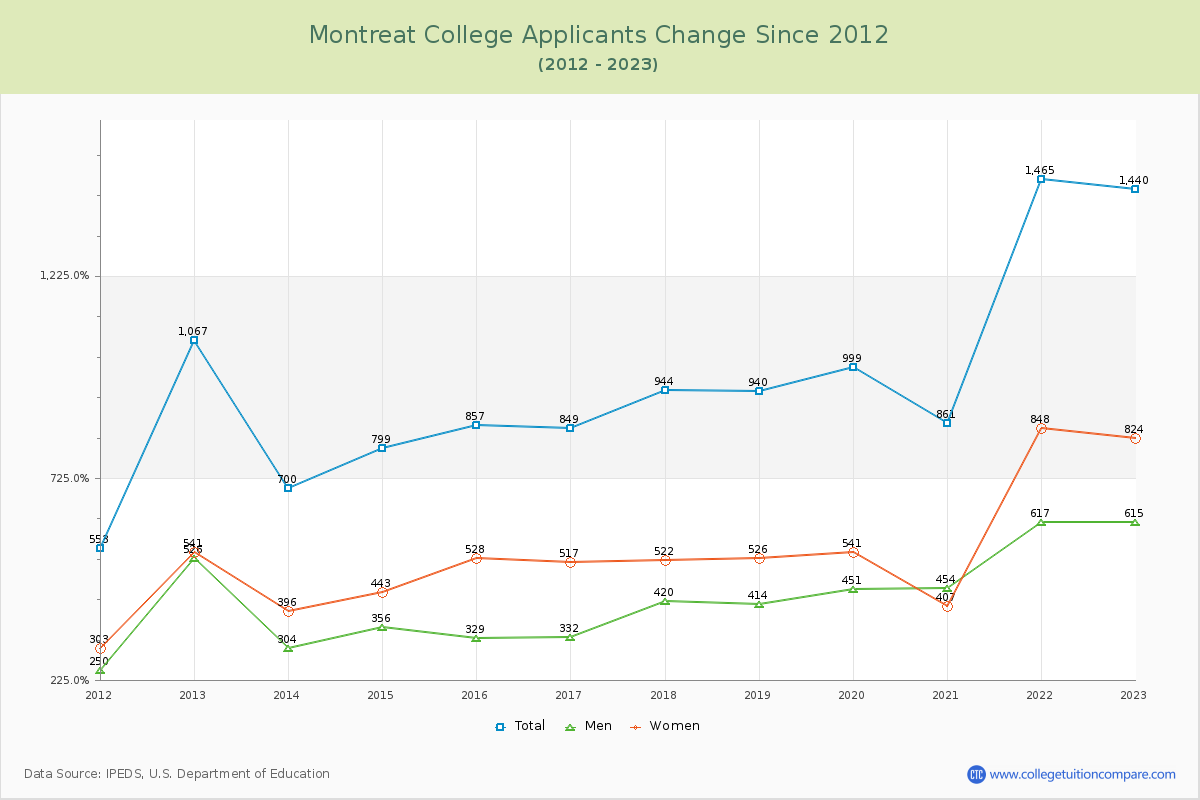
Over the past 10 years, The average number of applicants is 1,092, the average number of admitted is 705, and the average number of first-year enrolled students is 169.
The number of Montreat applicants increased by 49.58% (714 applicants) compared to the previous year.
The following table and chart show the changes of applicants, admitted, and enrolled headcount at Montreat College from 2013 to 2024.
| Year | Applicants | Admitted | Enrolled |
|---|---|---|---|
| 2013-14 | 700 | 380 | 109 |
| 2014-15 | 799 14.14% |
368 -3.16% |
109 |
| 2015-16 | 857 7.26% |
466 26.63% |
158 44.95% |
| 2016-17 | 849 -0.93% |
521 11.80% |
165 4.43% |
| 2017-18 | 944 11.19% |
615 18.04% |
176 6.67% |
| 2018-19 | 940 -0.42% |
519 -15.61% |
148 -15.91% |
| 2019-20 | 999 6.28% |
559 7.71% |
170 14.86% |
| 2020-21 | 861 -13.81% |
613 9.66% |
201 18.24% |
| 2021-22 | 1,465 70.15% |
1,319 115.17% |
211 4.98% |
| 2022-23 | 1,440 -1.71% |
980 -25.70% |
210 -0.47% |
| 2023-24 | 2,154 49.58% |
1,412 44.08% |
201 -4.29% |
| Average | 1,092 | 705 | 169 |
Compare Acceptance Rate Change to Similar Colleges
The following table compares acceptance rate changes from last year between Montreat College and similar schools.
| 2024 | 2023 | Change % | |
|---|---|---|---|
| Montreat College | 66.02% | 68.06% | -3.00% |
| Duke University | 7.00% | 6.35% | 10.24% |
| Wake Forest University | 22.00% | 21.37% | 2.95% |
| Elon University | 67.00% | 74.46% | -10.02% |
| High Point University | 77.00% | 78.88% | -2.38% |
| Campbell University | 93.99% | 88.58% | 6.11% |
Ratings & Review
Share your experiences and thoughts about Montreat College. It will be a great help to applicants and prospective students!