The student population at Neumont College of Computer Science is 530 (all undergraduate). The number of students has increased by 110 over the past decade.
The female to male ratio is 0.21 to 1 which means that majority of population is on male students.
All students have enrolled in on-campus classes (Neumont College of Computer Science does not offer online degree/certificate program).
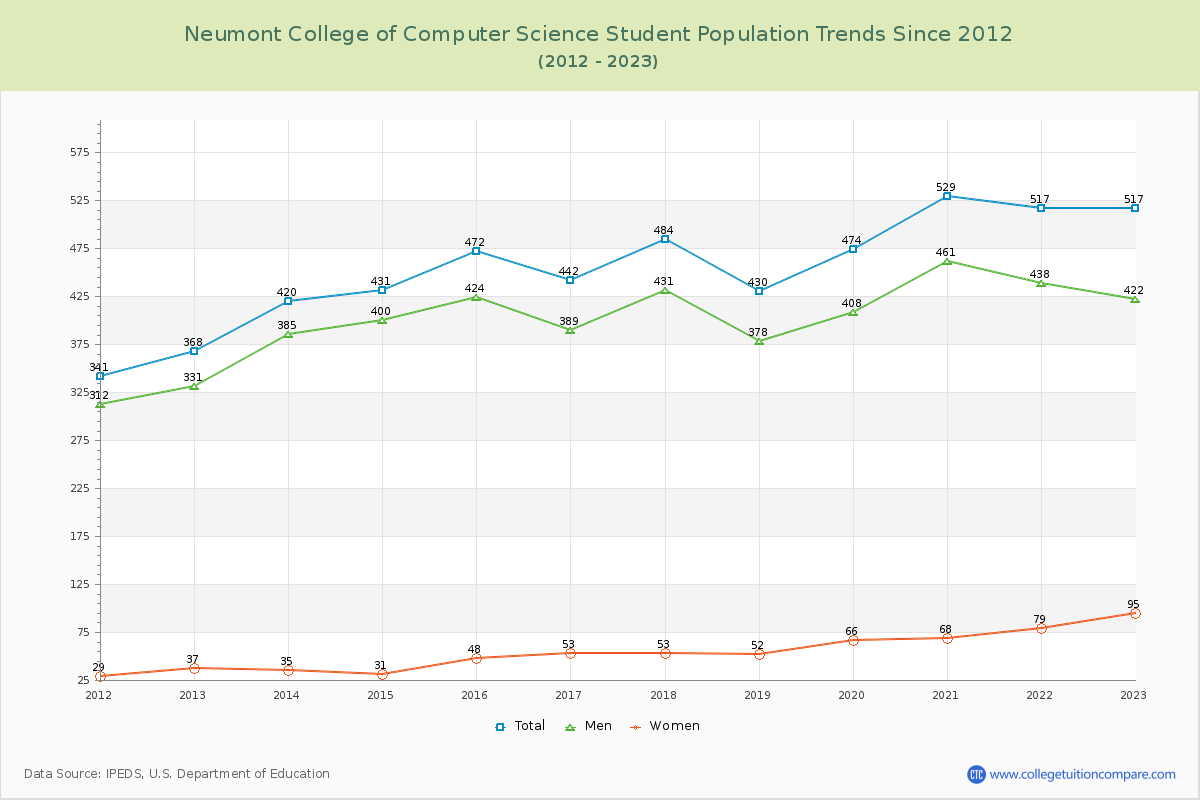
Student Population Changes
The average student population over the last 12 years is 477 where 530 students are attending the school for the academic year 2023-2024.
The female to male ratio is 0.21 to 1 and it means that there are far more male students enrolled in Neumont College of Computer Science than female students.
The following table and chart illustrate the changes in student population by gender at Neumont College of Computer Science since 2013.
| Year | Total | Men | Women |
|---|---|---|---|
| 2013-14 | 420 | 385 | 35 |
| 2014-15 | 431 11 | 400 15 | 31 -4 |
| 2015-16 | 472 41 | 424 24 | 48 17 |
| 2016-17 | 442 -30 | 389 -35 | 53 5 |
| 2017-18 | 484 42 | 431 42 | 53 |
| 2018-19 | 430 -54 | 378 -53 | 52 -1 |
| 2019-20 | 474 44 | 408 30 | 66 14 |
| 2020-21 | 529 55 | 461 53 | 68 2 |
| 2021-22 | 517 -12 | 438 -23 | 79 11 |
| 2022-23 | 517 | 422 -16 | 95 16 |
| 2023-24 | 530 13 | 437 15 | 93 -2 |
| Average | 477 | 416 | 61 |
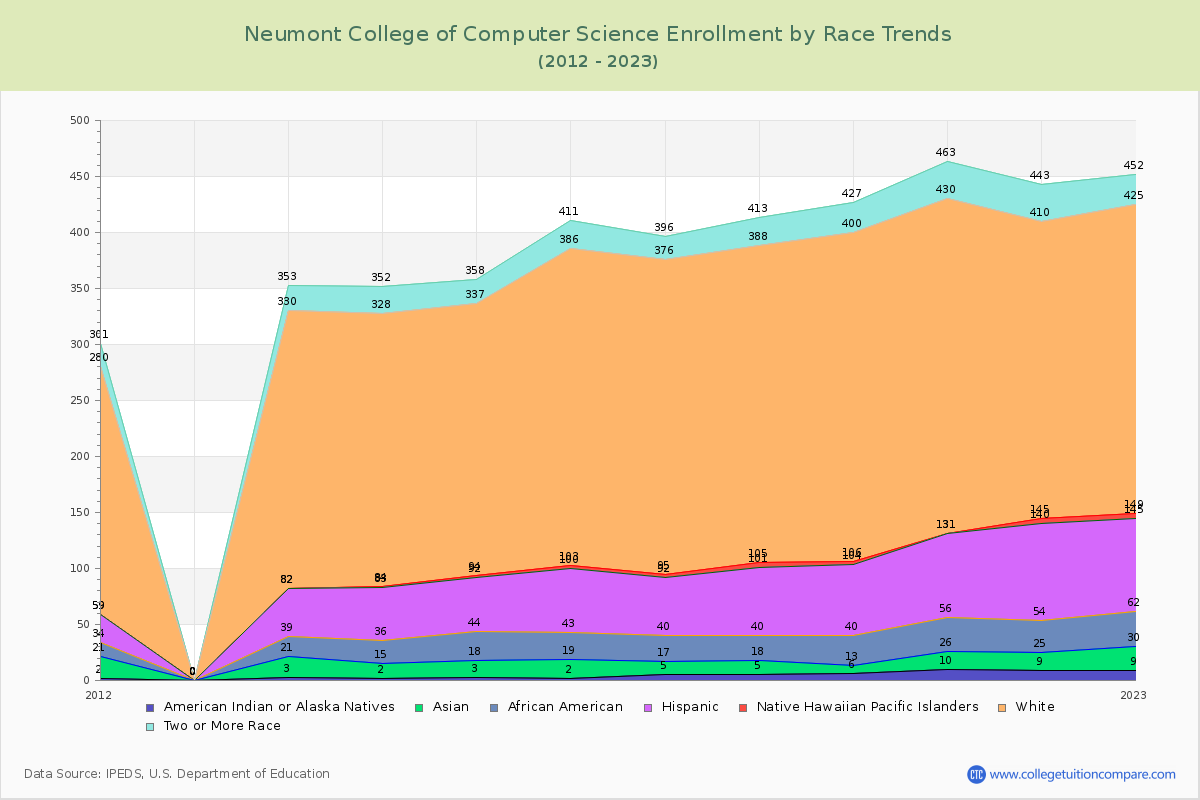
Enrollment by Race/Ethnicity Changes
The percentage of white students is 51.32%. The percentage was 59.05% 10 years ago and Neumont College of Computer Science still has a high percentage of white students. 4.34% of enrolled students is Asian and 7.55% is black students.
The following table and chart illustrate the student population trends by race/ethnicity at Neumont College of Computer Science over the past 12 years (2013-2024).
| Year | American Indian or Native American | Asian | Black | Hispanic | Native Hawaiian or Other Pacific Islander | White | Two or More Races |
|---|---|---|---|---|---|---|---|
| 2013-14 | 3 | 18 | 18 | 43 | 0 | 248 | 23 |
| 2014-15 | 2 | 13 | 21 | 47 | 1 | 244 | 24 |
| 2015-16 | 3 | 15 | 26 | 48 | 2 | 243 | 21 |
| 2016-17 | 2 | 17 | 24 | 57 | 3 | 283 | 25 |
| 2017-18 | 5 | 12 | 23 | 52 | 3 | 281 | 20 |
| 2018-19 | 5 | 13 | 22 | 61 | 4 | 283 | 25 |
| 2019-20 | 6 | 7 | 27 | 64 | 2 | 294 | 27 |
| 2020-21 | 10 | 16 | 30 | 75 | 0 | 299 | 33 |
| 2021-22 | 9 | 16 | 29 | 86 | 5 | 265 | 33 |
| 2022-23 | 9 | 21 | 32 | 83 | 4 | 276 | 27 |
| 2023-24 | 12 | 23 | 40 | 83 | 3 | 272 | 19 |
| Average | 6 | 16 | 27 | 64 | 2 | 272 | 25 |
Distance Learning (Online Courses) Enrollment Changes
Neumont College of Computer Science does not offer online degree/certificate programs. All Students have enrolled in on-campus programs.
Ratings & Review
Share your experiences and thoughts about Neumont College of Computer Science. It will be a great help to applicants and prospective students!