The student population at Notre Dame of Maryland University is 1,836 (686 undergraduate and 1,150 graduate students) . The number of students has decreased by 1,041 over the past decade.
The percentage of undergraduate students at Notre Dame of Maryland is 37.36% which is decreased by 548 over last 10 years. The graduate student population decreased by 493 and it has been decreasing.
974 students enrolled in online degree program exclusively and the number of online students has increased by 549.33% since 2014.
Student Population Changes
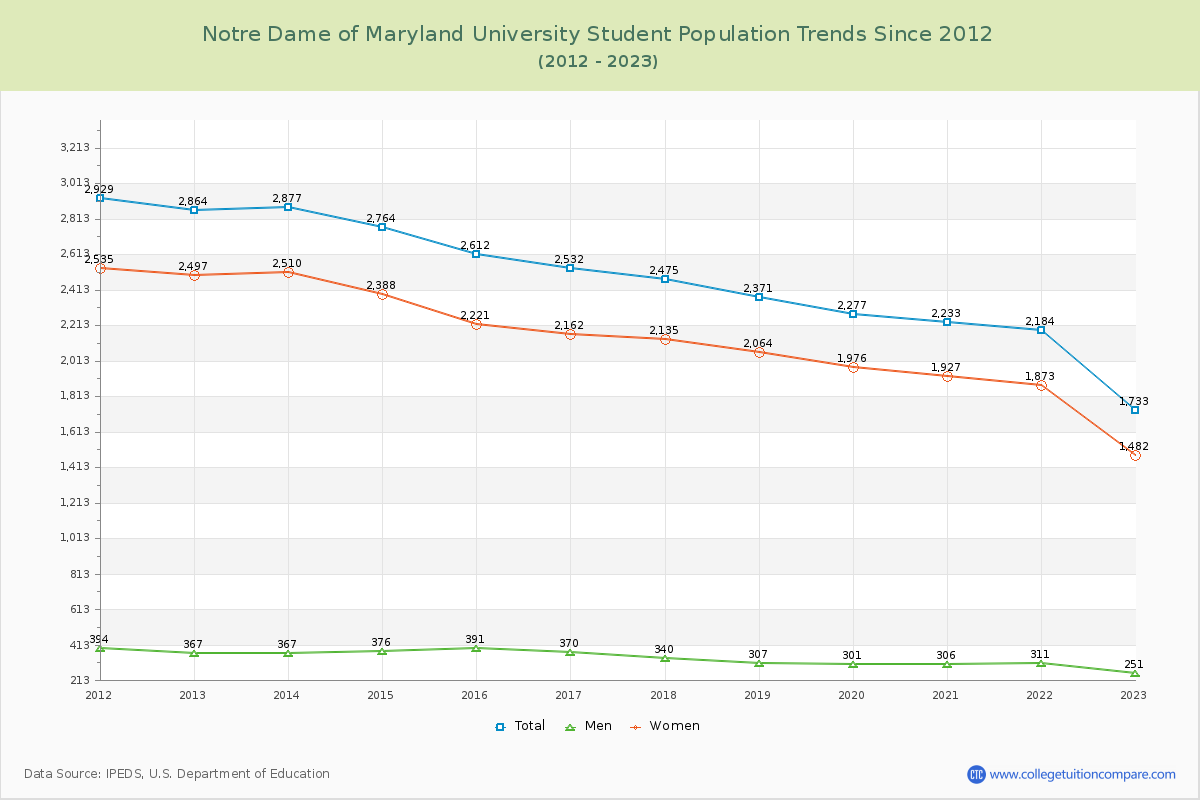
The average student population over the last 12 years is 2,354 where 1,836 students are attending the school for the academic year 2023-2024.
37.36% of total students is undergraduate students and 62.64% students is graduate students. The number of undergraduate students has decreased by 548 and the graduate enrollment has decreased by 493 over past 10 years.
The following table and chart illustrate the changes in student population by gender at Notre Dame of Maryland University since 2013.
| Year | Total | Undergraduate | Graduate | ||||
|---|---|---|---|---|---|---|---|
| Total | Men | Women | Total | Men | Women | ||
| 2013-14 | 2,877 | 1,234 | 57 | 1,177 | 1,643 | 310 | 1,333 |
| 2014-15 | 2,764 -113 | 1,169 -65 | 58 1 | 1,111 -66 | 1,595 -48 | 318 8 | 1,277 -56 |
| 2015-16 | 2,612 -152 | 1,013 -156 | 55 -3 | 958 -153 | 1,599 4 | 336 18 | 1,263 -14 |
| 2016-17 | 2,532 -80 | 874 -139 | 41 -14 | 833 -125 | 1,658 59 | 329 -7 | 1,329 66 |
| 2017-18 | 2,475 -57 | 816 -58 | 41 | 775 -58 | 1,659 1 | 299 -30 | 1,360 31 |
| 2018-19 | 2,371 -104 | 836 20 | 36 -5 | 800 25 | 1,535 -124 | 271 -28 | 1,264 -96 |
| 2019-20 | 2,277 -94 | 783 -53 | 28 -8 | 755 -45 | 1,494 -41 | 273 2 | 1,221 -43 |
| 2020-21 | 2,233 -44 | 755 -28 | 26 -2 | 729 -26 | 1,478 -16 | 280 7 | 1,198 -23 |
| 2021-22 | 2,184 -49 | 807 52 | 30 4 | 777 48 | 1,377 -101 | 281 1 | 1,096 -102 |
| 2022-23 | 1,733 -451 | 660 -147 | 25 -5 | 635 -142 | 1,073 -304 | 226 -55 | 847 -249 |
| 2023-24 | 1,836 103 | 686 26 | 76 51 | 610 -25 | 1,150 77 | 224 -2 | 926 79 |
| Average | 2,354 | 876 | 43 | 833 | 1,478 | 286 | 1,192 |
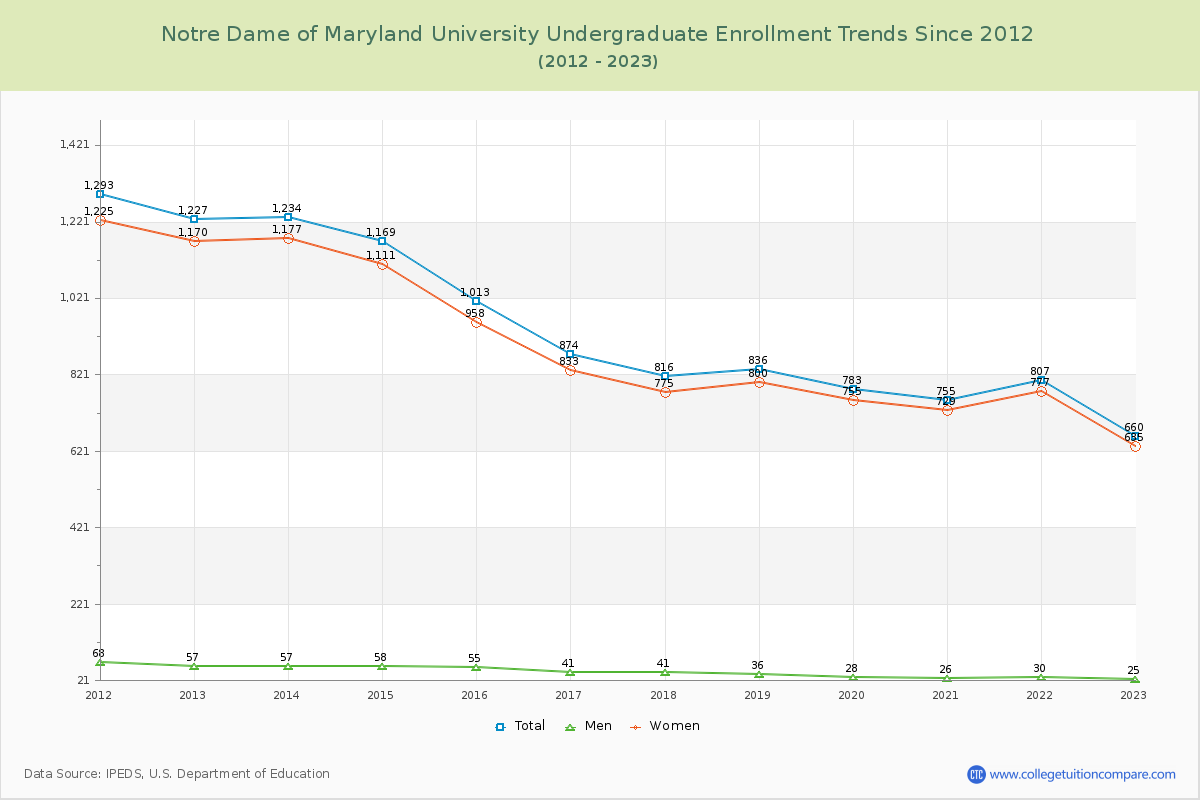
Undergraduate Enrollment Changes
The average number of Undergraduate students over the last 12 years is 876 where 686 students are attending the Undergraduate school for the academic year 2023-2024. The following table and chart illustrate the changes in Undergraduate enrollment by attending status and gender at Notre Dame of Maryland University since 2013.
| Year | Total | Full-time | Part-time | ||||
|---|---|---|---|---|---|---|---|
| Total | Men | Women | Total | Men | Women | ||
| 2013-14 | 1,234 | 525 | 4 | 521 | 709 | 53 | 656 |
| 2014-15 | 1,169 | 538 | 5 | 533 | 631 | 53 | 578 |
| 2015-16 | 1,013 | 516 | 0 | 516 | 497 | 55 | 442 |
| 2016-17 | 874 | 515 | 2 | 513 | 359 | 39 | 320 |
| 2017-18 | 816 | 528 | 9 | 519 | 288 | 32 | 256 |
| 2018-19 | 836 | 594 | 9 | 585 | 242 | 27 | 215 |
| 2019-20 | 783 | 533 | 8 | 525 | 250 | 20 | 230 |
| 2020-21 | 755 | 563 | 15 | 548 | 192 | 11 | 181 |
| 2021-22 | 807 | 623 | 19 | 604 | 184 | 11 | 173 |
| 2022-23 | 660 | 497 | 16 | 481 | 163 | 9 | 154 |
| 2023-24 | 686 | 534 | 65 | 469 | 152 | 11 | 141 |
| Average | 876 | 876 | 14 | 529 | 876 | 29 | 304 |
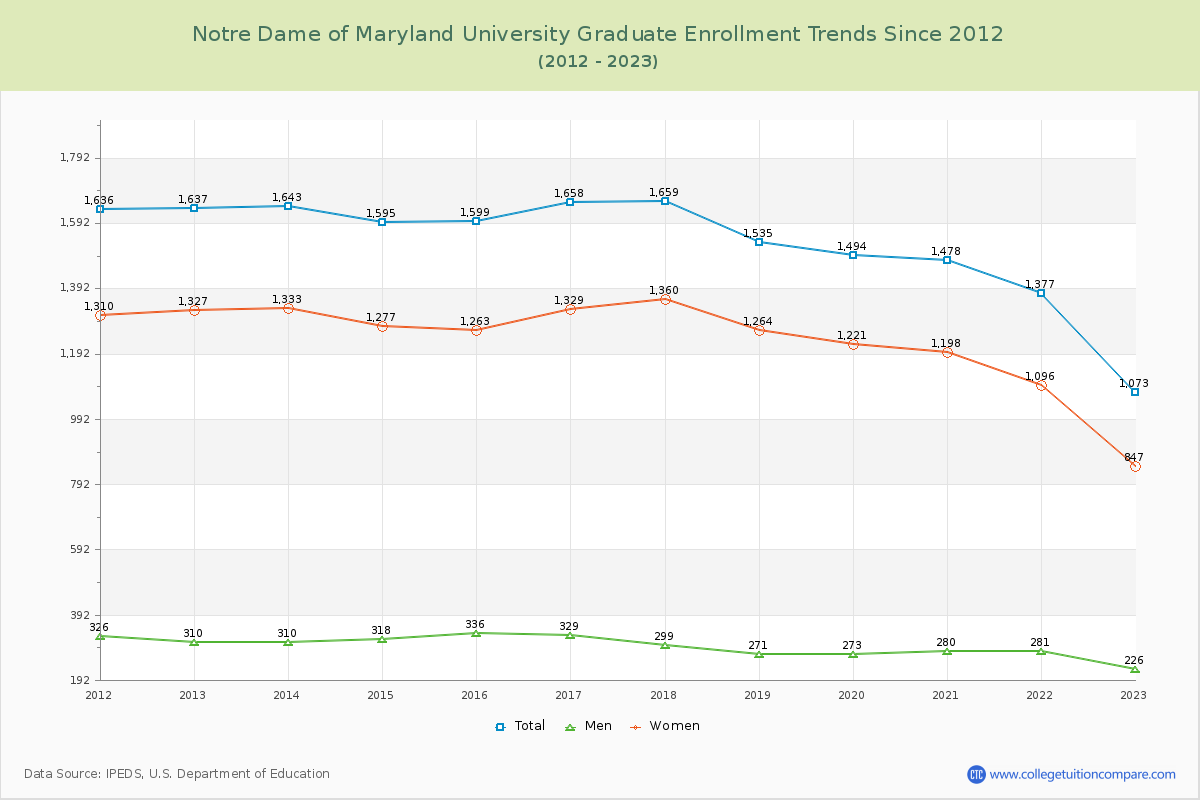
Graduate Enrollment Changes
The average number of Graduate students over the last 12 years is 1,478 where 1,150 students are attending the Graduate school for the academic year 2023-2024. The following table and chart illustrate the changes in Graduate enrollment by attending status and gender at Notre Dame of Maryland University since 2013.
| Year | Total | Full-time | Part-time | ||||
|---|---|---|---|---|---|---|---|
| Total | Men | Women | Total | Men | Women | ||
| 2013-14 | 1,643 | 363 | 95 | 268 | 1,280 | 215 | 1,065 |
| 2014-15 | 1,595 | 356 | 87 | 269 | 1,239 | 231 | 1,008 |
| 2015-16 | 1,599 | 347 | 93 | 254 | 1,252 | 243 | 1,009 |
| 2016-17 | 1,658 | 317 | 79 | 238 | 1,341 | 250 | 1,091 |
| 2017-18 | 1,659 | 318 | 70 | 248 | 1,341 | 229 | 1,112 |
| 2018-19 | 1,535 | 359 | 77 | 282 | 1,176 | 194 | 982 |
| 2019-20 | 1,494 | 361 | 72 | 289 | 1,133 | 201 | 932 |
| 2020-21 | 1,478 | 391 | 73 | 318 | 1,087 | 207 | 880 |
| 2021-22 | 1,377 | 355 | 70 | 285 | 1,022 | 211 | 811 |
| 2022-23 | 1,073 | 276 | 62 | 214 | 797 | 164 | 633 |
| 2023-24 | 1,150 | 267 | 59 | 208 | 883 | 165 | 718 |
| Average | 1,478 | 1,478 | 76 | 261 | 1,478 | 210 | 931 |
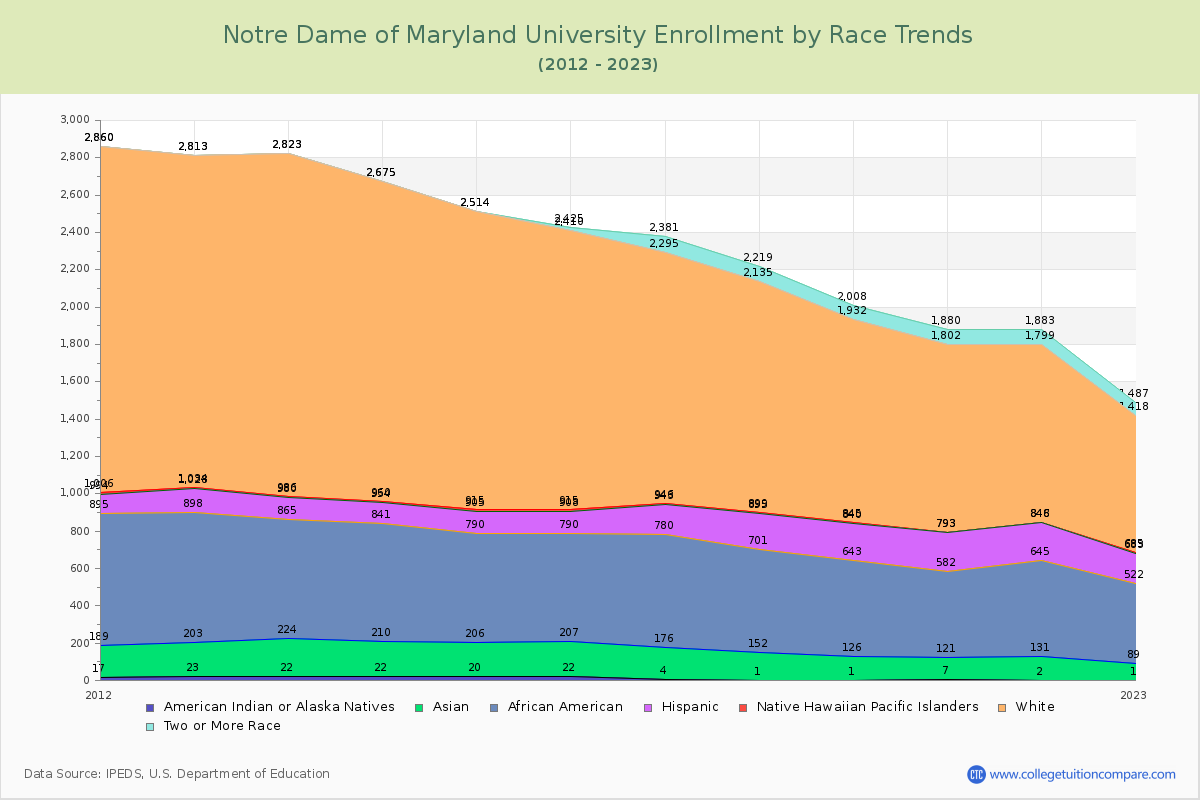
Enrollment by Race/Ethnicity Changes
The percentage of white students is 39.76% and the percentage of black students is 28.43% at Notre Dame of Maryland University. 4.52% of enrolled students is Asian.
The following table and chart illustrate the student population trends by race/ethnicity at Notre Dame of Maryland University over the past 12 years (2013-2024).
| Year | American Indian or Native American | Asian | Black | Hispanic | Native Hawaiian or Other Pacific Islander | White | Two or More Races |
|---|---|---|---|---|---|---|---|
| 2013-14 | 22 | 202 | 641 | 115 | 6 | 1,837 | 0 |
| 2014-15 | 22 | 188 | 631 | 113 | 6 | 1,715 | 0 |
| 2015-16 | 20 | 186 | 584 | 115 | 10 | 1,599 | 0 |
| 2016-17 | 22 | 185 | 583 | 118 | 7 | 1,495 | 15 |
| 2017-18 | 4 | 172 | 604 | 163 | 3 | 1,349 | 86 |
| 2018-19 | 1 | 151 | 549 | 194 | 4 | 1,236 | 84 |
| 2019-20 | 1 | 125 | 517 | 197 | 5 | 1,087 | 76 |
| 2020-21 | 7 | 114 | 461 | 211 | 0 | 1,009 | 78 |
| 2021-22 | 2 | 129 | 514 | 201 | 2 | 951 | 84 |
| 2022-23 | 1 | 88 | 433 | 161 | 2 | 733 | 69 |
| 2023-24 | 3 | 83 | 522 | 187 | 4 | 730 | 0 |
| Average | 10 | 148 | 549 | 161 | 4 | 1,249 | 45 |
Distance Learning (Online Courses) Enrollment Changes
974 students are enrolled in online degree programs exclusively for the academic year 2023-2024, which is 53% of total students. The number of online students has increased 549.33% since 2014. The following table and chart illustrate the changes in the online student population by enrolled type at Notre Dame of Maryland University from 2014 to 2024.
| Year | Total Enrollment | Online Completely | Enrolled in Some Online Courses | Not Enrolled in Online Courses |
|---|---|---|---|---|
| 2014-15 | 2,764 | 150 | 256 | 2,358 |
| 2015-16 | 2,612 | 197 | 312 | 2,103 |
| 2016-17 | 2,532 | 203 | 268 | 2,061 |
| 2017-18 | 2,475 | 287 | 353 | 1,835 |
| 2018-19 | 2,371 | 317 | 381 | 1,673 |
| 2019-20 | 2,277 | 425 | 461 | 1,391 |
| 2020-21 | 2,233 | 840 | 516 | 877 |
| 2021-22 | 2,184 | 1,138 | 533 | 513 |
| 2022-23 | 1,733 | 915 | 332 | 486 |
| 2023-24 | 1,836 | 974 | 259 | 603 |
| Average | 2,302 | 545 | 367 | 1,390 |
Ratings & Review
Share your experiences and thoughts about Notre Dame of Maryland University. It will be a great help to applicants and prospective students!