At Oberlin College, the average acceptance rate over the past 11 years is 33.05%, and 2024's acceptance rate is 32.98%.
The average yield (enrollment rate) over the period is 28.13%, and the 2024 yield is 21.40%.
The number of Oberlin applicants decreased by -0.24% (27 applicants) compared to the previous year.
Acceptance Rate Changes
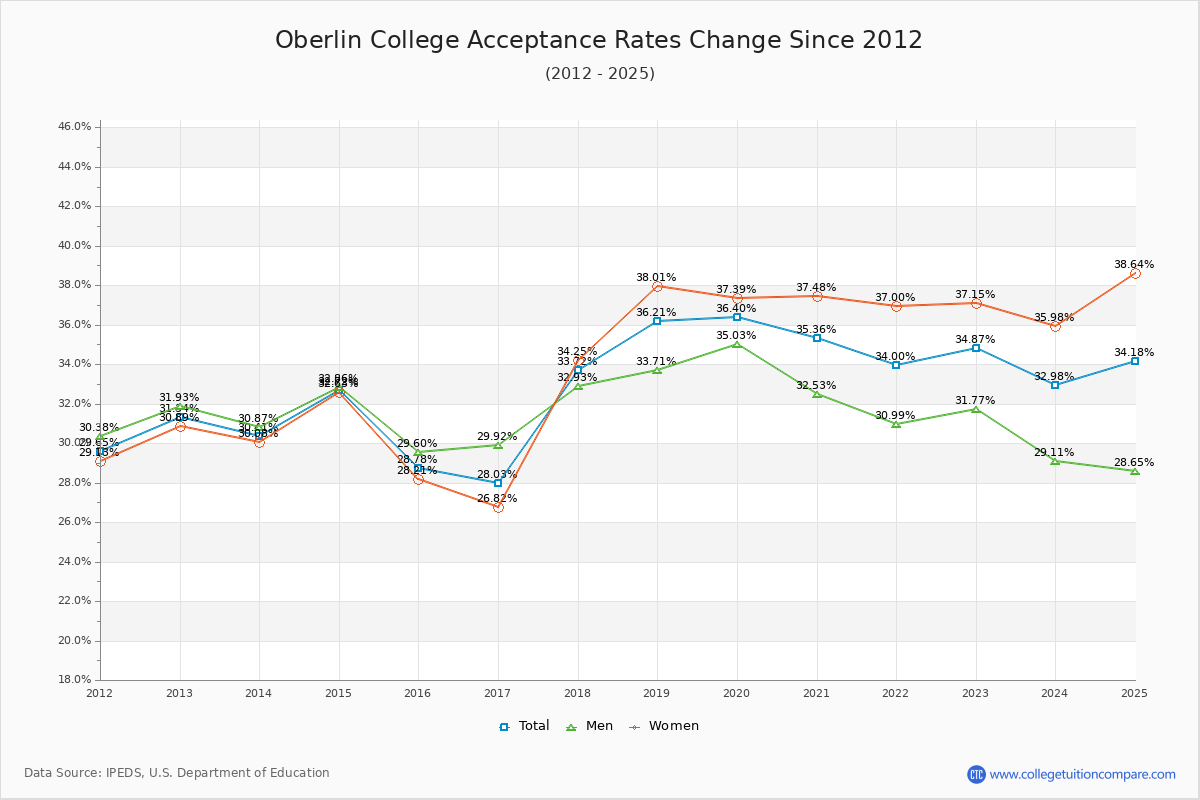
The average acceptance rate over the last 10 years is 33.05%, and this year's acceptance rate is 32.98% at Oberlin College. By gender, men students' acceptance rate is 31.76% and women students' rate is 34.09%.
The following table and chart illustrate the acceptance rates changes at Oberlin College over the past 11 years (2013-2024).
| Year | Total | Men | Women |
|---|---|---|---|
| 2013-14 | 30.41% | 30.87% | 30.08% |
| 2014-15 | 32.72% 2.31% |
32.86% 1.99% |
32.63% 2.54% |
| 2015-16 | 28.78% -3.95% |
29.60% -3.27% |
28.21% -4.42% |
| 2016-17 | 28.03% -0.74% |
29.92% 0.33% |
26.82% -1.39% |
| 2017-18 | 33.72% 5.68% |
32.93% 3.01% |
34.25% 7.42% |
| 2018-19 | 36.21% 2.50% |
33.71% 0.79% |
38.01% 3.76% |
| 2019-20 | 36.40% 0.19% |
35.03% 1.32% |
37.39% -0.62% |
| 2020-21 | 35.36% -1.04% |
32.53% -2.50% |
37.48% 0.09% |
| 2021-22 | 34.00% -1.36% |
30.99% -1.54% |
37.00% -0.48% |
| 2022-23 | 34.87% 0.87% |
31.77% 0.77% |
37.15% 0.15% |
| 2023-24 | 32.98% -1.89% |
29.11% -2.65% |
35.98% -1.17% |
| Average | 33.05% | 31.76% | 34.09% |
Admission Yield (Enrollment Rate) Changes
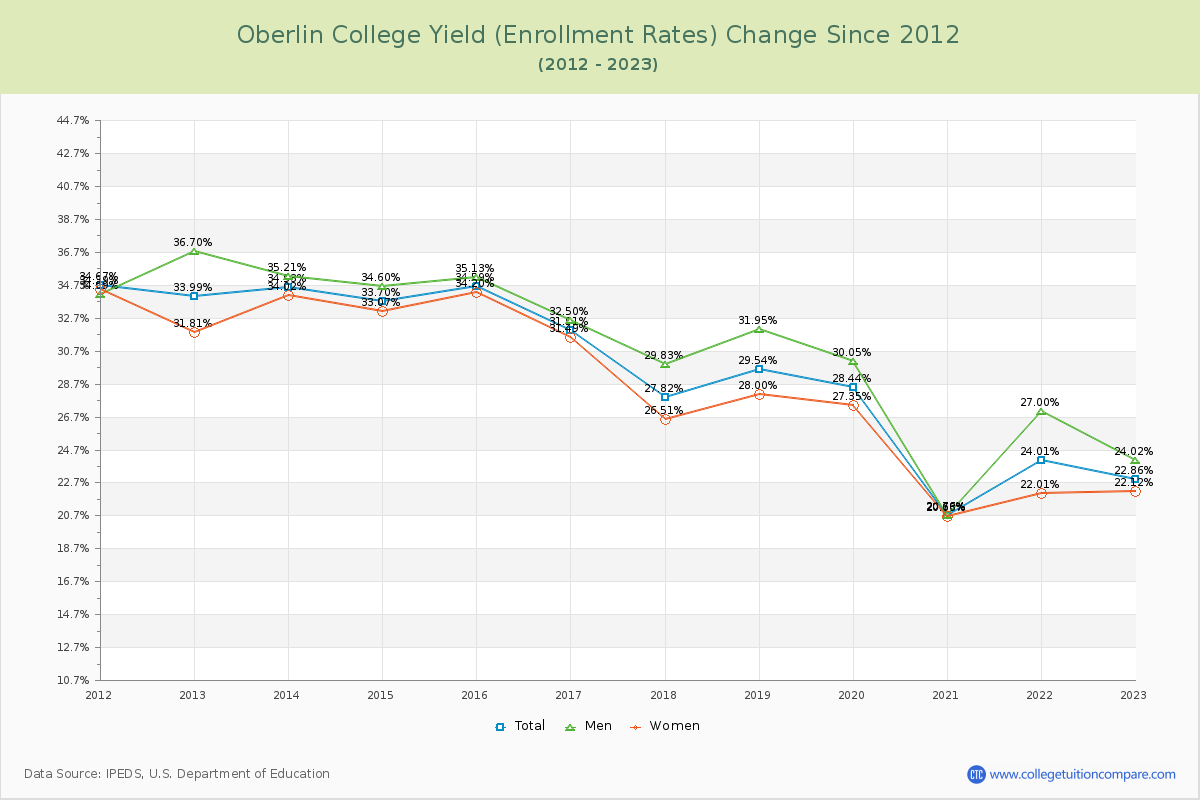
The average admission yield of the last 11 years is 28.13% where the current academic year yield is 21.40%.
The following table and chart illustrate the changes in yield at Oberlin College from 2013 to 2024.
| Year | Total | Men | Women |
|---|---|---|---|
| 2013-14 | 34.53% | 35.21% | 34.02% |
| 2014-15 | 33.70% -0.83% |
34.60% -0.61% |
33.07% -0.96% |
| 2015-16 | 34.59% 0.89% |
35.13% 0.54% |
34.20% 1.13% |
| 2016-17 | 31.91% -2.68% |
32.50% -2.63% |
31.49% -2.71% |
| 2017-18 | 27.82% -4.09% |
29.83% -2.66% |
26.51% -4.98% |
| 2018-19 | 29.54% 1.72% |
31.95% 2.12% |
28.00% 1.49% |
| 2019-20 | 28.44% -1.10% |
30.05% -1.90% |
27.35% -0.65% |
| 2020-21 | 20.66% -7.78% |
20.70% -9.36% |
20.63% -6.72% |
| 2021-22 | 24.01% 3.35% |
27.00% 6.30% |
22.01% 1.38% |
| 2022-23 | 22.86% -1.15% |
24.02% -2.97% |
22.12% 0.11% |
| 2023-24 | 21.40% -1.46% |
23.02% -1.00% |
20.38% -1.75% |
| Average | 28.13% | 29.46% | 27.25% |
Applicants, Admitted, and Enrolled Headcount Changes
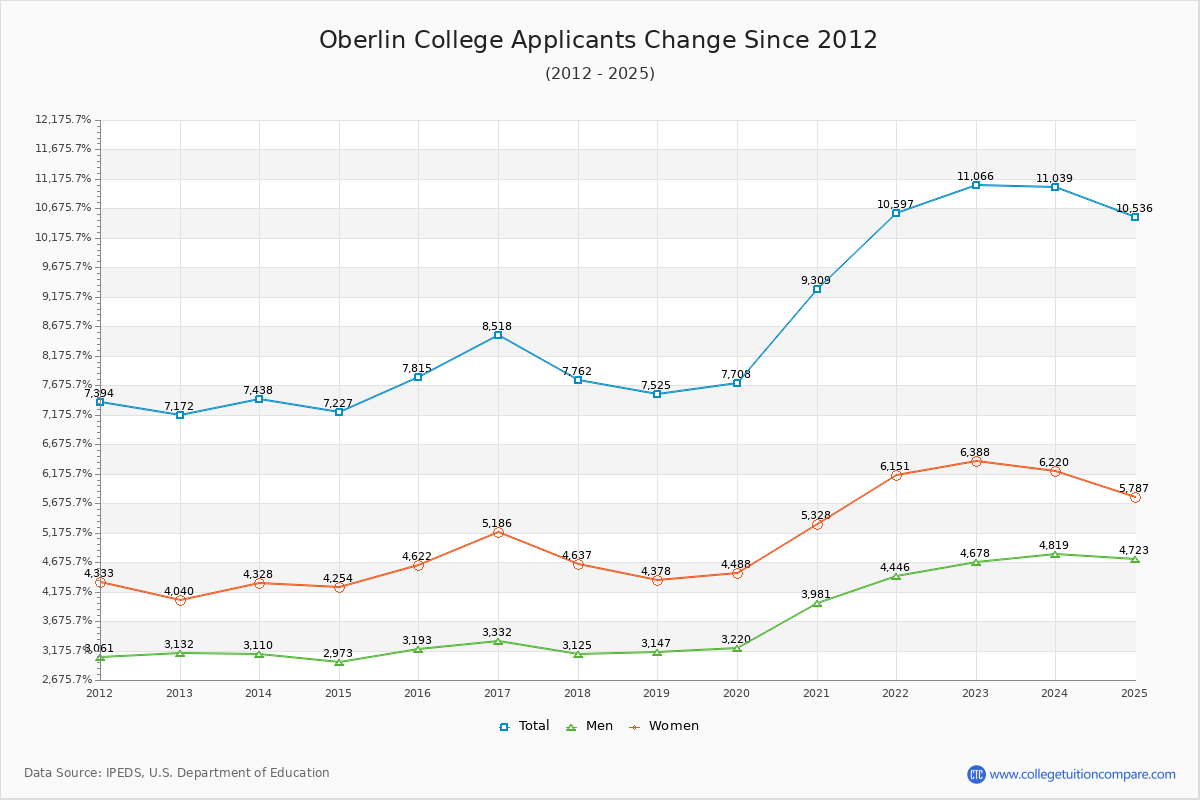
Over the past 10 years, The average number of applicants is 8,728, the average number of admitted is 2,892, and the average number of first-year enrolled students is 787.
The number of Oberlin applicants decreased by -0.24% (27 applicants) compared to the previous year.
The following table and chart show the changes of applicants, admitted, and enrolled headcount at Oberlin College from 2013 to 2024.
| Year | Applicants | Admitted | Enrolled |
|---|---|---|---|
| 2013-14 | 7,438 | 2,262 | 781 |
| 2014-15 | 7,227 -2.84% |
2,365 4.55% |
797 2.05% |
| 2015-16 | 7,815 8.14% |
2,249 -4.90% |
778 -2.38% |
| 2016-17 | 8,518 9.00% |
2,388 6.18% |
762 -2.06% |
| 2017-18 | 7,762 -8.88% |
2,617 9.59% |
728 -4.46% |
| 2018-19 | 7,525 -3.05% |
2,725 4.13% |
805 10.58% |
| 2019-20 | 7,708 2.43% |
2,806 2.97% |
798 -0.87% |
| 2020-21 | 9,309 20.77% |
3,292 17.32% |
680 -14.79% |
| 2021-22 | 10,597 13.84% |
3,603 9.45% |
865 27.21% |
| 2022-23 | 11,066 4.43% |
3,859 7.11% |
882 1.97% |
| 2023-24 | 11,039 -0.24% |
3,641 -5.65% |
779 -11.68% |
| Average | 8,728 | 2,892 | 787 |
Compare Acceptance Rate Change to Similar Colleges
The following table compares acceptance rate changes from last year between Oberlin College and similar schools.
| 2024 | 2023 | Change % | |
|---|---|---|---|
| Oberlin College | 33.00% | 34.87% | -5.36% |
| Guilford College | 84.00% | 83.51% | 0.59% |
| Case Western Reserve University | 29.00% | 27.41% | 5.80% |
| University of Dayton | 62.00% | 74.05% | -16.27% |
| Franklin University | - | - | - |
| Xavier University | 88.00% | 84.54% | 4.09% |
Ratings & Review
Share your experiences and thoughts about Oberlin College. It will be a great help to applicants and prospective students!