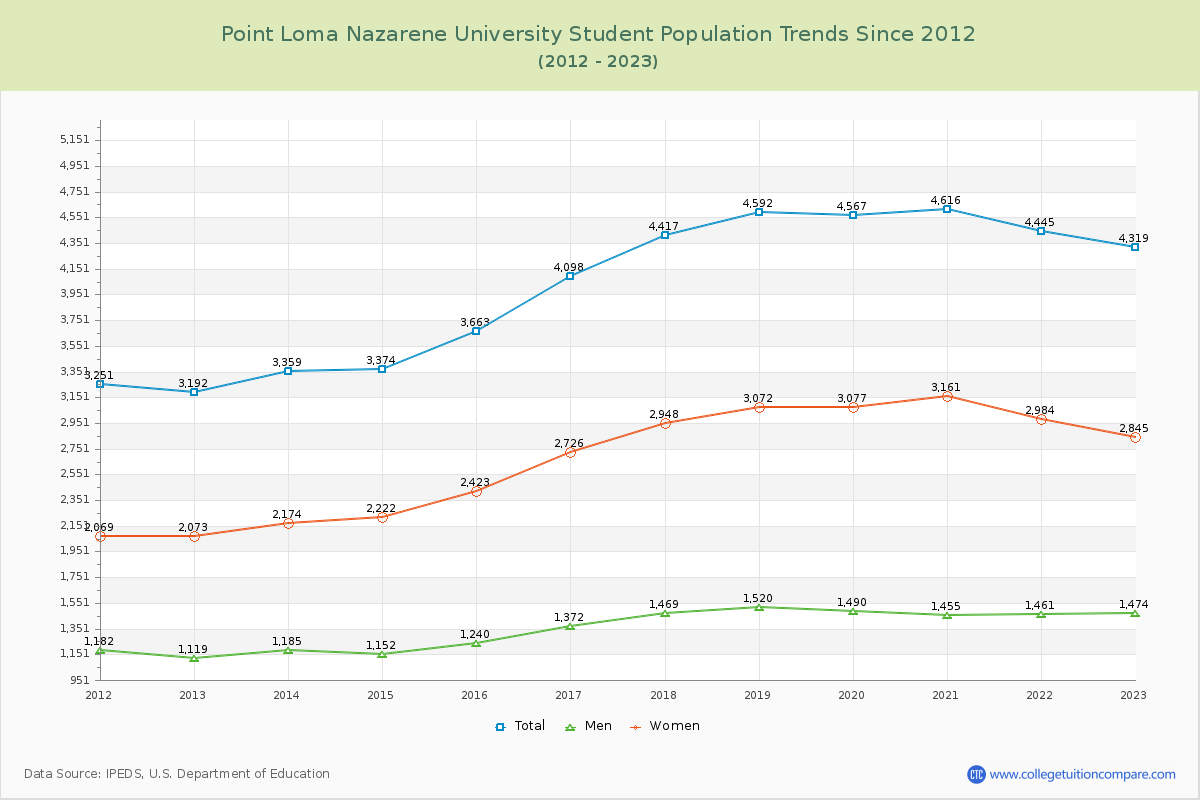
The student population at Point Loma Nazarene University is 4,319 (3,154 undergraduate and 1,165 graduate students) . The number of students has increased by 960 over the past decade.
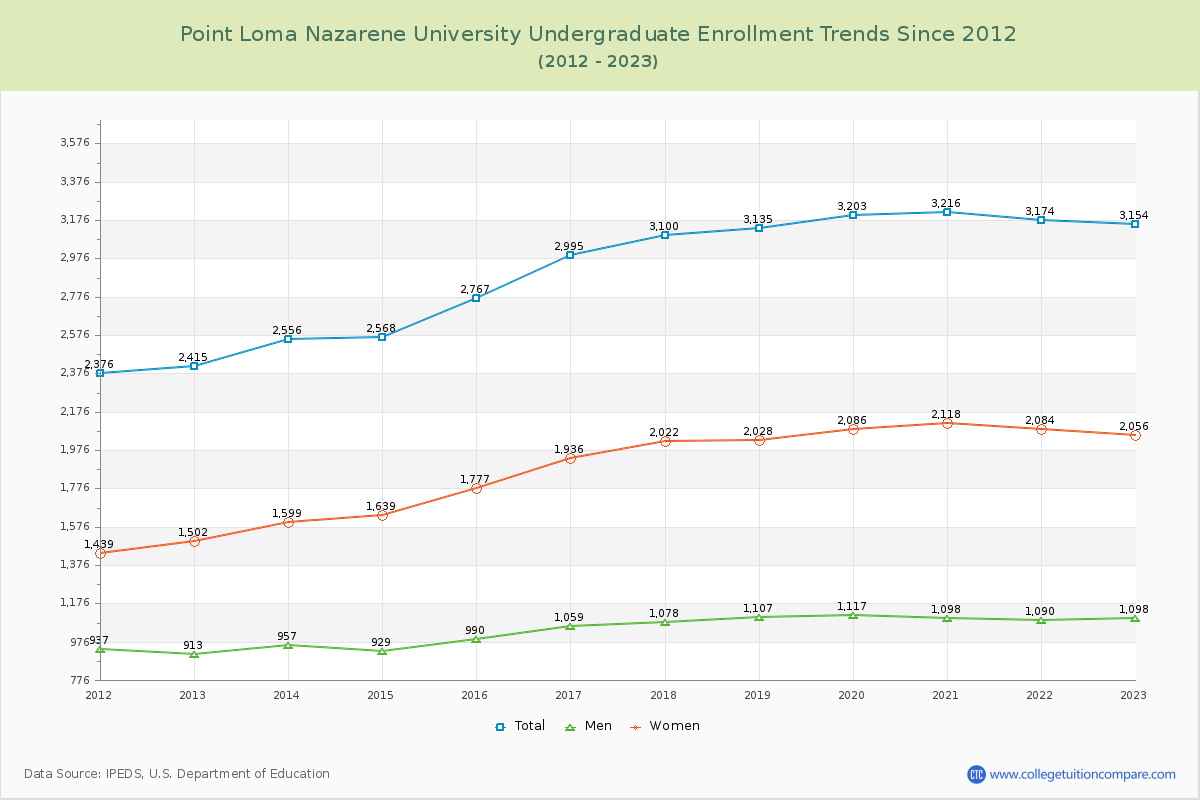
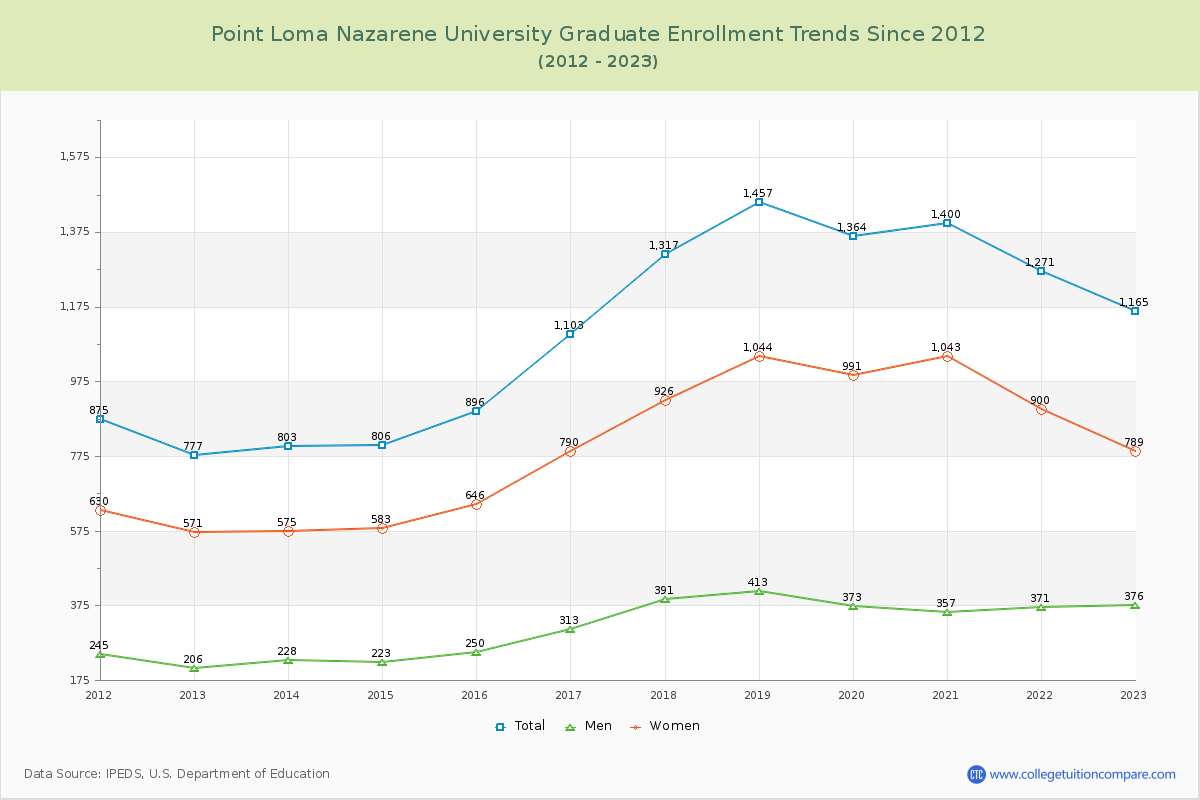
The percentage of undergraduate students at PLNU is 73.03% which is increased by 598 over last 10 years. The graduate student population increased by 362 and it has been increasing.
The female to male ratio is 1.93 to 1 which means that female students enrolled more than male students.
537 students enrolled in online degree program exclusively and the number of online students has increased by 1,578.13% since 2014.
Student Population Changes
The average student population over the last 11 years is 4,145 where 4,319 students are attending the school for the academic year 2022-2023.
73.03% of total students is undergraduate students and 26.97% students is graduate students. The number of undergraduate students has increased by 598 and the graduate enrollment has increased by 362 over past 10 years.
The female to male ratio is 1.93 to 1 and it means that there are more female students enrolled in PLNU than male students.
The following table and chart illustrate the changes in student population by gender at Point Loma Nazarene University since 2013.
| Year | Total | Undergraduate | Graduate | ||||
|---|---|---|---|---|---|---|---|
| Total | Men | Women | Total | Men | Women | ||
| 2013-14 | 3,359 | 2,556 | 957 | 1,599 | 803 | 228 | 575 |
| 2014-15 | 3,374 15 | 2,568 12 | 929 -28 | 1,639 40 | 806 3 | 223 -5 | 583 8 |
| 2015-16 | 3,663 289 | 2,767 199 | 990 61 | 1,777 138 | 896 90 | 250 27 | 646 63 |
| 2016-17 | 4,098 435 | 2,995 228 | 1,059 69 | 1,936 159 | 1,103 207 | 313 63 | 790 144 |
| 2017-18 | 4,417 319 | 3,100 105 | 1,078 19 | 2,022 86 | 1,317 214 | 391 78 | 926 136 |
| 2018-19 | 4,592 175 | 3,135 35 | 1,107 29 | 2,028 6 | 1,457 140 | 413 22 | 1,044 118 |
| 2019-20 | 4,567 -25 | 3,203 68 | 1,117 10 | 2,086 58 | 1,364 -93 | 373 -40 | 991 -53 |
| 2020-21 | 4,616 49 | 3,216 13 | 1,098 -19 | 2,118 32 | 1,400 36 | 357 -16 | 1,043 52 |
| 2021-22 | 4,445 -171 | 3,174 -42 | 1,090 -8 | 2,084 -34 | 1,271 -129 | 371 14 | 900 -143 |
| 2022-23 | 4,319 -126 | 3,154 -20 | 1,098 8 | 2,056 -28 | 1,165 -106 | 376 5 | 789 -111 |
| Average | 4,145 | 2,987 | 1,052 | 1,935 | 1,158 | 330 | 829 |

Undergraduate Enrollment Changes
The average number of Undergraduate students over the last 11 years is 2,987 where 3,154 students are attending the Undergraduate school for the academic year 2022-2023. The following table and chart illustrate the changes in Undergraduate enrollment by attending status and gender at Point Loma Nazarene University since 2013.
| Year | Total | Full-time | Part-time | ||||
|---|---|---|---|---|---|---|---|
| Total | Men | Women | Total | Men | Women | ||
| 2013-14 | 2,556 | 2,483 | 924 | 1,559 | 73 | 33 | 40 |
| 2014-15 | 2,568 | 2,493 | 890 | 1,603 | 75 | 39 | 36 |
| 2015-16 | 2,767 | 2,587 | 928 | 1,659 | 180 | 62 | 118 |
| 2016-17 | 2,995 | 2,534 | 919 | 1,615 | 461 | 140 | 321 |
| 2017-18 | 3,100 | 2,571 | 941 | 1,630 | 529 | 137 | 392 |
| 2018-19 | 3,135 | 2,595 | 943 | 1,652 | 540 | 164 | 376 |
| 2019-20 | 3,203 | 2,611 | 925 | 1,686 | 592 | 192 | 400 |
| 2020-21 | 3,216 | 2,543 | 862 | 1,681 | 673 | 236 | 437 |
| 2021-22 | 3,174 | 2,574 | 887 | 1,687 | 600 | 203 | 397 |
| 2022-23 | 3,154 | 2,729 | 967 | 1,762 | 425 | 131 | 294 |
| Average | 2,987 | 2,987 | 919 | 1,653 | 2,987 | 134 | 281 |

Graduate Enrollment Changes
The average number of Graduate students over the last 11 years is 1,158 where 1,165 students are attending the Graduate school for the academic year 2022-2023. The following table and chart illustrate the changes in Graduate enrollment by attending status and gender at Point Loma Nazarene University since 2013.
| Year | Total | Full-time | Part-time | ||||
|---|---|---|---|---|---|---|---|
| Total | Men | Women | Total | Men | Women | ||
| 2013-14 | 803 | 186 | 57 | 129 | 617 | 171 | 446 |
| 2014-15 | 806 | 193 | 55 | 138 | 613 | 168 | 445 |
| 2015-16 | 896 | 290 | 88 | 202 | 606 | 162 | 444 |
| 2016-17 | 1,103 | 398 | 124 | 274 | 705 | 189 | 516 |
| 2017-18 | 1,317 | 484 | 152 | 332 | 833 | 239 | 594 |
| 2018-19 | 1,457 | 511 | 128 | 383 | 946 | 285 | 661 |
| 2019-20 | 1,364 | 511 | 121 | 390 | 853 | 252 | 601 |
| 2020-21 | 1,400 | 638 | 158 | 480 | 762 | 199 | 563 |
| 2021-22 | 1,271 | 559 | 156 | 403 | 712 | 215 | 497 |
| 2022-23 | 1,165 | 509 | 156 | 353 | 656 | 220 | 436 |
| Average | 1,158 | 1,158 | 120 | 308 | 1,158 | 210 | 520 |

Enrollment by Race/Ethnicity Changes
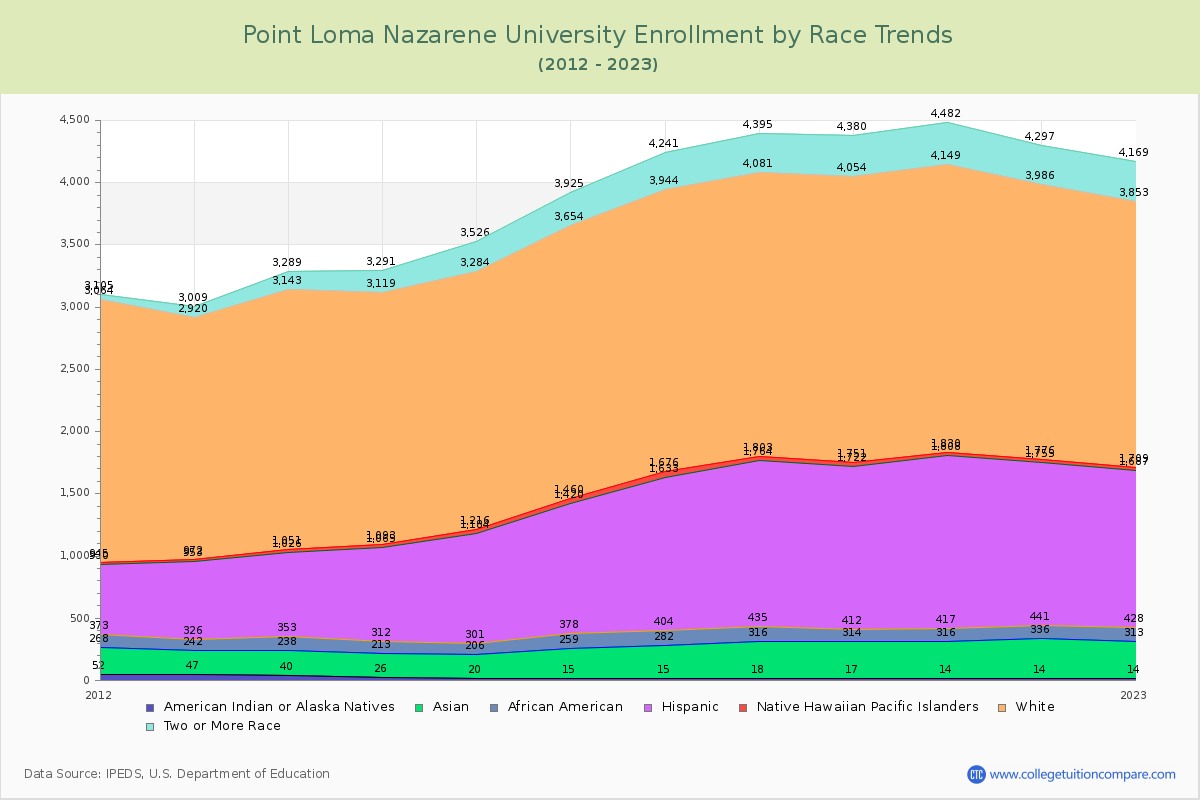
The percentage of white students is 49.64% and the percentage of black students is 2.66% at Point Loma Nazarene University. 6.92% of enrolled students is Asian.
The following table and chart illustrate the student population trends by race/ethnicity at Point Loma Nazarene University over the past 11 years (2013-2023).
| Year | American Indian or Native American | Asian | Black | Hispanic | Native Hawaiian or Other Pacific Islander | White | Two or More Races |
|---|---|---|---|---|---|---|---|
| 2013-14 | 40 | 198 | 115 | 673 | 25 | 2,092 | 146 |
| 2014-15 | 26 | 187 | 99 | 753 | 28 | 2,026 | 172 |
| 2015-16 | 20 | 186 | 95 | 883 | 32 | 2,068 | 242 |
| 2016-17 | 15 | 244 | 119 | 1,042 | 40 | 2,194 | 271 |
| 2017-18 | 15 | 267 | 122 | 1,229 | 43 | 2,268 | 297 |
| 2018-19 | 18 | 298 | 119 | 1,329 | 39 | 2,278 | 314 |
| 2019-20 | 17 | 297 | 98 | 1,310 | 29 | 2,303 | 326 |
| 2020-21 | 14 | 302 | 101 | 1,391 | 22 | 2,319 | 333 |
| 2021-22 | 14 | 322 | 105 | 1,314 | 21 | 2,210 | 311 |
| 2022-23 | 14 | 299 | 115 | 1,259 | 22 | 2,144 | 316 |
| Average | 19 | 260 | 109 | 1,118 | 30 | 2,190 | 273 |

Distance Learning (Online Courses) Enrollment Changes
537 students are enrolled in online degree programs exclusively for the academic year 2022-2023, which is 12% of total students. The number of online students has increased 1,578.13% since 2014. The following table and chart illustrate the changes in the online student population by enrolled type at Point Loma Nazarene University from 2014 to 2023.
| Year | Total Enrollment | Online Completely | Enrolled in Some Online Courses | Not Enrolled in Online Courses |
|---|---|---|---|---|
| 2014-15 | 3,374 | 32 | 360 | 2,982 |
| 2015-16 | 3,663 | 90 | 552 | 3,021 |
| 2016-17 | 4,098 | 158 | 543 | 3,397 |
| 2017-18 | 4,417 | 241 | 680 | 3,496 |
| 2018-19 | 4,592 | 200 | 827 | 3,565 |
| 2019-20 | 4,567 | 200 | 965 | 3,402 |
| 2020-21 | 4,616 | 274 | 1,321 | 3,021 |
| 2021-22 | 4,445 | 459 | 1,201 | 2,785 |
| 2022-23 | 4,319 | 537 | 1,262 | 2,520 |
| Average | 4,232 | 243 | 857 | 3,132 |
Ratings & Review
Share your experiences and thoughts about Point Loma Nazarene University. It will be a great help to applicants and prospective students!