At Pomona College, the average acceptance rate over the past 11 years is 8.97%, and 2024's acceptance rate is 6.76%. Pomona has beep kept its acceptance rate definitely low and it is very hard that applicants admit into the school.
The average yield (enrollment rate) over the period is 50.75%, and the 2024 yield is 49.82%.
The number of Pomona applicants increased by 13.64% (1,455 applicants) compared to the previous year.
Acceptance Rate Changes
The average acceptance rate over the last 10 years is 8.97%, and this year's acceptance rate is 6.76% at Pomona College. By gender, men students' acceptance rate is 10.73% and women students' rate is 7.73%. Pomona has beep kept its acceptance rate definitely low and it is very hard that applicants admit into the school.
The following table and chart illustrate the acceptance rates changes at Pomona College over the past 11 years (2013-2024).
| Year | Total | Men | Women |
|---|---|---|---|
| 2013-14 | 13.92% | 16.92% | 12.00% |
| 2014-15 | 12.19% -1.73% |
15.18% -1.74% |
10.16% -1.84% |
| 2015-16 | 10.30% -1.89% |
12.09% -3.09% |
9.11% -1.05% |
| 2016-17 | 9.44% -0.86% |
12.36% 0.27% |
7.61% -1.49% |
| 2017-18 | 8.36% -1.08% |
10.20% -2.16% |
7.20% -0.42% |
| 2018-19 | 7.61% -0.74% |
9.21% -0.99% |
6.60% -0.60% |
| 2019-20 | 7.40% -0.21% |
9.39% 0.18% |
6.13% -0.47% |
| 2020-21 | 8.62% 1.21% |
10.09% 0.69% |
7.64% 1.52% |
| 2021-22 | 7.00% -1.62% |
6.99% -3.10% |
6.01% -1.64% |
| 2022-23 | 7.02% 0.03% |
7.99% 1.00% |
6.38% 0.38% |
| 2023-24 | 6.76% -0.27% |
7.56% -0.43% |
6.17% -0.22% |
| Average | 8.97% | 10.73% | 7.73% |

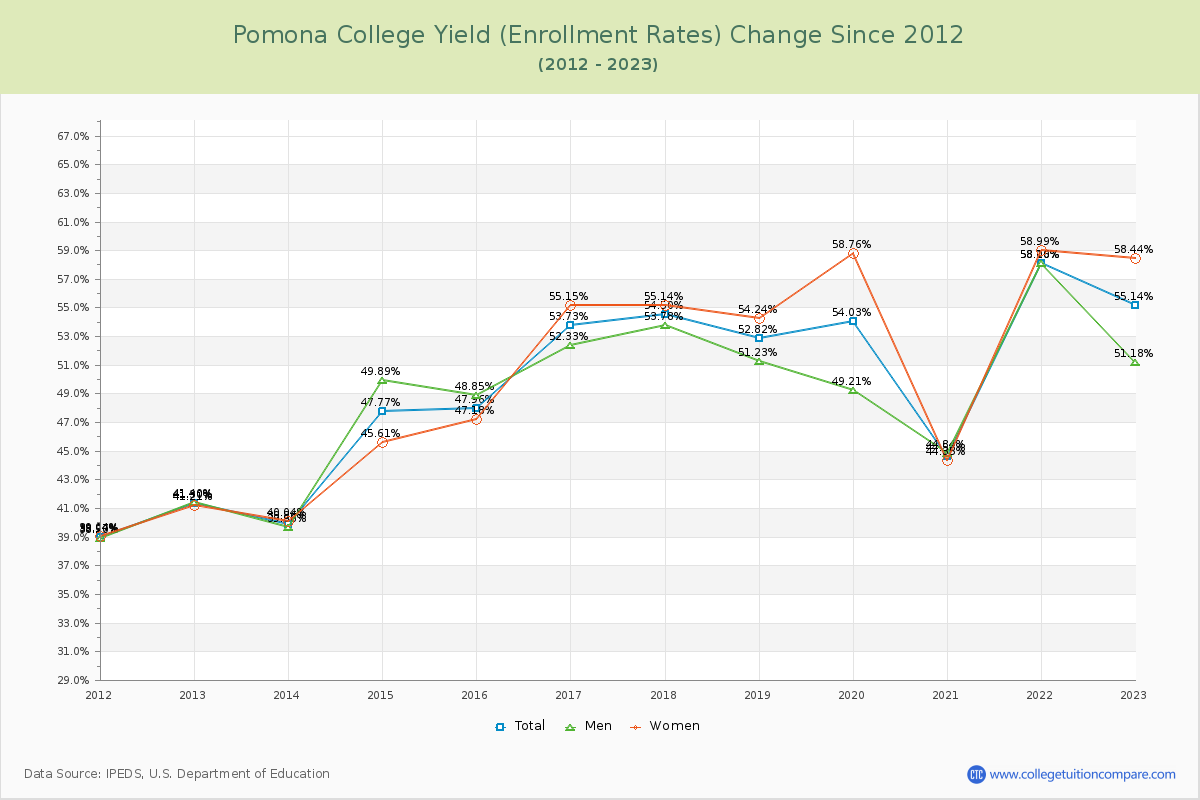
Admission Yield (Enrollment Rate) Changes
The average admission yield of the last 11 years is 50.75% where the current academic year yield is 49.82%.
The following table and chart illustrate the changes in yield at Pomona College from 2013 to 2024.
| Year | Total | Men | Women |
|---|---|---|---|
| 2013-14 | 39.86% | 39.66% | 40.04% |
| 2014-15 | 47.77% 7.91% |
49.89% 10.23% |
45.61% 5.57% |
| 2015-16 | 47.96% 0.19% |
48.85% -1.05% |
47.18% 1.57% |
| 2016-17 | 53.73% 5.76% |
52.33% 3.48% |
55.15% 7.97% |
| 2017-18 | 54.50% 0.77% |
53.78% 1.45% |
55.14% -0.01% |
| 2018-19 | 52.82% -1.68% |
51.23% -2.56% |
54.24% -0.90% |
| 2019-20 | 54.03% 1.21% |
49.21% -2.01% |
58.76% 4.53% |
| 2020-21 | 44.58% -9.45% |
44.84% -4.37% |
44.35% -14.41% |
| 2021-22 | 58.06% 13.48% |
58.10% 13.26% |
58.99% 14.64% |
| 2022-23 | 55.14% -2.92% |
51.18% -6.93% |
58.44% -0.56% |
| 2023-24 | 49.82% -5.32% |
50.13% -1.04% |
49.32% -9.12% |
| Average | 50.75% | 49.93% | 51.56% |
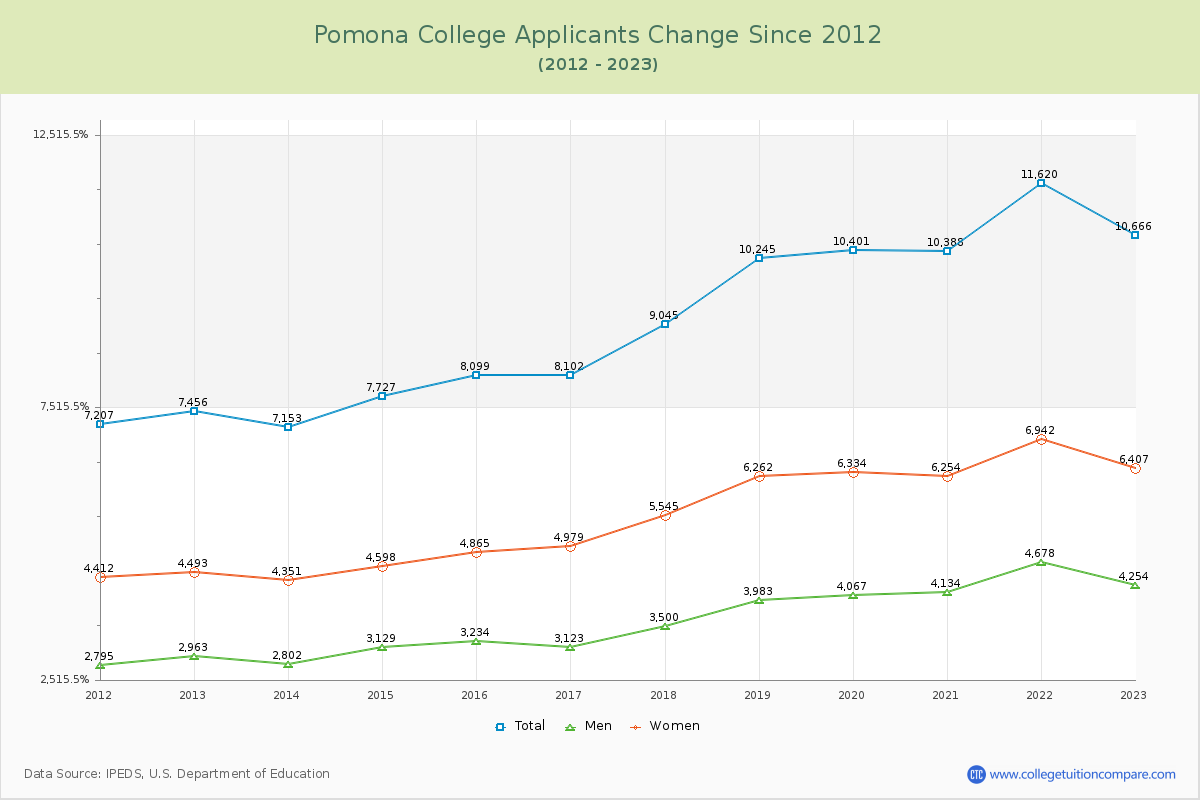
Applicants, Admitted, and Enrolled Headcount Changes
Over the past 10 years, The average number of applicants is 9,597, the average number of admitted is 829, and the average number of first-year enrolled students is 417.
The number of Pomona applicants increased by 13.64% (1,455 applicants) compared to the previous year.
The following table and chart show the changes of applicants, admitted, and enrolled headcount at Pomona College from 2013 to 2024.
| Year | Applicants | Admitted | Enrolled |
|---|---|---|---|
| 2013-14 | 7,153 | 996 | 397 |
| 2014-15 | 7,727 8.02% |
942 -5.42% |
450 13.35% |
| 2015-16 | 8,099 4.81% |
834 -11.46% |
400 -11.11% |
| 2016-17 | 8,102 0.04% |
765 -8.27% |
411 2.75% |
| 2017-18 | 9,045 11.64% |
756 -1.18% |
412 0.24% |
| 2018-19 | 10,245 13.27% |
780 3.17% |
412 |
| 2019-20 | 10,401 1.52% |
770 -1.28% |
416 0.97% |
| 2020-21 | 10,388 -0.12% |
895 16.23% |
399 -4.09% |
| 2021-22 | 11,620 11.86% |
813 -9.16% |
472 18.30% |
| 2022-23 | 10,666 -8.21% |
749 -7.87% |
413 -12.50% |
| 2023-24 | 12,121 13.64% |
819 9.35% |
408 -1.21% |
| Average | 9,597 | 829 | 417 |
Compare Acceptance Rate Change to Similar Colleges
The following table compares acceptance rate changes from last year between Pomona College and similar schools.
| 2024 | 2023 | Change % | |
|---|---|---|---|
| Pomona College | 7.00% | 7.02% | -0.28% |
| Amherst College | 10.00% | 7.26% | 37.74% |
| University of Southern California | 10.00% | 12.02% | -16.81% |
| University of the People | - | - | - |
| National University | - | 54.55% | -100.00% |
| Stanford University | 4.00% | 3.68% | 8.70% |
Ratings & Review
Share your experiences and thoughts about Pomona College. It will be a great help to applicants and prospective students!