At Rice University, the average acceptance rate over the past 11 years is 12.29%, and 2024's acceptance rate is 7.88%. Rice's acceptance rate has been lower every year for the past 3 years. Rice has beep kept its acceptance rate very low and it is hard that applicants admit into the school.
The average yield (enrollment rate) over the period is 39.45%, and the 2024 yield is 45.97%.
The number of Rice applicants decreased by -1.22% (384 applicants) compared to the previous year.
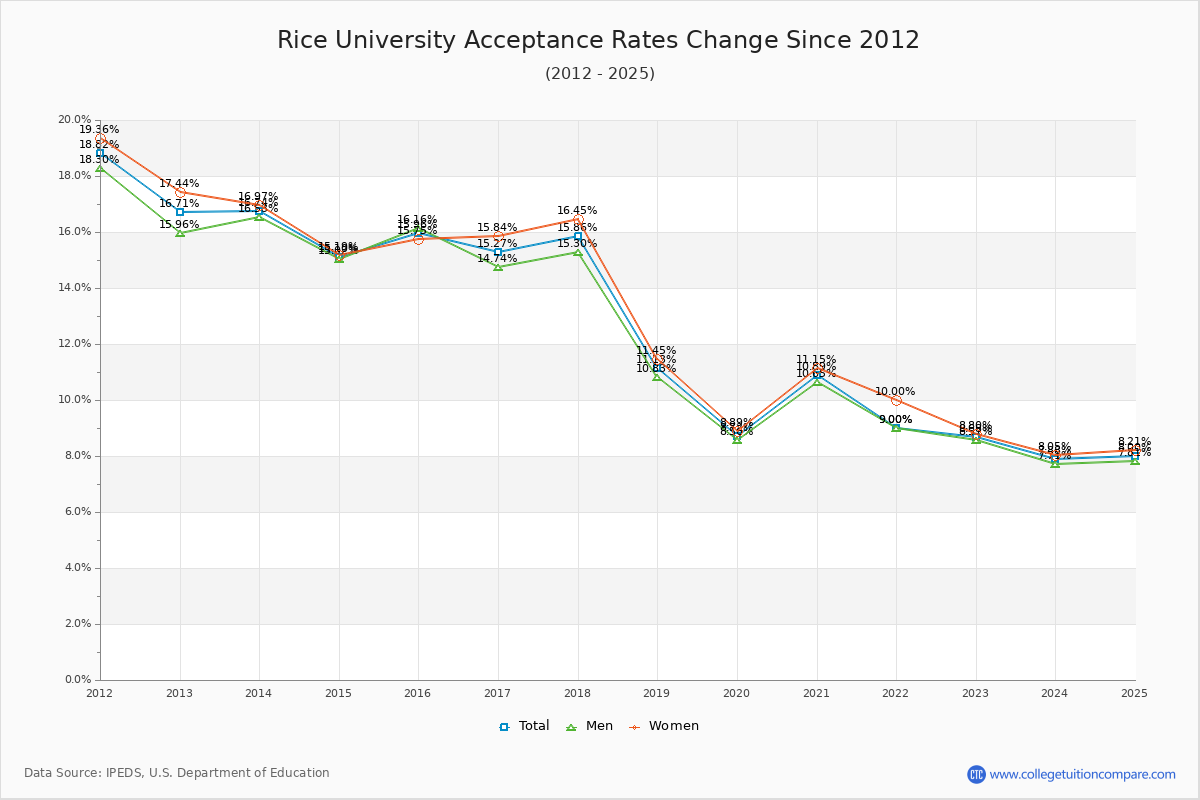
Acceptance Rate Changes
The average acceptance rate over the last 10 years is 12.29%, and this year's acceptance rate is 7.88% at Rice University. By gender, men students' acceptance rate is 12.10% and women students' rate is 12.59%. Rice has beep kept its acceptance rate very low and it is hard that applicants admit into the school.
The following table and chart illustrate the acceptance rates changes at Rice University over the past 11 years (2013-2024).
| Year | Total | Men | Women |
|---|---|---|---|
| 2013-14 | 16.74% | 16.53% | 16.97% |
| 2014-15 | 15.10% -1.64% |
15.02% -1.51% |
15.19% -1.78% |
| 2015-16 | 15.96% 0.86% |
16.16% 1.14% |
15.75% 0.56% |
| 2016-17 | 15.27% -0.69% |
14.74% -1.42% |
15.84% 0.09% |
| 2017-18 | 15.86% 0.58% |
15.30% 0.57% |
16.45% 0.61% |
| 2018-19 | 11.13% -4.73% |
10.83% -4.47% |
11.45% -5.00% |
| 2019-20 | 8.72% -2.41% |
8.56% -2.27% |
8.89% -2.57% |
| 2020-21 | 10.89% 2.18% |
10.65% 2.09% |
11.15% 2.27% |
| 2021-22 | 9.00% -1.89% |
9.00% -1.65% |
10.00% -1.15% |
| 2022-23 | 8.68% -0.32% |
8.57% -0.43% |
8.80% -1.20% |
| 2023-24 | 7.88% -0.80% |
7.71% -0.85% |
8.05% -0.75% |
| Average | 12.29% | 12.10% | 12.59% |
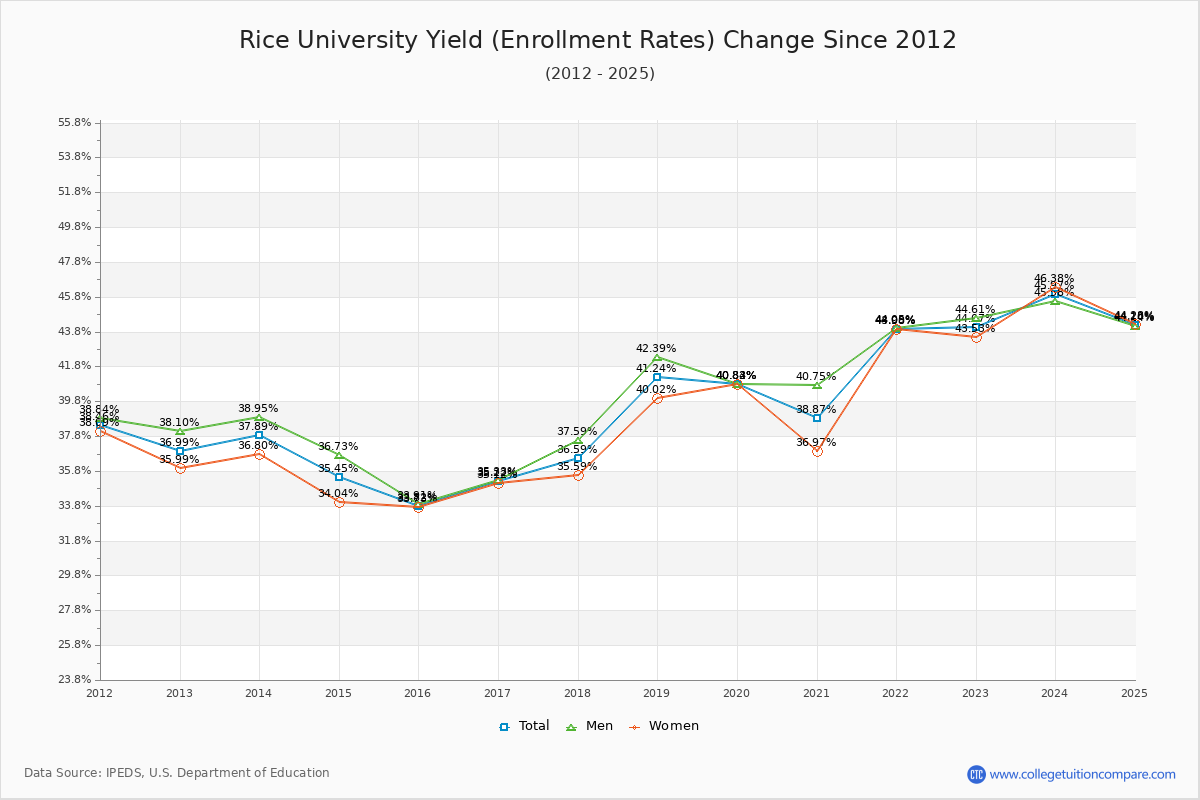
Admission Yield (Enrollment Rate) Changes
The average admission yield of the last 11 years is 39.45% where the current academic year yield is 45.97%.
The following table and chart illustrate the changes in yield at Rice University from 2013 to 2024.
| Year | Total | Men | Women |
|---|---|---|---|
| 2013-14 | 37.89% | 38.95% | 36.80% |
| 2014-15 | 35.45% -2.44% |
36.73% -2.22% |
34.04% -2.76% |
| 2015-16 | 33.82% -1.63% |
33.91% -2.83% |
33.73% -0.31% |
| 2016-17 | 35.22% 1.40% |
35.33% 1.43% |
35.12% 1.39% |
| 2017-18 | 36.59% 1.37% |
37.59% 2.25% |
35.59% 0.48% |
| 2018-19 | 41.24% 4.64% |
42.39% 4.80% |
40.02% 4.42% |
| 2019-20 | 40.83% -0.41% |
40.84% -1.55% |
40.82% 0.80% |
| 2020-21 | 38.87% -1.97% |
40.75% -0.09% |
36.97% -3.85% |
| 2021-22 | 44.00% 5.14% |
44.05% 3.30% |
43.98% 7.01% |
| 2022-23 | 44.07% 0.06% |
44.61% 0.56% |
43.53% -0.45% |
| 2023-24 | 45.97% 1.91% |
45.58% 0.97% |
46.38% 2.84% |
| Average | 39.45% | 40.07% | 38.82% |
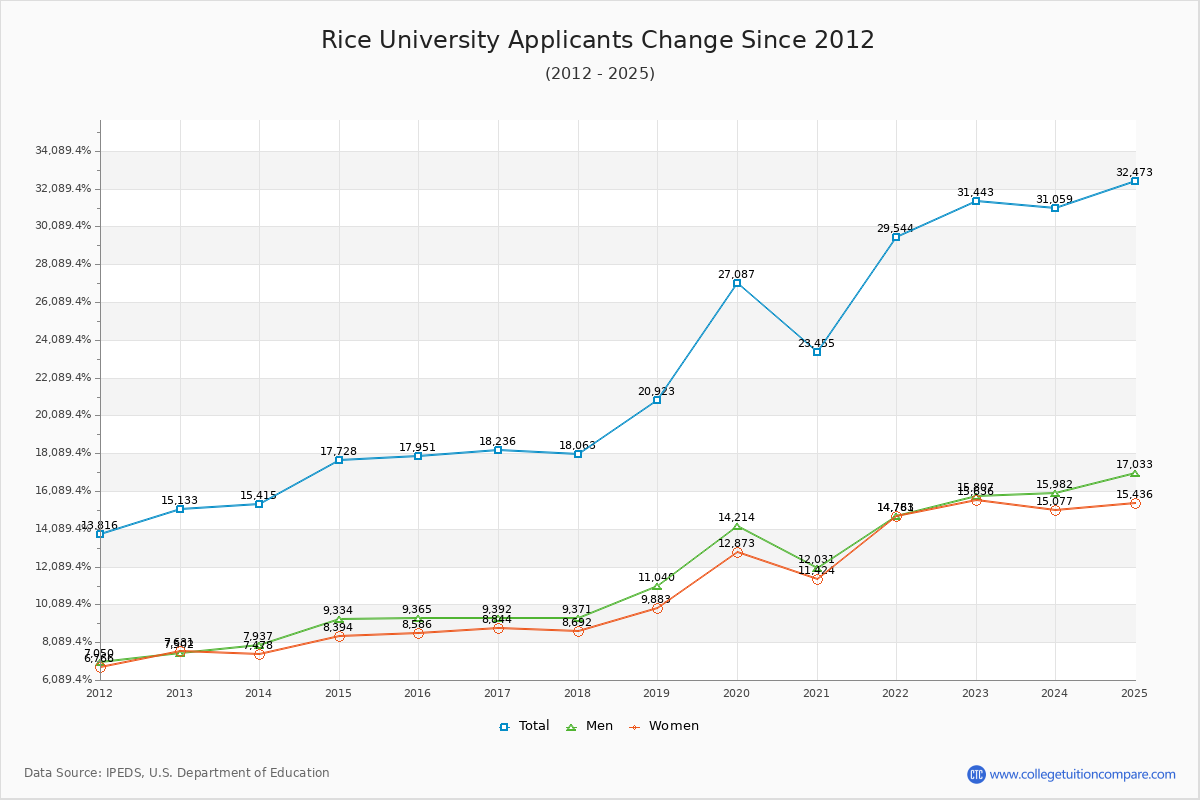
Applicants, Admitted, and Enrolled Headcount Changes
Over the past 10 years, The average number of applicants is 22,809, the average number of admitted is 2,623, and the average number of first-year enrolled students is 1,031.
The number of Rice applicants decreased by -1.22% (384 applicants) compared to the previous year.
The following table and chart show the changes of applicants, admitted, and enrolled headcount at Rice University from 2013 to 2024.
| Year | Applicants | Admitted | Enrolled |
|---|---|---|---|
| 2013-14 | 15,415 | 2,581 | 978 |
| 2014-15 | 17,728 15.00% |
2,677 3.72% |
949 -2.97% |
| 2015-16 | 17,951 1.26% |
2,865 7.02% |
969 2.11% |
| 2016-17 | 18,236 1.59% |
2,785 -2.79% |
981 1.24% |
| 2017-18 | 18,063 -0.95% |
2,864 2.84% |
1,048 6.83% |
| 2018-19 | 20,923 15.83% |
2,328 -18.72% |
960 -8.40% |
| 2019-20 | 27,087 29.46% |
2,361 1.42% |
964 0.42% |
| 2020-21 | 23,455 -13.41% |
2,555 8.22% |
993 3.01% |
| 2021-22 | 29,544 25.96% |
2,659 4.07% |
1,170 17.82% |
| 2022-23 | 31,443 6.43% |
2,730 2.67% |
1,203 2.82% |
| 2023-24 | 31,059 -1.22% |
2,447 -10.37% |
1,125 -6.48% |
| Average | 22,809 | 2,623 | 1,031 |
Compare Acceptance Rate Change to Similar Colleges
The following table compares acceptance rate changes from last year between Rice University and similar schools.
| 2024 | 2023 | Change % | |
|---|---|---|---|
| Rice University | 8.00% | 8.68% | -7.83% |
| University of Alabama at Birmingham | 88.00% | 86.68% | 1.52% |
| Western Kentucky University | 96.99% | 96.95% | 0.04% |
| University of Southern Mississippi | 99.00% | 98.84% | 0.16% |
| Louisiana Tech University | 73.00% | 62.37% | 17.04% |
| University of North Carolina at Charlotte | 80.00% | 79.64% | 0.45% |
Ratings & Review
Share your experiences and thoughts about Rice University. It will be a great help to applicants and prospective students!