Over the past 11 years, the average SAT score of Rice University is 1508, and current year SAT score is 1550
The SAT score have been increased 90 points since 2013. The SAT score has risen almost every year over the past decade, and have continued to rise especially recent years at Rice. Compared to previous year, the SAT score increased by 10 points at Rice. Compared to similar schools, the submitted SAT and ACT scores are extremely competitive and high at Rice.
You can check and compare colleges with similar SAT scores Rice by SAT score range 1450-1550 and 1550+.
SAT Scores Over Time
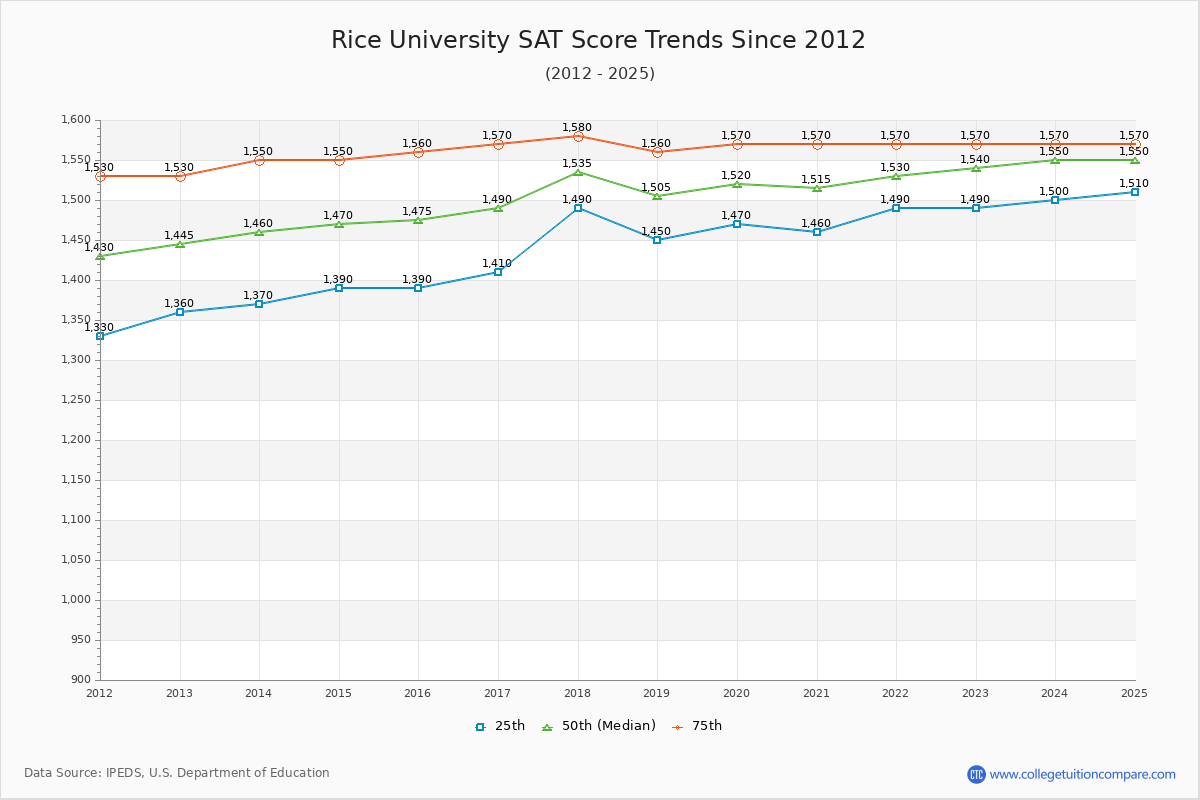
The 2024 SAT score is 1550 at Rice. Over the past 12 years, the average SAT score is 1446 (25th percentile) and 1565 (75th percentile). Compared to similar schools, the submitted SAT scores are extremely competitive and high at Rice.
The following table and chart illustrate the changes in SAT scores at Rice University since 2013.
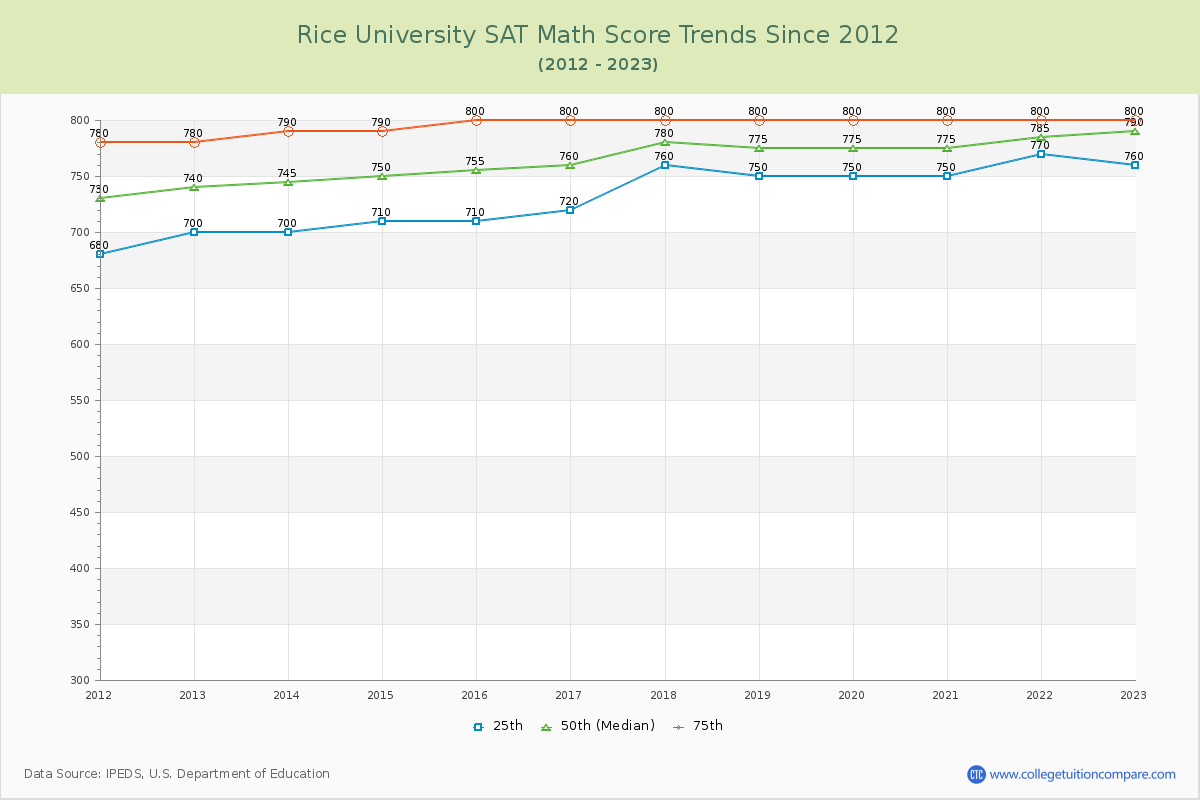
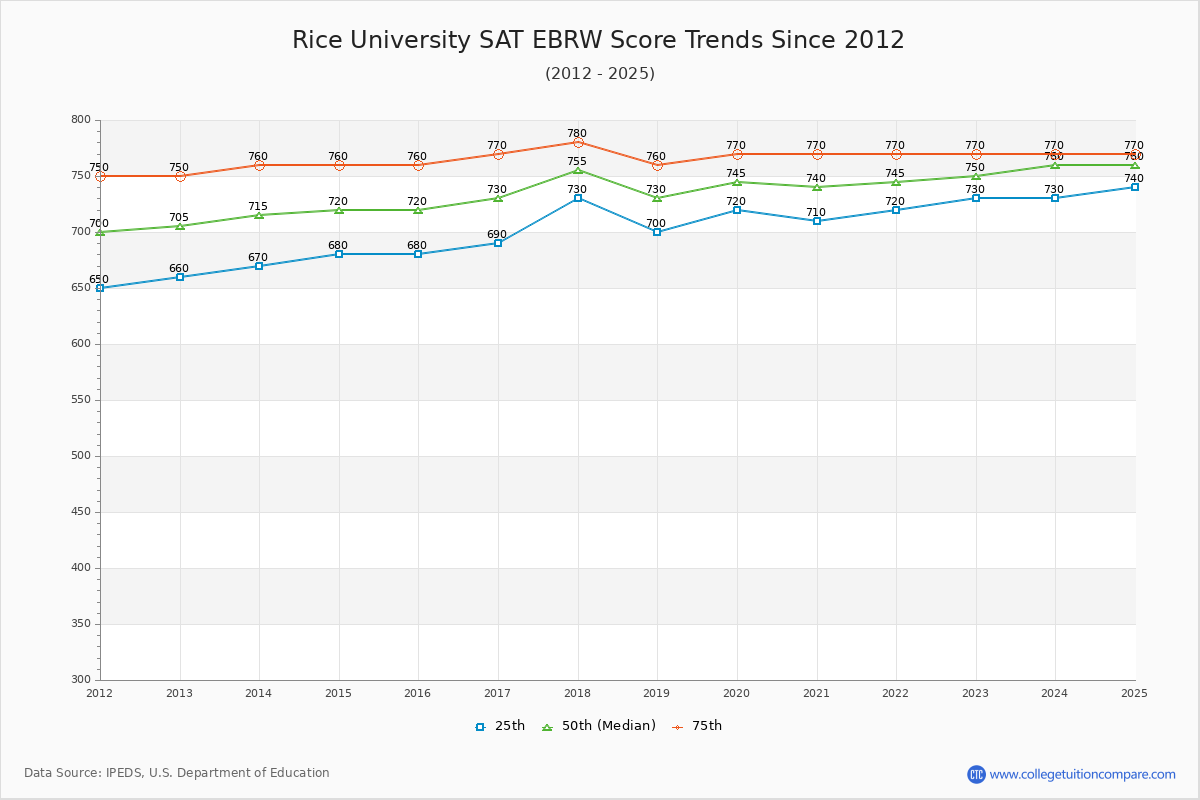
| Year | Total | Math | Evidence-Based Reading and Writing | ||||||
|---|---|---|---|---|---|---|---|---|---|
| 25th | 50th | 75th | 25th | 50th | 75th | 25th | 50th | 75th | |
| 2013-14 | 1,370 | 1,460 | 1,550 | 700 | 745 | 790 | 670 | 715 | 760 |
| 2014-15 | 1,390 | 1,470 | 1,550 | 710 | 750 | 790 | 680 | 720 | 760 |
| 2015-16 | 1,390 | 1,475 | 1,560 | 710 | 755 | 800 | 680 | 720 | 760 |
| 2016-17 | 1,410 | 1,490 | 1,570 | 720 | 760 | 800 | 690 | 730 | 770 |
| 2017-18 | 1,490 | 1,535 | 1,580 | 760 | 780 | 800 | 730 | 755 | 780 |
| 2018-19 | 1,450 | 1,505 | 1,560 | 750 | 775 | 800 | 700 | 730 | 760 |
| 2019-20 | 1,470 | 1,520 | 1,570 | 750 | 775 | 800 | 720 | 745 | 770 |
| 2020-21 | 1,460 | 1,515 | 1,570 | 750 | 775 | 800 | 710 | 740 | 770 |
| 2021-22 | 1,490 | 1,530 | 1,570 | 770 | 785 | 800 | 720 | 745 | 770 |
| 2022-23 | 1,490 | 1,540 | 1,570 | 760 | 790 | 800 | 730 | 750 | 770 |
| 2023-24 | 1,500 | 1,550 | 1,570 | 770 | 790 | 800 | 730 | 760 | 770 |
| Average | 1446 | 1508 | 1565 | 741 | 771 | 798 | 705 | 737 | 767 |
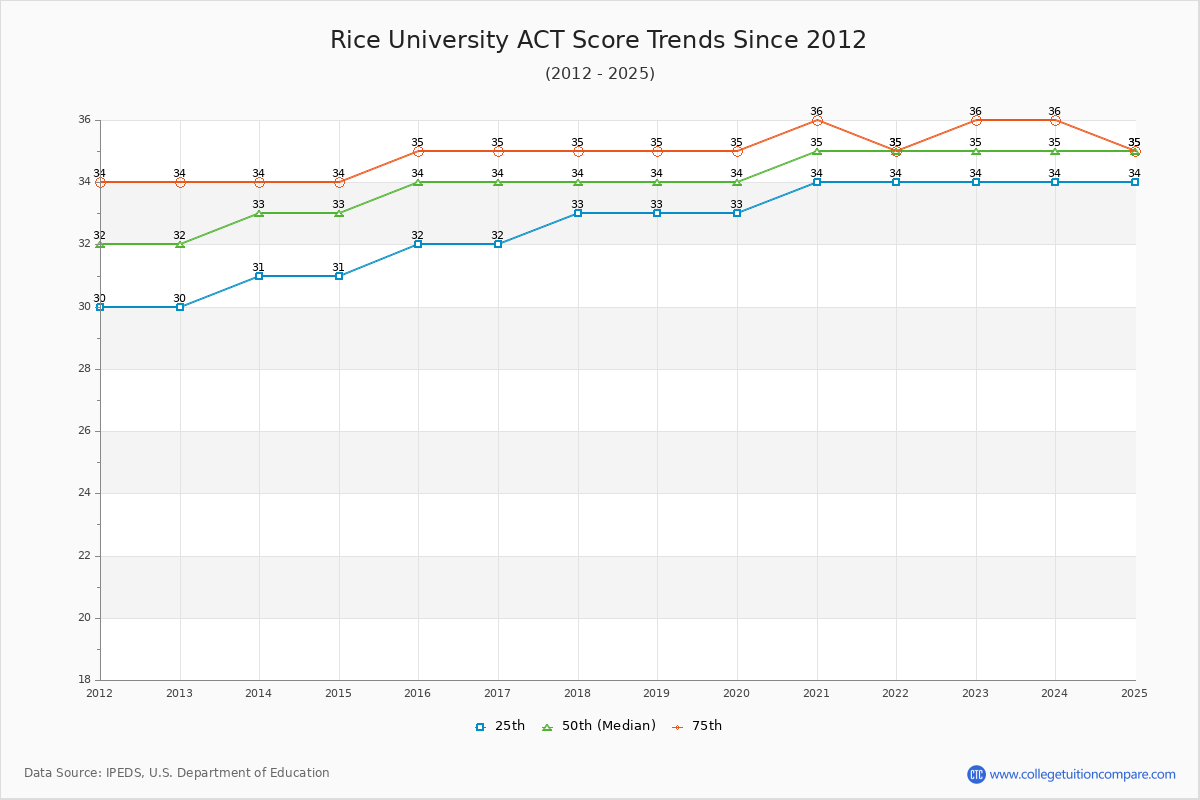
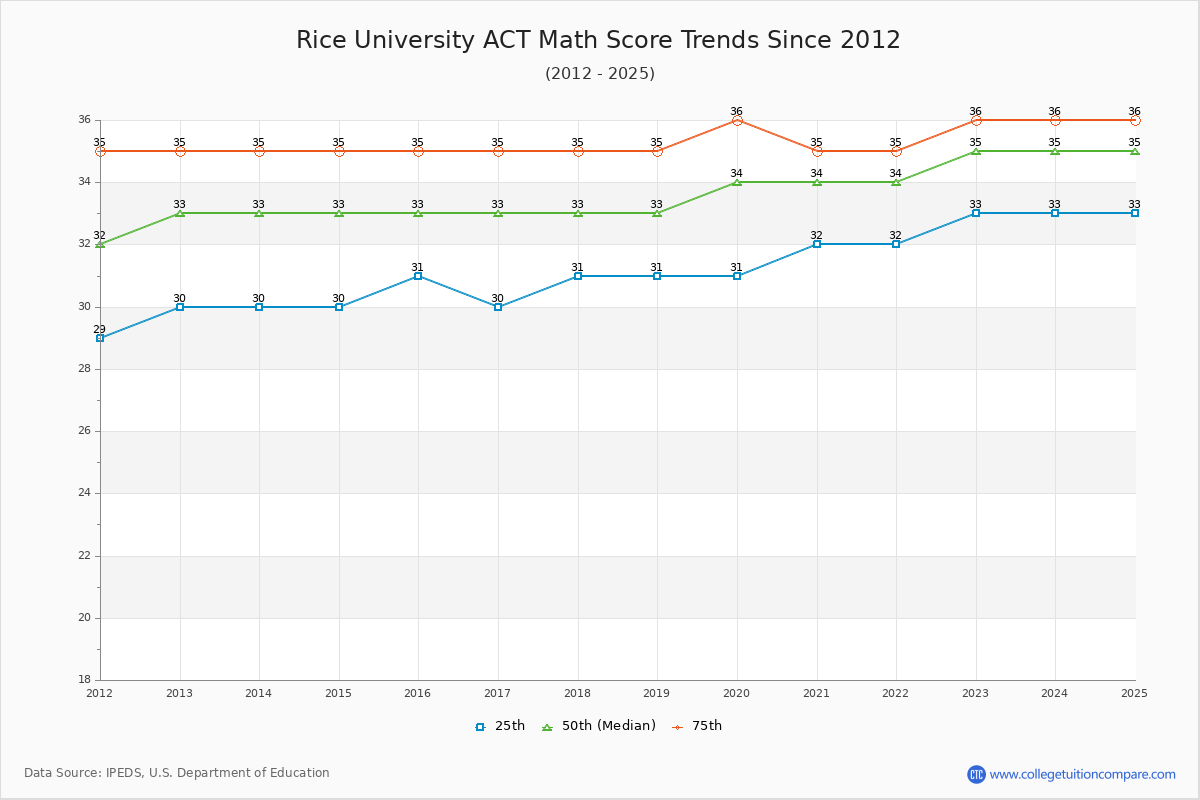
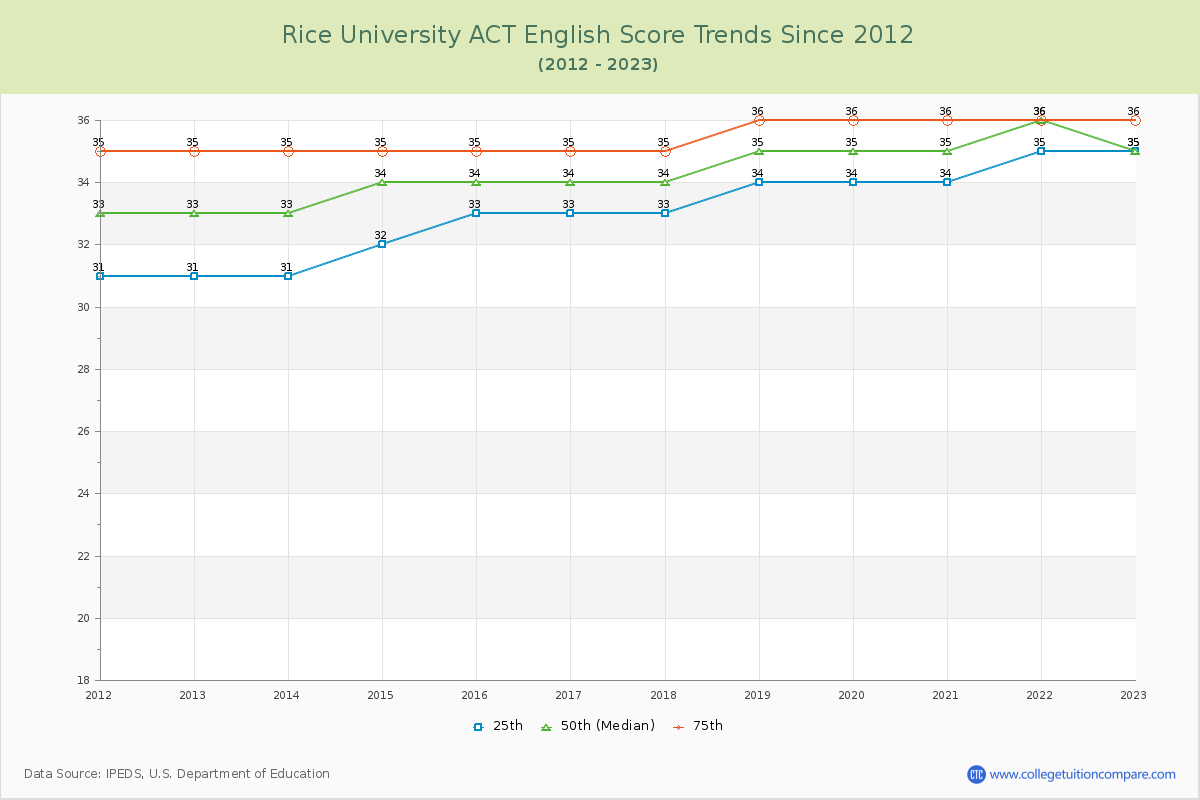
ACT Scores Over Time
The 2024 ACT score is 35 at Rice. Over the past 12 years, the average ACT score of the last 12 years is 33 (25th percentile) and 35 (75th percentile). Compared to similar schools, the submitted ACT scores are extremely competitive and high at Rice.
The following table and chart show the changes in ACT scores at Rice University since 2013.
| Year | Composite | English | Math | ||||||
|---|---|---|---|---|---|---|---|---|---|
| 25th | 50th | 75th | 25th | 50th | 75th | 25th | 50th | 75th | |
| 2013-14 | 31 | 33 | 34 | 31 | 33 | 35 | 30 | 33 | 35 |
| 2014-15 | 31 | 33 | 34 | 32 | 34 | 35 | 30 | 33 | 35 |
| 2015-16 | 32 | 34 | 35 | 33 | 34 | 35 | 31 | 33 | 35 |
| 2016-17 | 32 | 34 | 35 | 33 | 34 | 35 | 30 | 33 | 35 |
| 2017-18 | 33 | 34 | 35 | 33 | 34 | 35 | 31 | 33 | 35 |
| 2018-19 | 33 | 34 | 35 | 34 | 35 | 36 | 31 | 33 | 35 |
| 2019-20 | 33 | 34 | 35 | 34 | 35 | 36 | 31 | 34 | 36 |
| 2020-21 | 34 | 35 | 36 | 34 | 35 | 36 | 32 | 34 | 35 |
| 2021-22 | 34 | 35 | 35 | 35 | 36 | 36 | 32 | 34 | 35 |
| 2022-23 | 34 | 35 | 36 | 35 | 35 | 36 | 33 | 35 | 36 |
| 2023-24 | 34 | 35 | 36 | 35 | 35 | 36 | 33 | 35 | 36 |
| Average | 33 | 34 | 35 | 34 | 34 | 36 | 31 | 33 | 35 |
Compare SAT Score Change to Similar Colleges
The following table compares SAT score changes from last year between Rice University and similar schools.
| 2024 | 2023 | Change % | |
|---|---|---|---|
| Rice University | 1540 | 1530 | 0.65% |
| Florida International University | 1150 | 1150 | - |
| University of North Carolina at Charlotte | 1180 | 1220 | -3.28% |
| The University of Texas at El Paso | 980 | - | - |
| University of North Texas | 1120 | 1125 | -0.44% |
| The University of Texas at San Antonio | 1110 | 1120 | -0.89% |
Ratings & Review
Share your experiences and thoughts about Rice University. It will be a great help to applicants and prospective students!