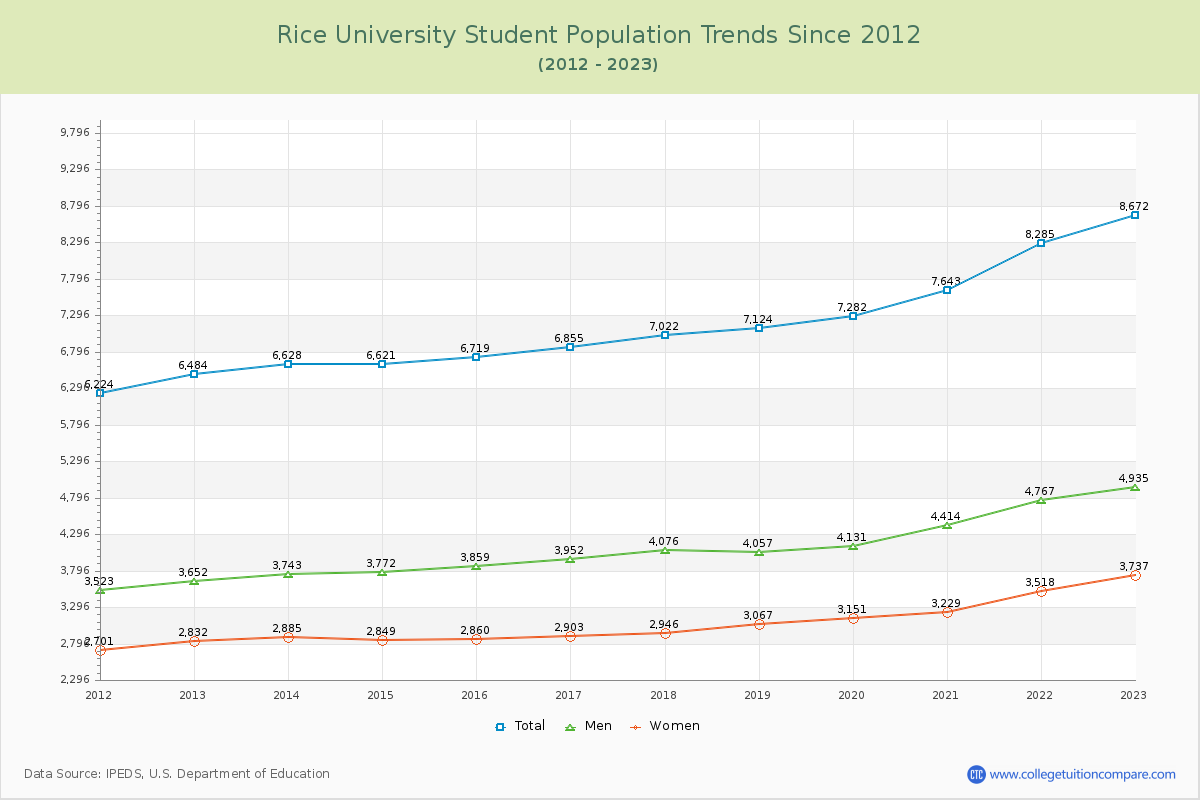
The student population at Rice University is 8,672 (4,494 undergraduate and 4,178 graduate students) . The number of students has increased by 2,044 over the past decade.
The percentage of undergraduate students at Rice is 51.82% which is increased by 529 over last 10 years. The graduate student population increased by 1,515 and it has been increasing.
The female to male ratio is 0.76 to 1 which means that male students enrolled more than female students.
498 students enrolled in online degree program exclusively and the number of online students has decreased by % since 2014.
Student Population Changes
The average student population over the last 11 years is 7,285 where 8,672 students are attending the school for the academic year 2022-2023.
51.82% of total students is undergraduate students and 48.18% students is graduate students. The number of undergraduate students has increased by 529 and the graduate enrollment has increased by 1,515 over past 10 years.
The female to male ratio is 0.76 to 1 and it means that there are more male students enrolled in Rice than female students.
The following table and chart illustrate the changes in student population by gender at Rice University since 2013.
| Year | Total | Undergraduate | Graduate | ||||
|---|---|---|---|---|---|---|---|
| Total | Men | Women | Total | Men | Women | ||
| 2013-14 | 6,628 | 3,965 | 2,041 | 1,924 | 2,663 | 1,702 | 961 |
| 2014-15 | 6,621 -7 | 3,926 -39 | 2,047 6 | 1,879 -45 | 2,695 32 | 1,725 23 | 970 9 |
| 2015-16 | 6,719 98 | 3,910 -16 | 2,062 15 | 1,848 -31 | 2,809 114 | 1,797 72 | 1,012 42 |
| 2016-17 | 6,855 136 | 3,893 -17 | 2,042 -20 | 1,851 3 | 2,962 153 | 1,910 113 | 1,052 40 |
| 2017-18 | 7,022 167 | 4,001 108 | 2,112 70 | 1,889 38 | 3,021 59 | 1,964 54 | 1,057 5 |
| 2018-19 | 7,124 102 | 3,992 -9 | 2,086 -26 | 1,906 17 | 3,132 111 | 1,971 7 | 1,161 104 |
| 2019-20 | 7,282 158 | 3,989 -3 | 2,066 -20 | 1,923 17 | 3,293 161 | 2,065 94 | 1,228 67 |
| 2020-21 | 7,643 361 | 4,076 87 | 2,131 65 | 1,945 22 | 3,567 274 | 2,283 218 | 1,284 56 |
| 2021-22 | 8,285 642 | 4,247 171 | 2,187 56 | 2,060 115 | 4,038 471 | 2,580 297 | 1,458 174 |
| 2022-23 | 8,672 387 | 4,494 247 | 2,297 110 | 2,197 137 | 4,178 140 | 2,638 58 | 1,540 82 |
| Average | 7,285 | 4,049 | 2,107 | 1,942 | 3,236 | 2,064 | 1,172 |

Undergraduate Enrollment Changes
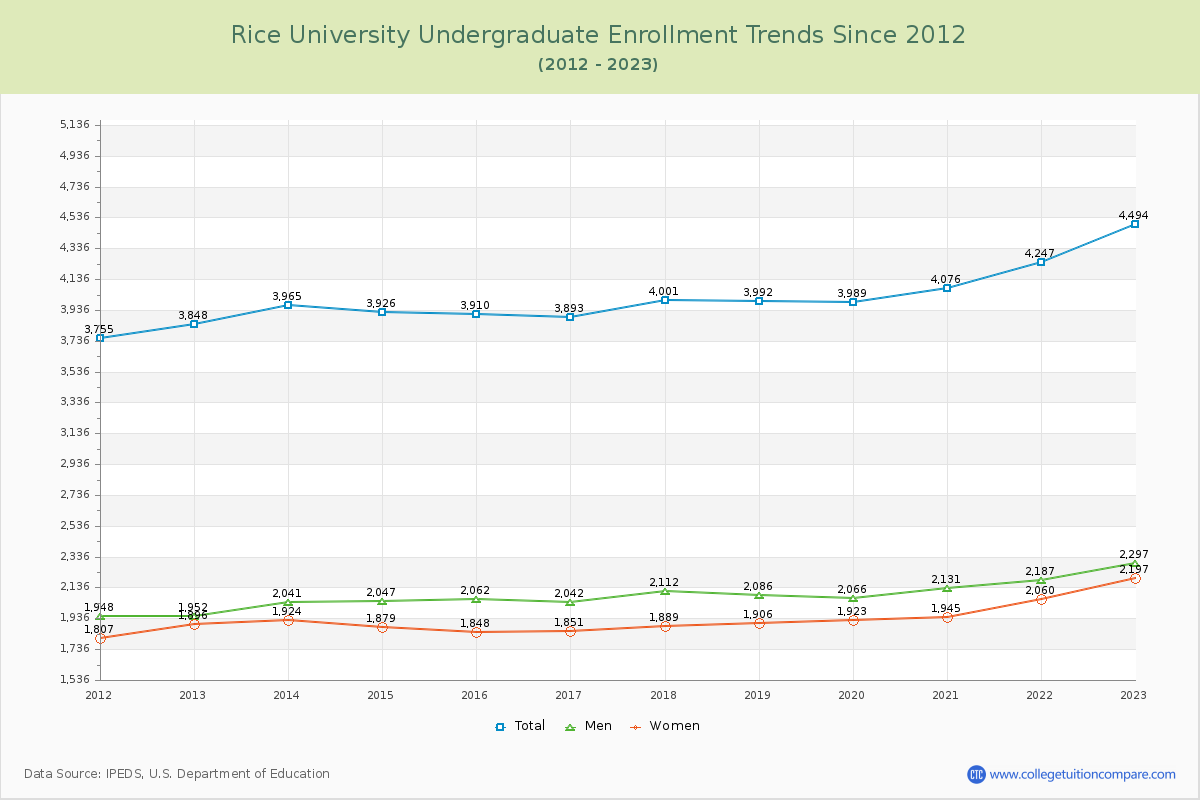
The average number of Undergraduate students over the last 11 years is 4,049 where 4,494 students are attending the Undergraduate school for the academic year 2022-2023. The following table and chart illustrate the changes in Undergraduate enrollment by attending status and gender at Rice University since 2013.
| Year | Total | Full-time | Part-time | ||||
|---|---|---|---|---|---|---|---|
| Total | Men | Women | Total | Men | Women | ||
| 2013-14 | 3,965 | 3,904 | 1,995 | 1,909 | 61 | 46 | 15 |
| 2014-15 | 3,926 | 3,872 | 2,015 | 1,857 | 54 | 32 | 22 |
| 2015-16 | 3,910 | 3,863 | 2,035 | 1,828 | 47 | 27 | 20 |
| 2016-17 | 3,893 | 3,836 | 2,004 | 1,832 | 57 | 38 | 19 |
| 2017-18 | 4,001 | 3,916 | 2,069 | 1,847 | 85 | 43 | 42 |
| 2018-19 | 3,992 | 3,899 | 2,028 | 1,871 | 93 | 58 | 35 |
| 2019-20 | 3,989 | 3,942 | 2,038 | 1,904 | 47 | 28 | 19 |
| 2020-21 | 4,076 | 3,960 | 2,066 | 1,894 | 116 | 65 | 51 |
| 2021-22 | 4,247 | 4,156 | 2,143 | 2,013 | 91 | 44 | 47 |
| 2022-23 | 4,494 | 4,393 | 2,241 | 2,152 | 101 | 56 | 45 |
| Average | 4,049 | 4,049 | 2,063 | 1,911 | 4,049 | 44 | 32 |

Graduate Enrollment Changes
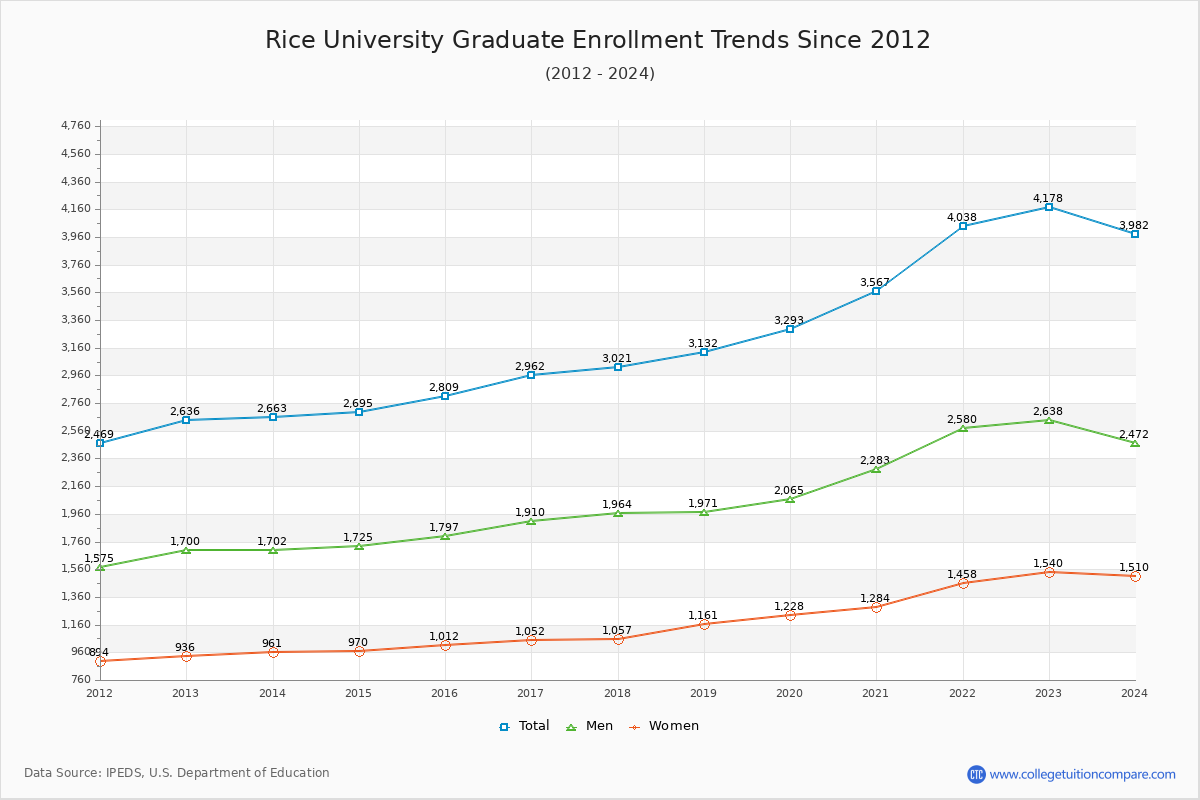
The average number of Graduate students over the last 11 years is 3,236 where 4,178 students are attending the Graduate school for the academic year 2022-2023. The following table and chart illustrate the changes in Graduate enrollment by attending status and gender at Rice University since 2013.
| Year | Total | Full-time | Part-time | ||||
|---|---|---|---|---|---|---|---|
| Total | Men | Women | Total | Men | Women | ||
| 2013-14 | 2,663 | 2,452 | 1,602 | 850 | 211 | 100 | 111 |
| 2014-15 | 2,695 | 2,479 | 1,616 | 863 | 216 | 109 | 107 |
| 2015-16 | 2,809 | 2,609 | 1,707 | 902 | 200 | 90 | 110 |
| 2016-17 | 2,962 | 2,729 | 1,794 | 935 | 233 | 116 | 117 |
| 2017-18 | 3,021 | 2,781 | 1,822 | 959 | 240 | 142 | 98 |
| 2018-19 | 3,132 | 2,866 | 1,835 | 1,031 | 266 | 136 | 130 |
| 2019-20 | 3,293 | 3,019 | 1,911 | 1,108 | 274 | 154 | 120 |
| 2020-21 | 3,567 | 3,196 | 2,045 | 1,151 | 371 | 238 | 133 |
| 2021-22 | 4,038 | 3,692 | 2,360 | 1,332 | 346 | 220 | 126 |
| 2022-23 | 4,178 | 3,605 | 2,272 | 1,333 | 573 | 366 | 207 |
| Average | 3,236 | 3,236 | 1,896 | 1,046 | 3,236 | 167 | 126 |

Enrollment by Race/Ethnicity Changes
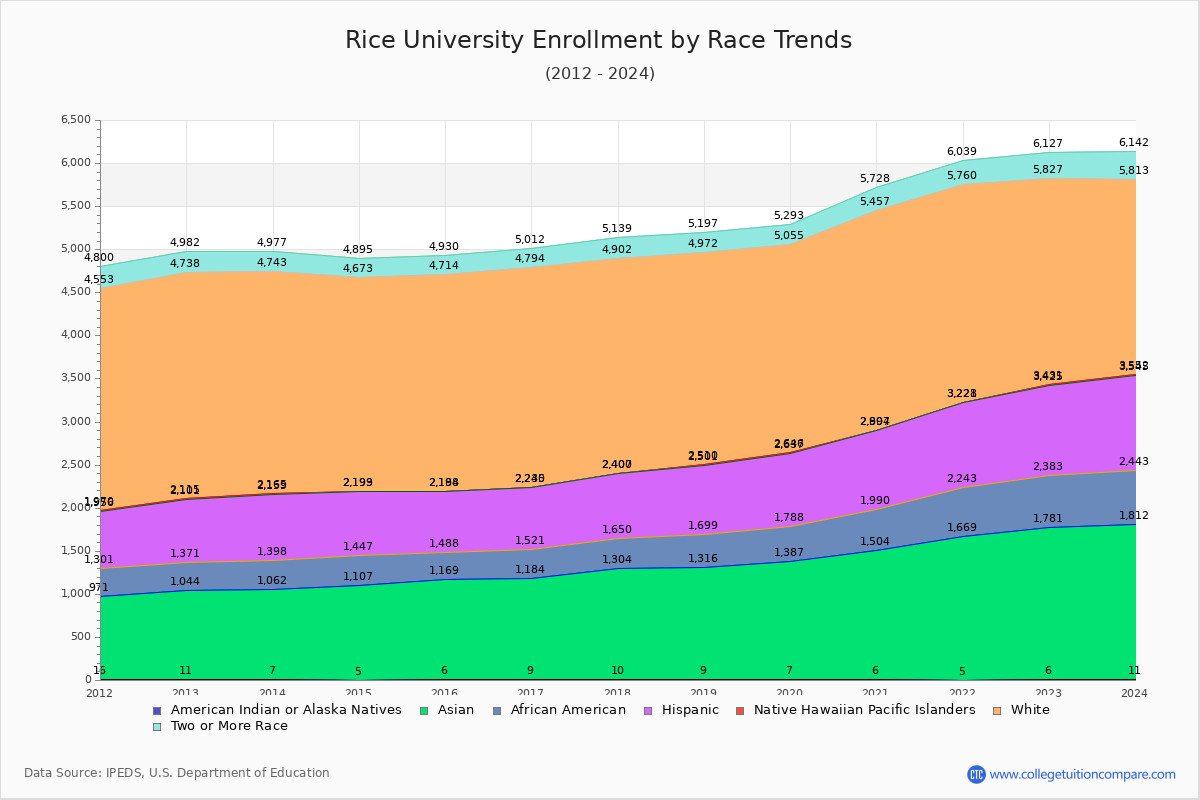
The percentage of white students is 27.63% and the percentage of black students is 6.94% at Rice University. 20.47% of enrolled students is Asian.
The following table and chart illustrate the student population trends by race/ethnicity at Rice University over the past 11 years (2013-2023).
| Year | American Indian or Native American | Asian | Black | Hispanic | Native Hawaiian or Other Pacific Islander | White | Two or More Races |
|---|---|---|---|---|---|---|---|
| 2013-14 | 7 | 1,055 | 336 | 761 | 6 | 2,578 | 234 |
| 2014-15 | 5 | 1,102 | 340 | 746 | 6 | 2,474 | 222 |
| 2015-16 | 6 | 1,163 | 319 | 700 | 6 | 2,520 | 216 |
| 2016-17 | 9 | 1,175 | 337 | 714 | 5 | 2,554 | 218 |
| 2017-18 | 10 | 1,294 | 346 | 750 | 7 | 2,495 | 237 |
| 2018-19 | 9 | 1,307 | 383 | 802 | 9 | 2,462 | 225 |
| 2019-20 | 7 | 1,380 | 401 | 849 | 9 | 2,409 | 238 |
| 2020-21 | 6 | 1,498 | 486 | 907 | 7 | 2,553 | 271 |
| 2021-22 | 5 | 1,664 | 574 | 978 | 7 | 2,532 | 279 |
| 2022-23 | 6 | 1,775 | 602 | 1,042 | 6 | 2,396 | 300 |
| Average | 7 | 1,341 | 412 | 825 | 7 | 2,497 | 244 |

Distance Learning (Online Courses) Enrollment Changes
498 students are enrolled in online degree programs exclusively for the academic year 2022-2023, which is 6% of total students. The number of online students has decreased % since 2014. The following table and chart illustrate the changes in the online student population by enrolled type at Rice University from 2014 to 2023.
| Year | Total Enrollment | Online Completely | Enrolled in Some Online Courses | Not Enrolled in Online Courses |
|---|---|---|---|---|
| 2014-15 | 6,621 | 0 | 0 | 6,621 |
| 2015-16 | 6,719 | 0 | 0 | 6,719 |
| 2016-17 | 6,855 | 0 | 0 | 6,855 |
| 2017-18 | 7,022 | 0 | 0 | 7,022 |
| 2018-19 | 7,124 | 44 | 84 | 6,996 |
| 2019-20 | 7,282 | 178 | 187 | 6,917 |
| 2020-21 | 7,643 | 418 | 6,683 | 542 |
| 2021-22 | 8,285 | 511 | 2,185 | 5,589 |
| 2022-23 | 8,672 | 498 | 412 | 7,762 |
| Average | 7,358 | 183 | 1,061 | 6,114 |
Ratings & Review
Share your experiences and thoughts about Rice University. It will be a great help to applicants and prospective students!