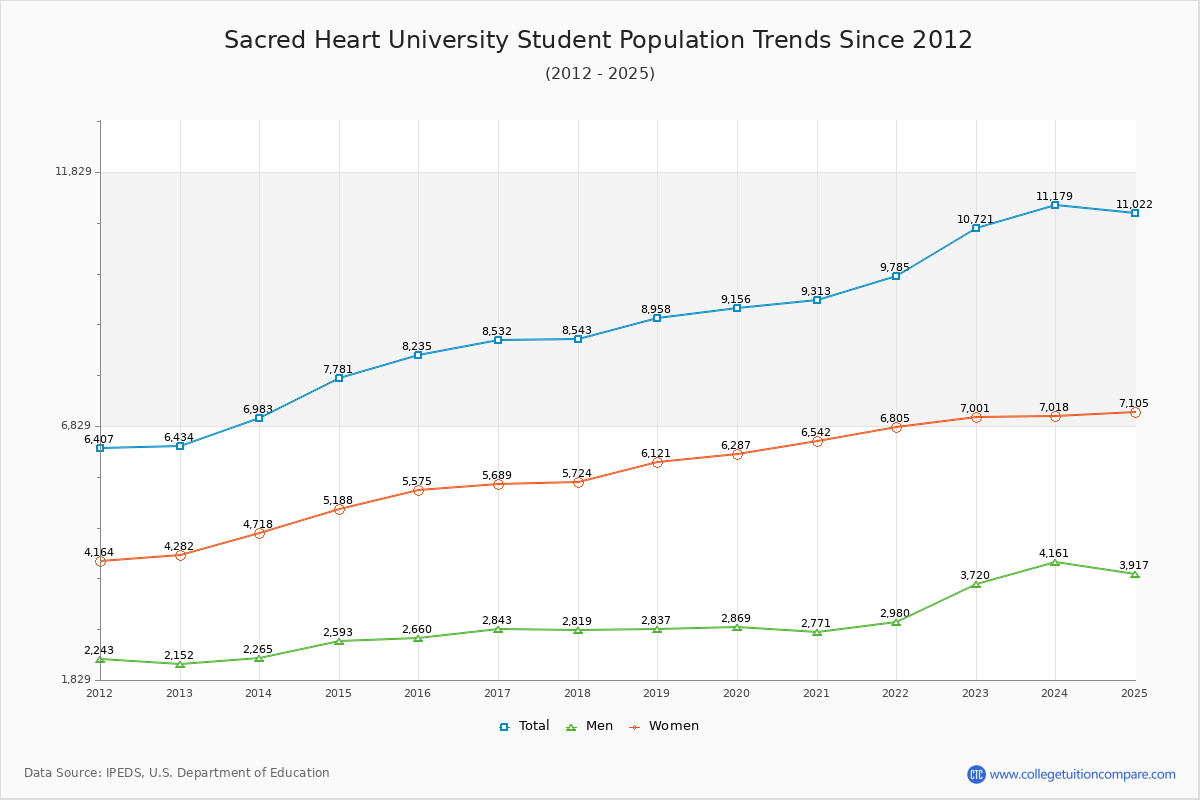
The student population at Sacred Heart University is 11,179 (6,960 undergraduate and 4,219 graduate students) . The number of students has increased by 4,196 over the past decade.
The percentage of undergraduate students at SHU is 62.26% which is increased by 2,471 over last 10 years. The graduate student population increased by 1,725 and it has been increasing.
The female to male ratio is 1.69 to 1 which means that female students enrolled more than male students.
1,192 students enrolled in online degree program exclusively and the number of online students has increased by 6.43% since 2014.
Student Population Changes
The average student population over the last 12 years is 9,017 where 11,179 students are attending the school for the academic year 2023-2024.
62.26% of total students is undergraduate students and 37.74% students is graduate students. The number of undergraduate students has increased by 2,471 and the graduate enrollment has increased by 1,725 over past 10 years.
The female to male ratio is 1.69 to 1 and it means that there are more female students enrolled in SHU than male students.
The following table and chart illustrate the changes in student population by gender at Sacred Heart University since 2013.
| Year | Total | Undergraduate | Graduate | ||||
|---|---|---|---|---|---|---|---|
| Total | Men | Women | Total | Men | Women | ||
| 2013-14 | 6,983 | 4,489 | 1,621 | 2,868 | 2,494 | 644 | 1,850 |
| 2014-15 | 7,781 798 | 4,997 508 | 1,803 182 | 3,194 326 | 2,784 290 | 790 146 | 1,994 144 |
| 2015-16 | 8,235 454 | 5,205 208 | 1,857 54 | 3,348 154 | 3,030 246 | 803 13 | 2,227 233 |
| 2016-17 | 8,532 297 | 5,428 223 | 1,952 95 | 3,476 128 | 3,104 74 | 891 88 | 2,213 -14 |
| 2017-18 | 8,543 11 | 5,603 175 | 2,022 70 | 3,581 105 | 2,940 -164 | 797 -94 | 2,143 -70 |
| 2018-19 | 8,958 415 | 5,974 371 | 2,073 51 | 3,901 320 | 2,984 44 | 764 -33 | 2,220 77 |
| 2019-20 | 9,156 198 | 6,158 184 | 2,068 -5 | 4,090 189 | 2,998 14 | 801 37 | 2,197 -23 |
| 2020-21 | 9,313 157 | 6,417 259 | 2,063 -5 | 4,354 264 | 2,896 -102 | 708 -93 | 2,188 -9 |
| 2021-22 | 9,785 472 | 6,761 344 | 2,201 138 | 4,560 206 | 3,024 128 | 779 71 | 2,245 57 |
| 2022-23 | 10,721 936 | 6,782 21 | 2,245 44 | 4,537 -23 | 3,939 915 | 1,475 696 | 2,464 219 |
| 2023-24 | 11,179 458 | 6,960 178 | 2,481 236 | 4,479 -58 | 4,219 280 | 1,680 205 | 2,539 75 |
| Average | 9,017 | 5,889 | 2,035 | 3,853 | 3,128 | 921 | 2,207 |
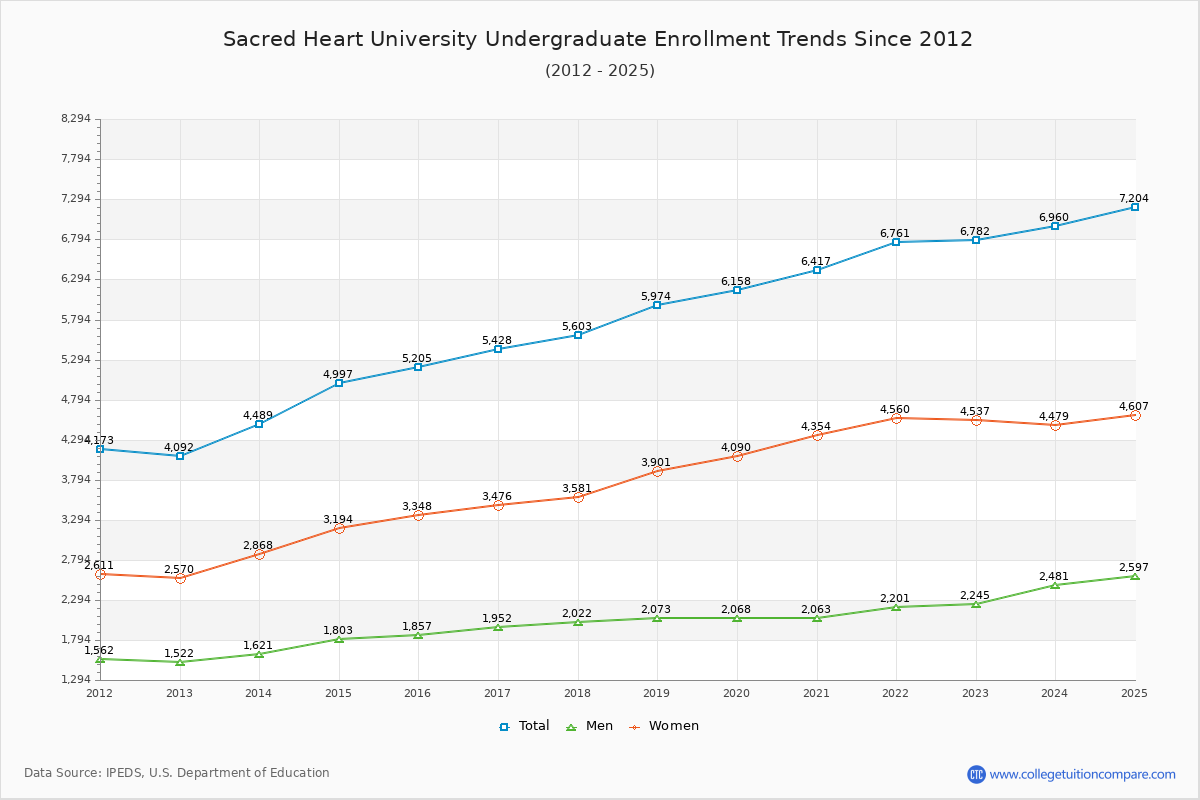
Undergraduate Enrollment Changes
The average number of Undergraduate students over the last 12 years is 5,889 where 6,960 students are attending the Undergraduate school for the academic year 2023-2024. The following table and chart illustrate the changes in Undergraduate enrollment by attending status and gender at Sacred Heart University since 2013.
| Year | Total | Full-time | Part-time | ||||
|---|---|---|---|---|---|---|---|
| Total | Men | Women | Total | Men | Women | ||
| 2013-14 | 4,489 | 3,773 | 1,408 | 2,365 | 716 | 213 | 503 |
| 2014-15 | 4,997 | 4,232 | 1,587 | 2,645 | 765 | 216 | 549 |
| 2015-16 | 5,205 | 4,435 | 1,647 | 2,788 | 770 | 210 | 560 |
| 2016-17 | 5,428 | 4,794 | 1,769 | 3,025 | 634 | 183 | 451 |
| 2017-18 | 5,603 | 4,982 | 1,844 | 3,138 | 621 | 178 | 443 |
| 2018-19 | 5,974 | 5,130 | 1,852 | 3,278 | 844 | 221 | 623 |
| 2019-20 | 6,158 | 5,348 | 1,891 | 3,457 | 810 | 177 | 633 |
| 2020-21 | 6,417 | 5,671 | 1,870 | 3,801 | 746 | 193 | 553 |
| 2021-22 | 6,761 | 6,071 | 2,021 | 4,050 | 690 | 180 | 510 |
| 2022-23 | 6,782 | 6,277 | 2,091 | 4,186 | 505 | 154 | 351 |
| 2023-24 | 6,960 | 6,532 | 2,340 | 4,192 | 428 | 141 | 287 |
| Average | 5,889 | 5,889 | 1,847 | 3,357 | 5,889 | 188 | 497 |
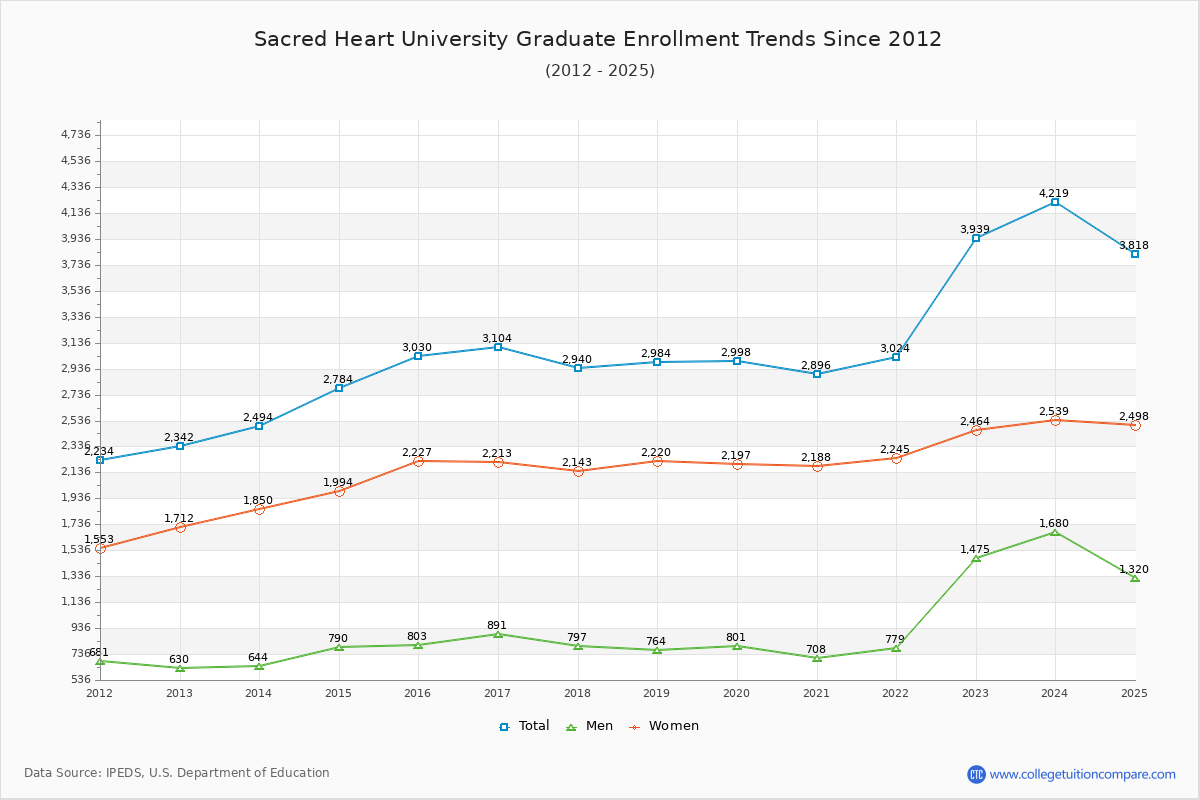
Graduate Enrollment Changes
The average number of Graduate students over the last 12 years is 3,128 where 4,219 students are attending the Graduate school for the academic year 2023-2024. The following table and chart illustrate the changes in Graduate enrollment by attending status and gender at Sacred Heart University since 2013.
| Year | Total | Full-time | Part-time | ||||
|---|---|---|---|---|---|---|---|
| Total | Men | Women | Total | Men | Women | ||
| 2013-14 | 2,494 | 769 | 251 | 518 | 1,725 | 393 | 1,332 |
| 2014-15 | 2,784 | 1,031 | 374 | 657 | 1,753 | 416 | 1,337 |
| 2015-16 | 3,030 | 1,076 | 343 | 733 | 1,954 | 460 | 1,494 |
| 2016-17 | 3,104 | 1,159 | 423 | 736 | 1,945 | 468 | 1,477 |
| 2017-18 | 2,940 | 1,086 | 350 | 736 | 1,854 | 447 | 1,407 |
| 2018-19 | 2,984 | 1,195 | 412 | 783 | 1,789 | 352 | 1,437 |
| 2019-20 | 2,998 | 1,291 | 425 | 866 | 1,707 | 376 | 1,331 |
| 2020-21 | 2,896 | 1,213 | 345 | 868 | 1,683 | 363 | 1,320 |
| 2021-22 | 3,024 | 1,380 | 427 | 953 | 1,644 | 352 | 1,292 |
| 2022-23 | 3,939 | 2,396 | 1,116 | 1,280 | 1,543 | 359 | 1,184 |
| 2023-24 | 4,219 | 2,490 | 1,104 | 1,386 | 1,729 | 576 | 1,153 |
| Average | 3,128 | 3,128 | 506 | 865 | 3,128 | 415 | 1,342 |
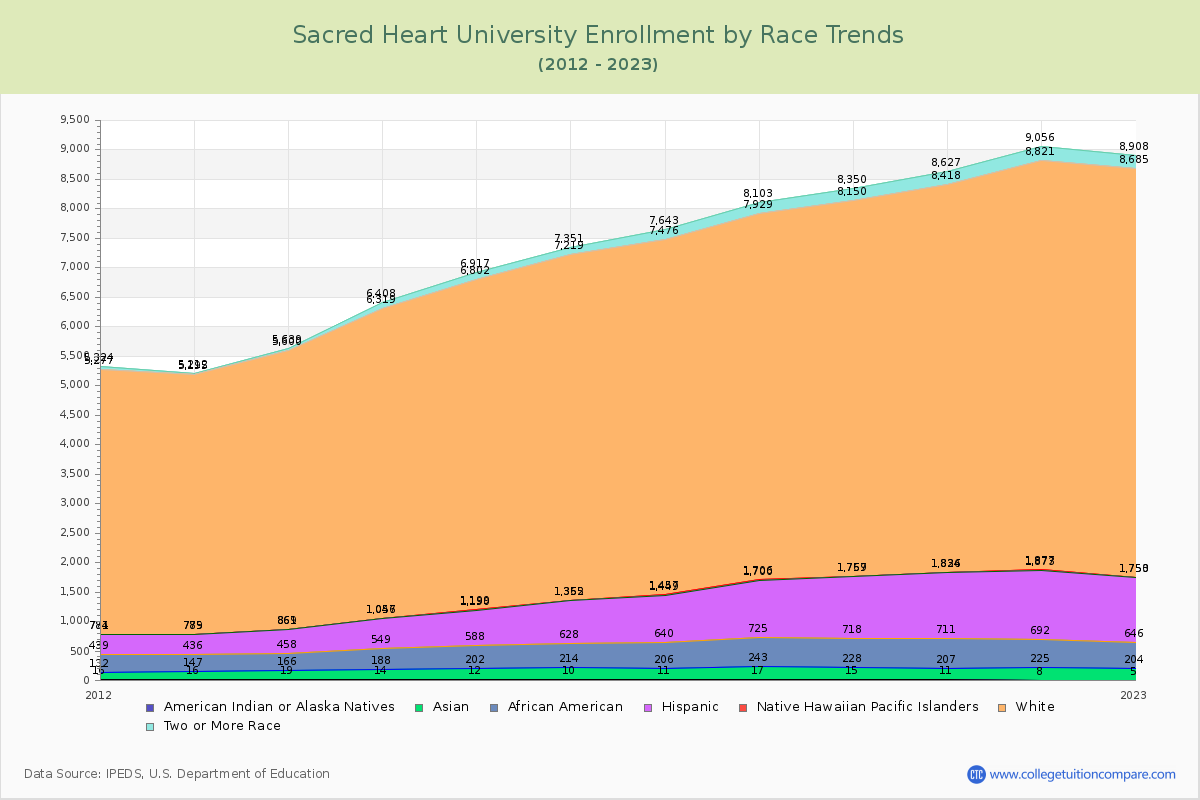
Enrollment by Race/Ethnicity Changes
The percentage of white students is 61.88%. The percentage was 67.75% 10 years ago and SHU still has a high percentage of white students. 1.94% of enrolled students is Asian and 3.89% is black students.
The following table and chart illustrate the student population trends by race/ethnicity at Sacred Heart University over the past 12 years (2013-2024).
| Year | American Indian or Native American | Asian | Black | Hispanic | Native Hawaiian or Other Pacific Islander | White | Two or More Races |
|---|---|---|---|---|---|---|---|
| 2013-14 | 19 | 147 | 292 | 403 | 8 | 4,731 | 39 |
| 2014-15 | 14 | 174 | 361 | 497 | 11 | 5,262 | 89 |
| 2015-16 | 12 | 190 | 386 | 602 | 9 | 5,603 | 115 |
| 2016-17 | 10 | 204 | 414 | 727 | 7 | 5,857 | 132 |
| 2017-18 | 11 | 195 | 434 | 809 | 8 | 6,019 | 167 |
| 2018-19 | 17 | 226 | 482 | 975 | 6 | 6,223 | 174 |
| 2019-20 | 15 | 213 | 490 | 1,041 | 8 | 6,383 | 200 |
| 2020-21 | 11 | 196 | 504 | 1,115 | 8 | 6,584 | 209 |
| 2021-22 | 8 | 217 | 467 | 1,181 | 4 | 6,944 | 235 |
| 2022-23 | 5 | 199 | 442 | 1,104 | 3 | 6,932 | 223 |
| 2023-24 | 8 | 217 | 435 | 1,162 | 3 | 6,918 | 215 |
| Average | 12 | 198 | 428 | 874 | 7 | 6,132 | 163 |
Distance Learning (Online Courses) Enrollment Changes
1,192 students are enrolled in online degree programs exclusively for the academic year 2023-2024, which is 11% of total students. The number of online students has increased 6.43% since 2014. The following table and chart illustrate the changes in the online student population by enrolled type at Sacred Heart University from 2014 to 2024.
| Year | Total Enrollment | Online Completely | Enrolled in Some Online Courses | Not Enrolled in Online Courses |
|---|---|---|---|---|
| 2014-15 | 7,781 | 1,120 | 1,148 | 5,513 |
| 2015-16 | 8,235 | 1,215 | 1,153 | 5,867 |
| 2016-17 | 8,532 | 1,145 | 1,759 | 5,628 |
| 2017-18 | 8,543 | 1,072 | 1,796 | 5,675 |
| 2018-19 | 8,958 | 1,102 | 1,699 | 6,157 |
| 2019-20 | 9,156 | 1,073 | 2,038 | 6,045 |
| 2020-21 | 9,313 | 1,576 | 4,745 | 2,992 |
| 2021-22 | 9,785 | 1,303 | 2,774 | 5,708 |
| 2022-23 | 10,721 | 1,221 | 3,268 | 6,232 |
| 2023-24 | 11,179 | 1,192 | 4,150 | 5,837 |
| Average | 9,220 | 1,202 | 2,453 | 5,565 |
Ratings & Review
Share your experiences and thoughts about Sacred Heart University. It will be a great help to applicants and prospective students!