The student population at Sam Houston State University is 21,403 (18,179 undergraduate and 3,224 graduate students) . The number of students has increased by 2,193 over the past decade.
The percentage of undergraduate students at Sam Houston State is 84.94% which is increased by 1,924 over last 10 years. The graduate student population increased by 269 and it has been increasing.
The female to male ratio is 1.75 to 1 which means that female students enrolled more than male students.
4,790 students enrolled in online degree program exclusively and the number of online students has increased by 96.47% since 2014.
Student Population Changes
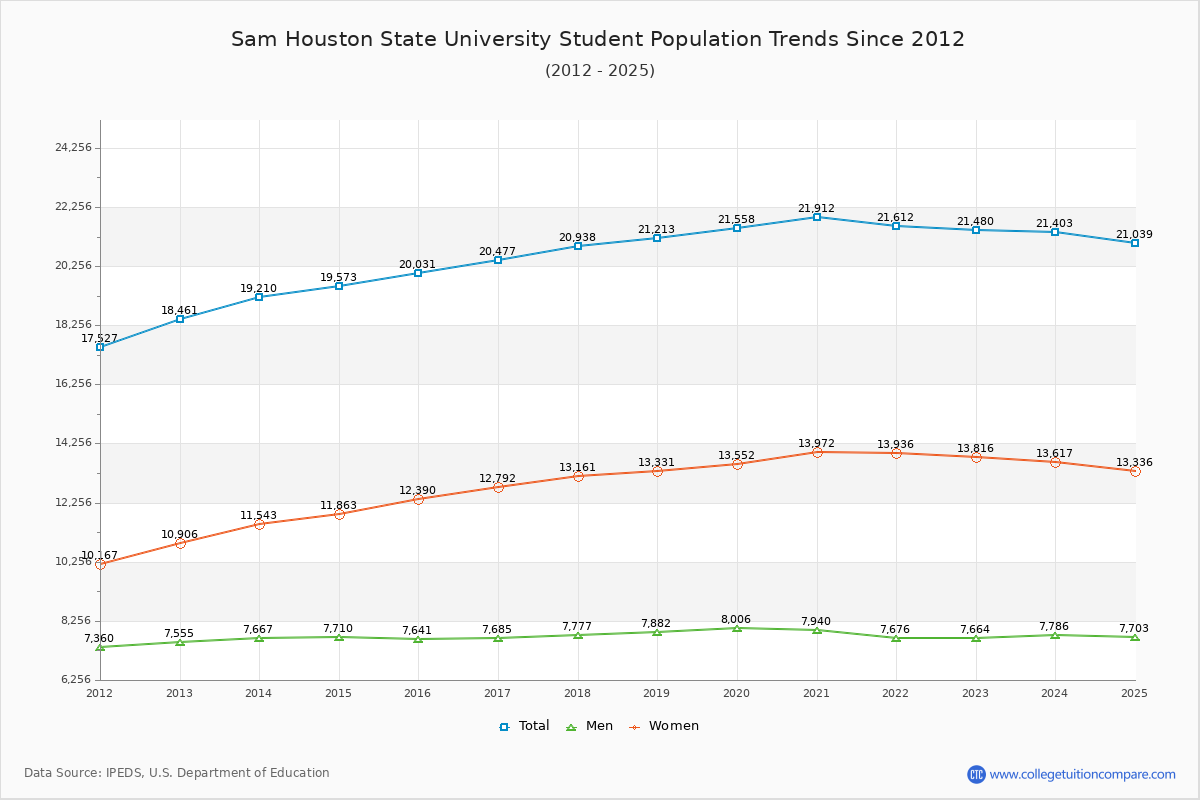
The average student population over the last 12 years is 20,855 where 21,403 students are attending the school for the academic year 2023-2024.
84.94% of total students is undergraduate students and 15.06% students is graduate students. The number of undergraduate students has increased by 1,924 and the graduate enrollment has increased by 269 over past 10 years.
The female to male ratio is 1.75 to 1 and it means that there are more female students enrolled in Sam Houston State than male students.
The following table and chart illustrate the changes in student population by gender at Sam Houston State University since 2013.
| Year | Total | Undergraduate | Graduate | ||||
|---|---|---|---|---|---|---|---|
| Total | Men | Women | Total | Men | Women | ||
| 2013-14 | 19,210 | 16,255 | 6,682 | 9,573 | 2,955 | 985 | 1,970 |
| 2014-15 | 19,573 363 | 16,819 564 | 6,728 46 | 10,091 518 | 2,754 -201 | 982 -3 | 1,772 -198 |
| 2015-16 | 20,031 458 | 17,401 582 | 6,761 33 | 10,640 549 | 2,630 -124 | 880 -102 | 1,750 -22 |
| 2016-17 | 20,477 446 | 17,902 501 | 6,855 94 | 11,047 407 | 2,575 -55 | 830 -50 | 1,745 -5 |
| 2017-18 | 20,938 461 | 18,416 514 | 7,023 168 | 11,393 346 | 2,522 -53 | 754 -76 | 1,768 23 |
| 2018-19 | 21,213 275 | 18,498 82 | 6,998 -25 | 11,500 107 | 2,715 193 | 884 130 | 1,831 63 |
| 2019-20 | 21,558 345 | 18,805 307 | 7,126 128 | 11,679 179 | 2,753 38 | 880 -4 | 1,873 42 |
| 2020-21 | 21,912 354 | 18,811 6 | 6,974 -152 | 11,837 158 | 3,101 348 | 966 86 | 2,135 262 |
| 2021-22 | 21,612 -300 | 18,288 -523 | 6,623 -351 | 11,665 -172 | 3,324 223 | 1,053 87 | 2,271 136 |
| 2022-23 | 21,480 -132 | 18,235 -53 | 6,660 37 | 11,575 -90 | 3,245 -79 | 1,004 -49 | 2,241 -30 |
| 2023-24 | 21,403 -77 | 18,179 -56 | 6,739 79 | 11,440 -135 | 3,224 -21 | 1,047 43 | 2,177 -64 |
| Average | 20,855 | 17,964 | 6,834 | 11,131 | 2,891 | 933 | 1,958 |
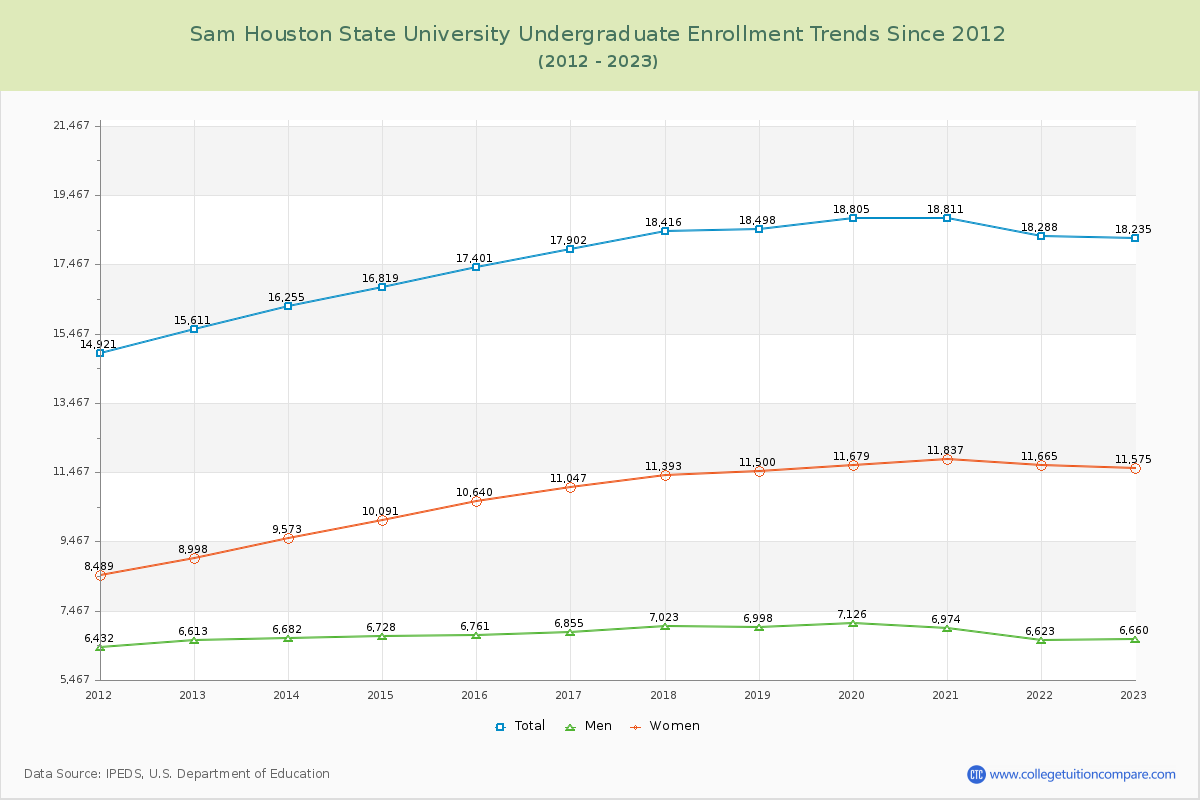
Undergraduate Enrollment Changes
The average number of Undergraduate students over the last 12 years is 17,964 where 18,179 students are attending the Undergraduate school for the academic year 2023-2024. The following table and chart illustrate the changes in Undergraduate enrollment by attending status and gender at Sam Houston State University since 2013.
| Year | Total | Full-time | Part-time | ||||
|---|---|---|---|---|---|---|---|
| Total | Men | Women | Total | Men | Women | ||
| 2013-14 | 16,255 | 13,359 | 5,550 | 7,809 | 2,896 | 1,132 | 1,764 |
| 2014-15 | 16,819 | 13,552 | 5,445 | 8,107 | 3,267 | 1,283 | 1,984 |
| 2015-16 | 17,401 | 14,117 | 5,482 | 8,635 | 3,284 | 1,279 | 2,005 |
| 2016-17 | 17,902 | 14,497 | 5,518 | 8,979 | 3,405 | 1,337 | 2,068 |
| 2017-18 | 18,416 | 14,808 | 5,589 | 9,219 | 3,608 | 1,434 | 2,174 |
| 2018-19 | 18,498 | 15,073 | 5,707 | 9,366 | 3,425 | 1,291 | 2,134 |
| 2019-20 | 18,805 | 15,311 | 5,798 | 9,513 | 3,494 | 1,328 | 2,166 |
| 2020-21 | 18,811 | 15,020 | 5,620 | 9,400 | 3,791 | 1,354 | 2,437 |
| 2021-22 | 18,288 | 14,352 | 5,204 | 9,148 | 3,936 | 1,419 | 2,517 |
| 2022-23 | 18,235 | 14,573 | 5,306 | 9,267 | 3,662 | 1,354 | 2,308 |
| 2023-24 | 18,179 | 14,533 | 5,373 | 9,160 | 3,646 | 1,366 | 2,280 |
| Average | 17,964 | 17,964 | 5,508 | 8,964 | 17,964 | 1,325 | 2,167 |
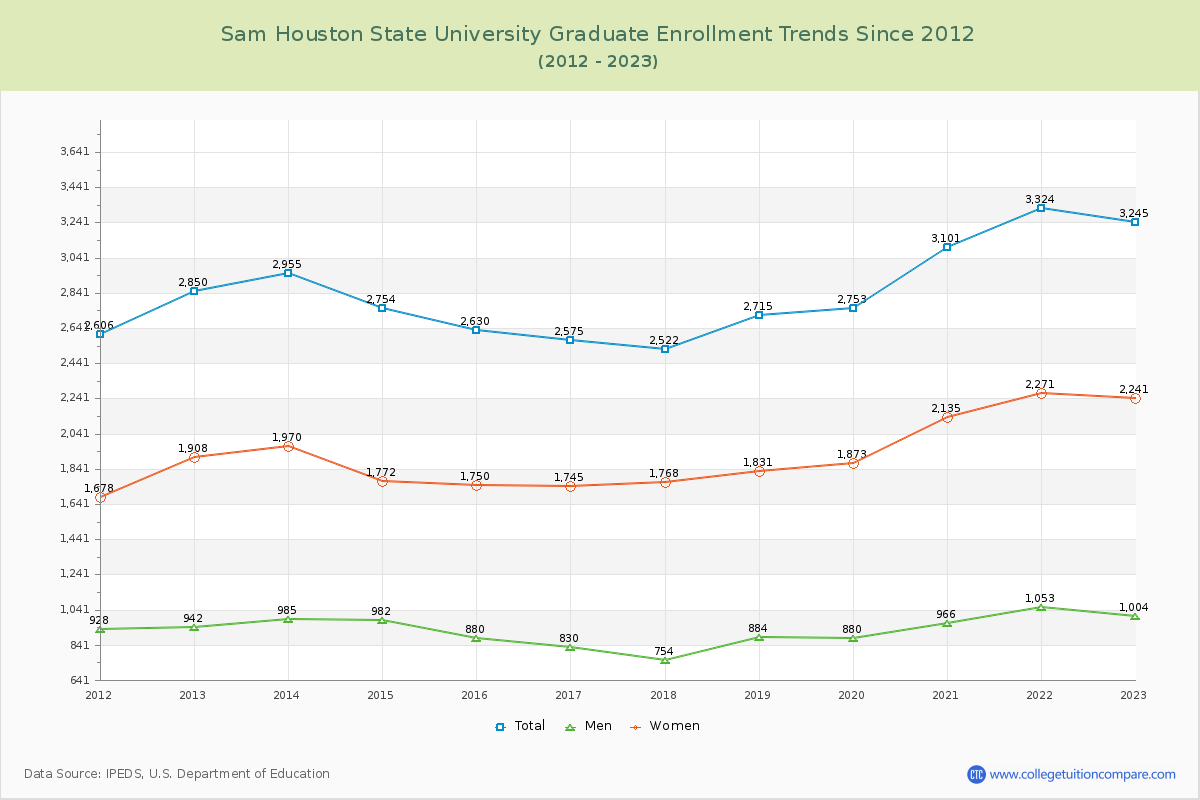
Graduate Enrollment Changes
The average number of Graduate students over the last 12 years is 2,891 where 3,224 students are attending the Graduate school for the academic year 2023-2024. The following table and chart illustrate the changes in Graduate enrollment by attending status and gender at Sam Houston State University since 2013.
| Year | Total | Full-time | Part-time | ||||
|---|---|---|---|---|---|---|---|
| Total | Men | Women | Total | Men | Women | ||
| 2013-14 | 2,955 | 773 | 288 | 485 | 2,182 | 697 | 1,485 |
| 2014-15 | 2,754 | 713 | 292 | 421 | 2,041 | 690 | 1,351 |
| 2015-16 | 2,630 | 652 | 222 | 430 | 1,978 | 658 | 1,320 |
| 2016-17 | 2,575 | 620 | 216 | 404 | 1,955 | 614 | 1,341 |
| 2017-18 | 2,522 | 611 | 194 | 417 | 1,911 | 560 | 1,351 |
| 2018-19 | 2,715 | 672 | 212 | 460 | 2,043 | 672 | 1,371 |
| 2019-20 | 2,753 | 692 | 226 | 466 | 2,061 | 654 | 1,407 |
| 2020-21 | 3,101 | 820 | 283 | 537 | 2,281 | 683 | 1,598 |
| 2021-22 | 3,324 | 907 | 288 | 619 | 2,417 | 765 | 1,652 |
| 2022-23 | 3,245 | 955 | 320 | 635 | 2,290 | 684 | 1,606 |
| 2023-24 | 3,224 | 1,111 | 404 | 707 | 2,113 | 643 | 1,470 |
| Average | 2,891 | 2,891 | 268 | 507 | 2,891 | 665 | 1,450 |
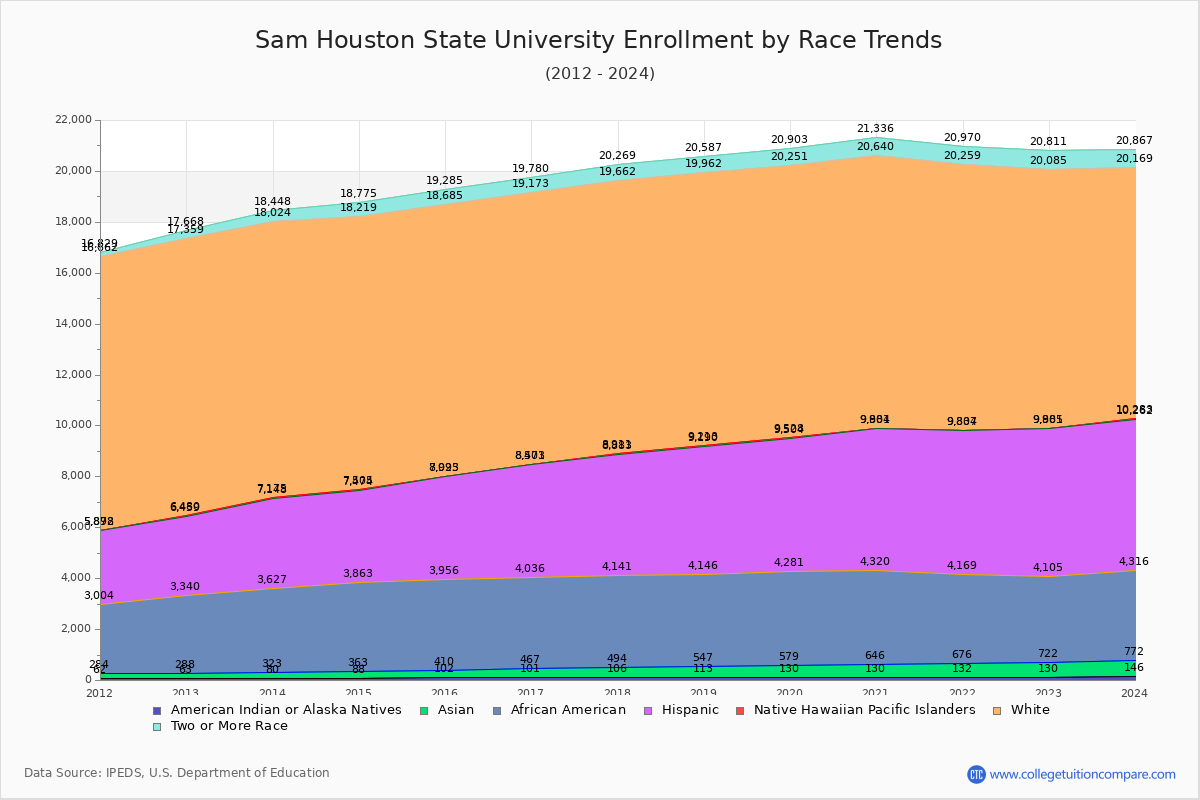
Enrollment by Race/Ethnicity Changes
The percentage of white students is 46.19% and the percentage of black students is 16.56% at Sam Houston State University. 2.92% of enrolled students is Asian.
The following table and chart illustrate the student population trends by race/ethnicity at Sam Houston State University over the past 12 years (2013-2024).
| Year | American Indian or Native American | Asian | Black | Hispanic | Native Hawaiian or Other Pacific Islander | White | Two or More Races |
|---|---|---|---|---|---|---|---|
| 2013-14 | 80 | 243 | 3,304 | 3,521 | 27 | 10,849 | 424 |
| 2014-15 | 88 | 275 | 3,500 | 3,611 | 31 | 10,714 | 556 |
| 2015-16 | 102 | 308 | 3,546 | 4,039 | 28 | 10,662 | 600 |
| 2016-17 | 101 | 366 | 3,569 | 4,437 | 28 | 10,672 | 607 |
| 2017-18 | 106 | 388 | 3,647 | 4,742 | 28 | 10,751 | 607 |
| 2018-19 | 113 | 434 | 3,599 | 5,044 | 23 | 10,749 | 625 |
| 2019-20 | 130 | 449 | 3,702 | 5,223 | 24 | 10,723 | 652 |
| 2020-21 | 130 | 516 | 3,674 | 5,561 | 23 | 10,736 | 696 |
| 2021-22 | 132 | 544 | 3,493 | 5,638 | 27 | 10,425 | 711 |
| 2022-23 | 130 | 592 | 3,383 | 5,776 | 24 | 10,180 | 726 |
| 2023-24 | 146 | 626 | 3,544 | 5,946 | 21 | 9,886 | 698 |
| Average | 114 | 431 | 3,542 | 4,867 | 26 | 10,577 | 627 |
Distance Learning (Online Courses) Enrollment Changes
4,790 students are enrolled in online degree programs exclusively for the academic year 2023-2024, which is 22% of total students. The number of online students has increased 96.47% since 2014. The following table and chart illustrate the changes in the online student population by enrolled type at Sam Houston State University from 2014 to 2024.
| Year | Total Enrollment | Online Completely | Enrolled in Some Online Courses | Not Enrolled in Online Courses |
|---|---|---|---|---|
| 2014-15 | 19,573 | 2,438 | 5,466 | 11,669 |
| 2015-16 | 20,031 | 2,711 | 6,567 | 10,753 |
| 2016-17 | 20,477 | 2,833 | 6,623 | 11,021 |
| 2017-18 | 20,938 | 3,062 | 7,485 | 10,391 |
| 2018-19 | 21,213 | 3,489 | 7,776 | 9,948 |
| 2019-20 | 21,558 | 3,682 | 7,793 | 10,083 |
| 2020-21 | 21,912 | 4,425 | 8,640 | 8,847 |
| 2021-22 | 21,612 | 5,252 | 8,795 | 7,565 |
| 2022-23 | 21,480 | 5,098 | 9,260 | 7,122 |
| 2023-24 | 21,403 | 4,790 | 9,385 | 7,228 |
| Average | 21,020 | 3,778 | 7,779 | 9,463 |
Ratings & Review
Share your experiences and thoughts about Sam Houston State University. It will be a great help to applicants and prospective students!