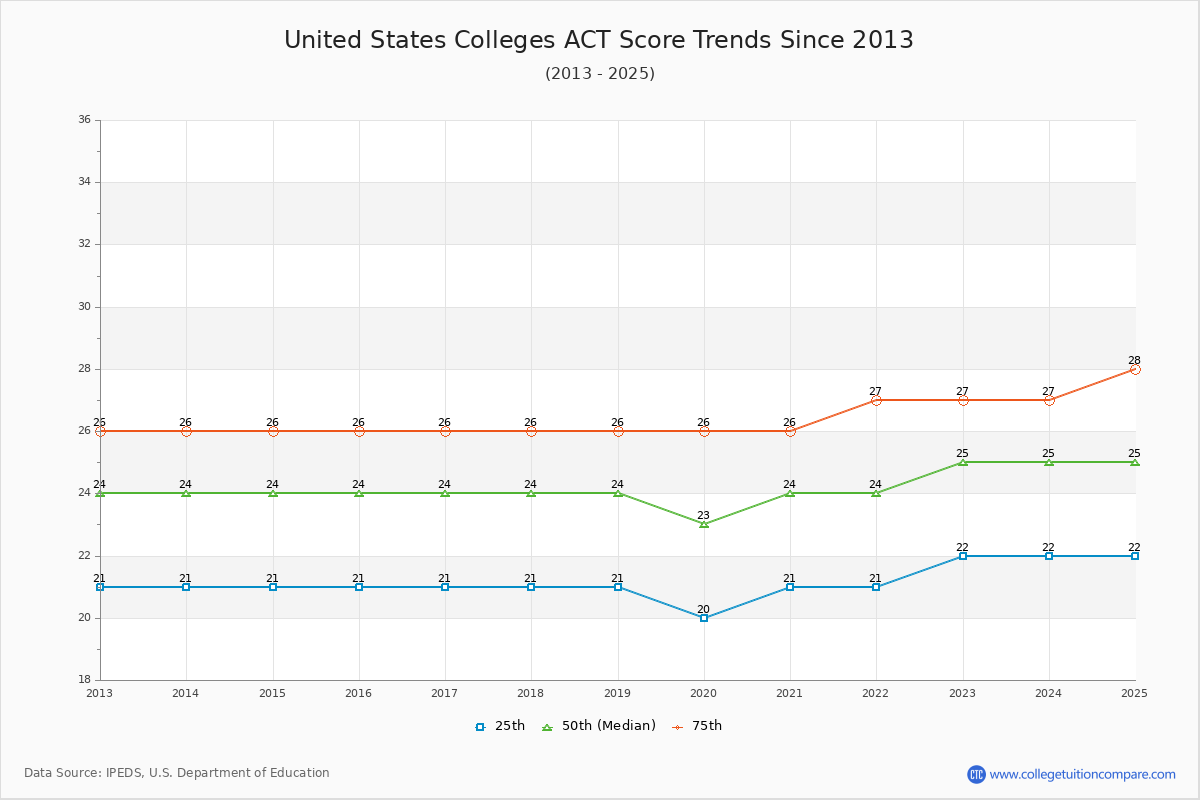
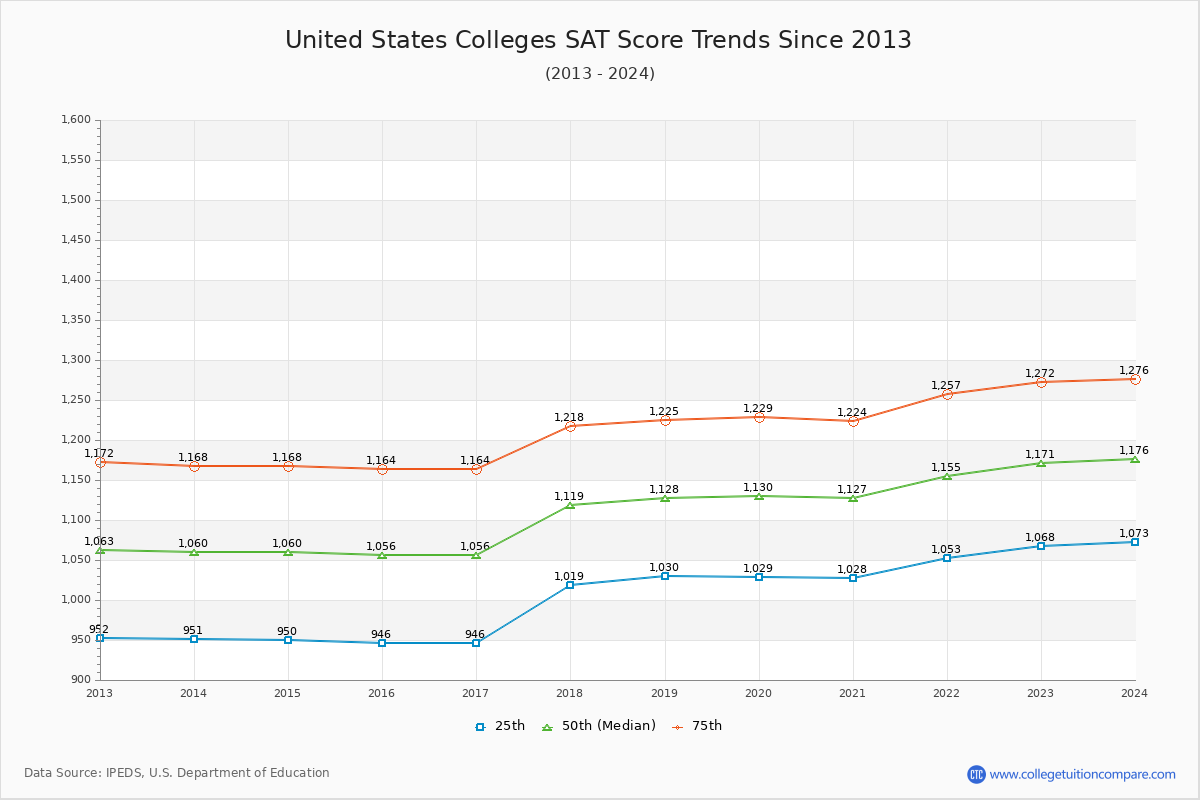
The 2024 average SAT scores submitted by enrolled students in U.S. colleges is 1,175. Compared to the SAT scores of 10 years ago, the score becomes higher from 1,060 to 1,175. The 25th percentile SAT score is 1,073 and the 75th percentile score is 1,276 at U.S. colleges. The U.S. colleges' average ACT scores is 25 and it is higher than 24, score of 10 years ago.
SAT Scores Over Time
The average SAT score of the last 10 years is 1,008 (25th percentile) and 1,215 (75th percentile). The submitted SAT scores of admitted students are relatively competitive and high (above the national average) at U.S. colleges.
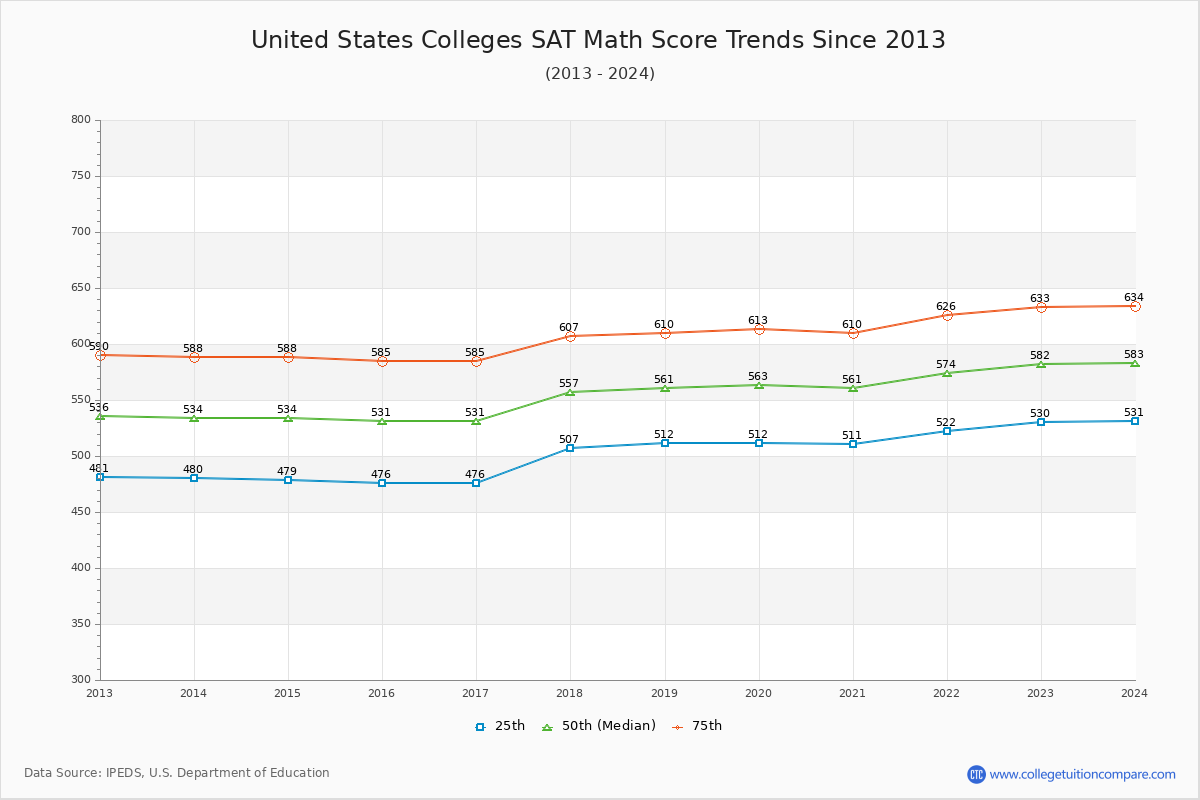
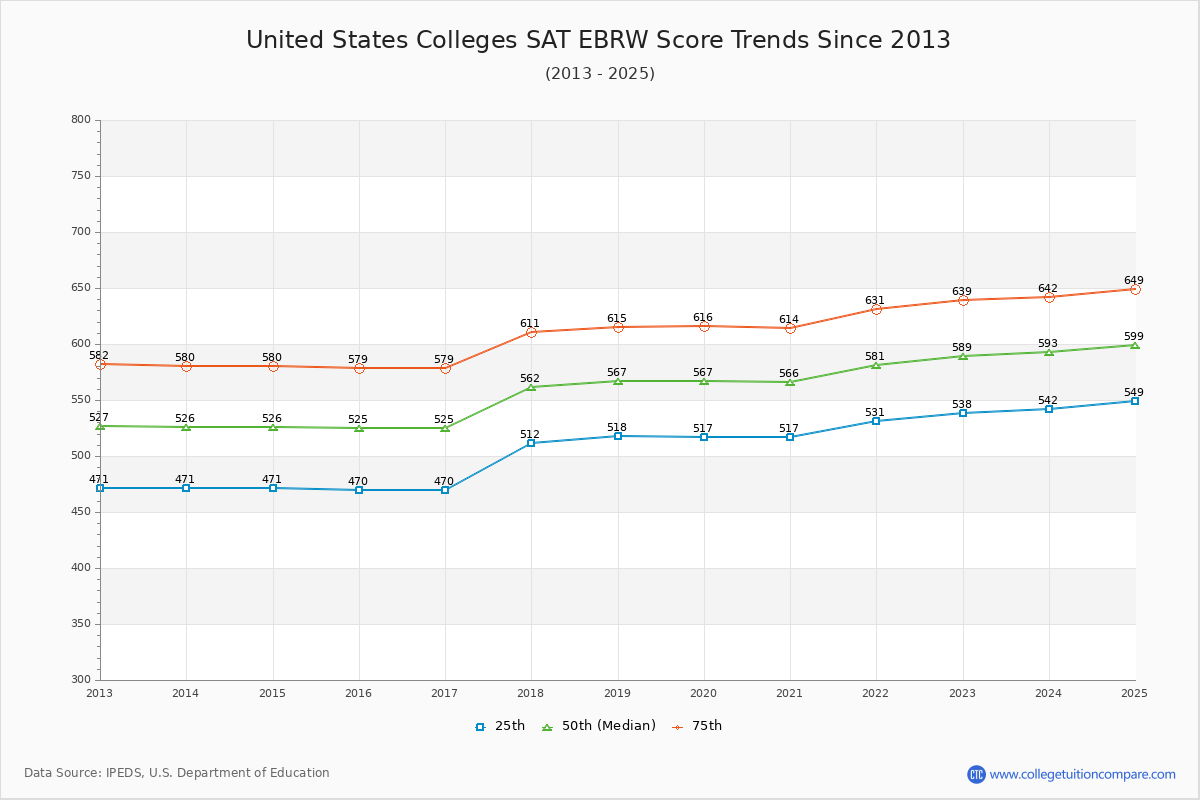
The following table and chart illustrate the changes in SAT scores at U.S. colleges since 2024.
| Year | Total | Math | EBRW | ||||||
|---|---|---|---|---|---|---|---|---|---|
| 25th | 50th | 75th | 25th | 50th | 75th | 25th | 50th | 75th | |
| 2013-14 | 951 | 1,060 | 1,168 | 480 | 534 | 588 | 471 | 526 | 580 |
| 2014-15 | 950 | 1,059 | 1,168 | 479 | 534 | 588 | 471 | 526 | 580 |
| 2015-16 | 946 | 1,055 | 1,164 | 476 | 531 | 585 | 470 | 525 | 579 |
| 2016-17 | 946 | 1,055 | 1,164 | 476 | 531 | 585 | 470 | 525 | 579 |
| 2017-18 | 1,019 | 1,119 | 1,218 | 507 | 557 | 607 | 512 | 562 | 611 |
| 2018-19 | 1,030 | 1,128 | 1,225 | 512 | 561 | 610 | 518 | 567 | 615 |
| 2019-20 | 1,029 | 1,129 | 1,229 | 512 | 563 | 613 | 517 | 567 | 616 |
| 2020-21 | 1,028 | 1,126 | 1,224 | 511 | 561 | 610 | 517 | 566 | 614 |
| 2021-22 | 1,053 | 1,155 | 1,257 | 522 | 574 | 626 | 531 | 581 | 631 |
| 2022-23 | 1,068 | 1,170 | 1,272 | 530 | 582 | 633 | 538 | 589 | 639 |
| 2023-24 | 1,073 | 1,175 | 1,276 | 531 | 583 | 634 | 542 | 593 | 642 |
| Average | 1,008 | 1,112 | 1,215 | 503 | 556 | 607 | 505 | 557 | 608 |
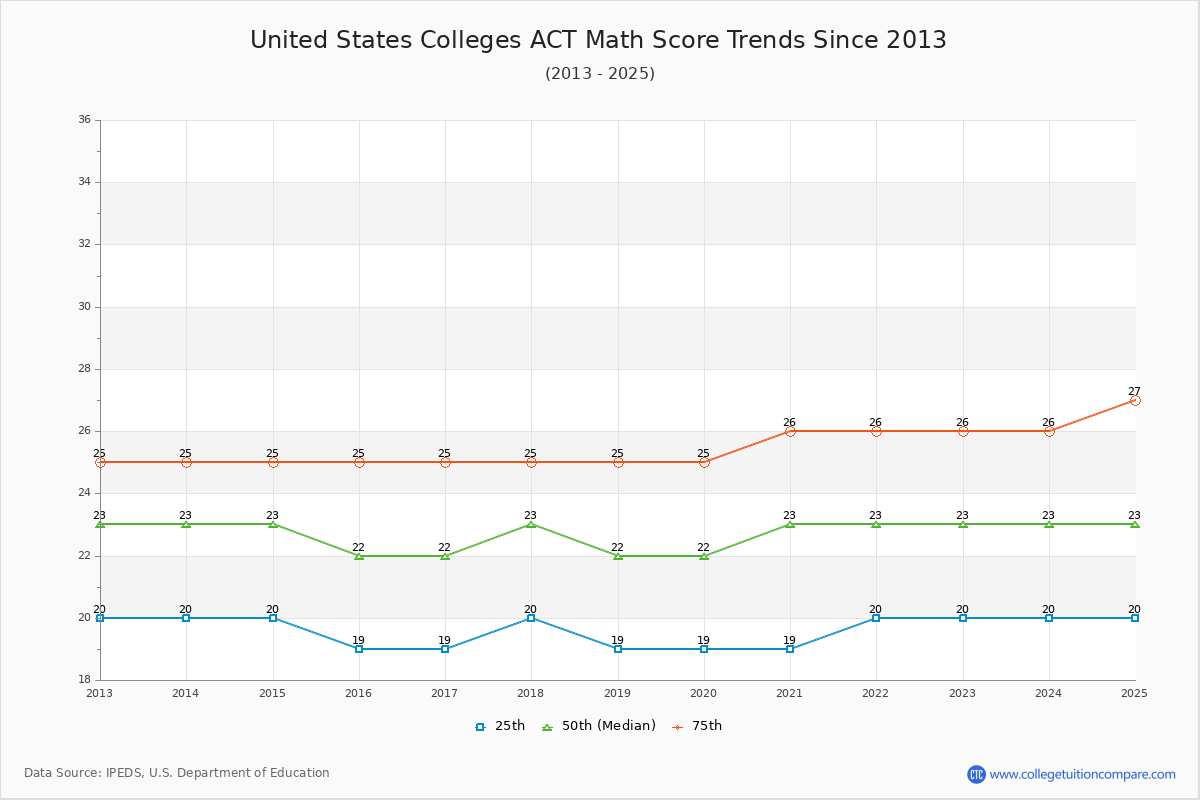
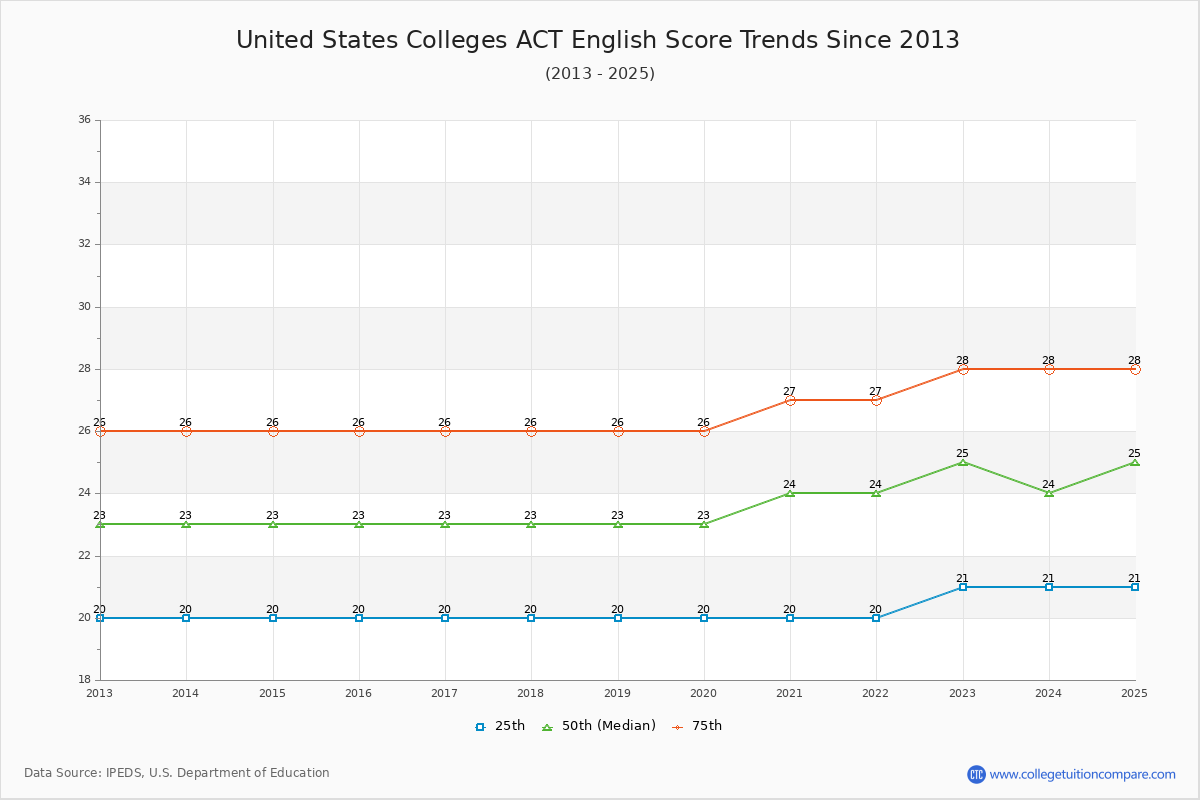
ACT Scores Over Time
The average ACT score of the last 10 years is 21 (25th percentile) and 26 (75th percentile). The submitted ACT scores of admitted students are around national average at U.S. colleges. The following table and chart show the changes in ACT scores at U.S. colleges since 2024.
| Year | Composite | English | Math | ||||||
|---|---|---|---|---|---|---|---|---|---|
| 25th | 50th | 75th | 25th | 50th | 75th | 25th | 50th | 75th | |
| 2013-14 | 21 | 24 | 26 | 20 | 23 | 26 | 20 | 23 | 25 |
| 2014-15 | 21 | 24 | 26 | 20 | 23 | 26 | 20 | 23 | 25 |
| 2015-16 | 21 | 24 | 26 | 20 | 23 | 26 | 19 | 22 | 25 |
| 2016-17 | 21 | 24 | 26 | 20 | 23 | 26 | 19 | 22 | 25 |
| 2017-18 | 21 | 24 | 26 | 20 | 23 | 26 | 20 | 23 | 25 |
| 2018-19 | 21 | 24 | 26 | 20 | 23 | 26 | 19 | 22 | 25 |
| 2019-20 | 20 | 23 | 26 | 20 | 23 | 26 | 19 | 22 | 25 |
| 2020-21 | 21 | 24 | 26 | 20 | 24 | 27 | 19 | 23 | 26 |
| 2021-22 | 21 | 24 | 27 | 20 | 24 | 27 | 20 | 23 | 26 |
| 2022-23 | 22 | 25 | 27 | 21 | 25 | 28 | 20 | 23 | 26 |
| 2023-24 | 22 | 25 | 27 | 21 | 24 | 28 | 20 | 23 | 26 |
| Average | 21 | 24 | 26 | 20 | 23 | 27 | 20 | 23 | 25 |