The student population at Smith College is 2,830 (2,506 undergraduate and 324 graduate students) . The number of students has decreased by 203 over the past decade.
The percentage of undergraduate students at Smith is 88.55% which is decreased by 100 over last 10 years. The graduate student population decreased by 103 and it has been decreasing.
All students have enrolled in on-campus classes (Smith College does not offer online degree/certificate program).
Student Population Changes
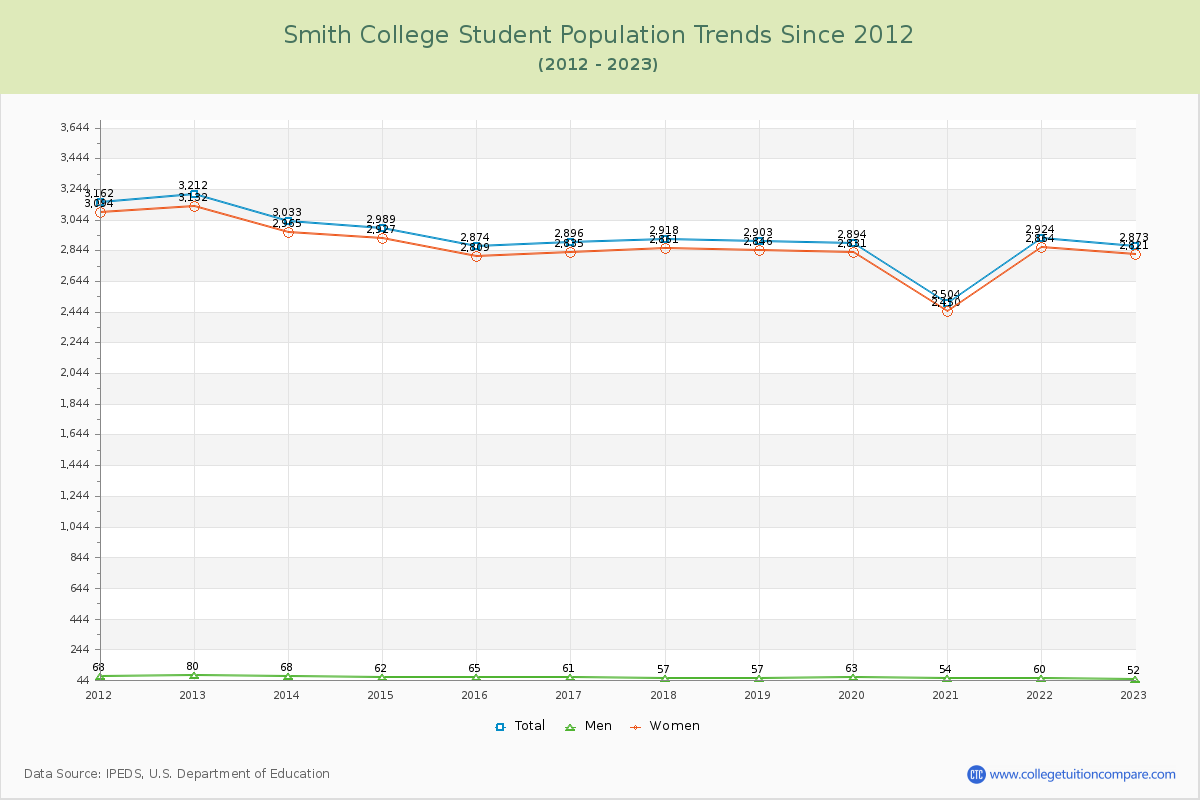
The average student population over the last 12 years is 2,876 where 2,830 students are attending the school for the academic year 2023-2024.
88.55% of total students is undergraduate students and 11.45% students is graduate students. The number of undergraduate students has decreased by 100 and the graduate enrollment has decreased by 103 over past 10 years.
The following table and chart illustrate the changes in student population by gender at Smith College since 2013.
| Year | Total | Undergraduate | Graduate | ||||
|---|---|---|---|---|---|---|---|
| Total | Men | Women | Total | Men | Women | ||
| 2013-14 | 3,033 | 2,606 | 2 | 2,604 | 427 | 66 | 361 |
| 2014-15 | 2,989 -44 | 2,563 -43 | 0 -2 | 2,563 -41 | 426 -1 | 62 -4 | 364 3 |
| 2015-16 | 2,874 -115 | 2,478 -85 | 1 1 | 2,477 -86 | 396 -30 | 64 2 | 332 -32 |
| 2016-17 | 2,896 22 | 2,514 36 | 2 1 | 2,512 35 | 382 -14 | 59 -5 | 323 -9 |
| 2017-18 | 2,918 22 | 2,521 7 | 1 -1 | 2,520 8 | 397 15 | 56 -3 | 341 18 |
| 2018-19 | 2,903 -15 | 2,502 -19 | 0 -1 | 2,502 -18 | 401 4 | 57 1 | 344 3 |
| 2019-20 | 2,894 -9 | 2,531 29 | 1 1 | 2,530 28 | 363 -38 | 62 5 | 301 -43 |
| 2020-21 | 2,504 -390 | 2,183 -348 | 1 | 2,182 -348 | 321 -42 | 53 -9 | 268 -33 |
| 2021-22 | 2,924 420 | 2,566 383 | 2 1 | 2,564 382 | 358 37 | 58 5 | 300 32 |
| 2022-23 | 2,873 -51 | 2,523 -43 | 1 -1 | 2,522 -42 | 350 -8 | 51 -7 | 299 -1 |
| 2023-24 | 2,830 -43 | 2,506 -17 | 5 4 | 2,501 -21 | 324 -26 | 52 1 | 272 -27 |
| Average | 2,876 | 2,499 | 1 | 2,498 | 377 | 58 | 319 |
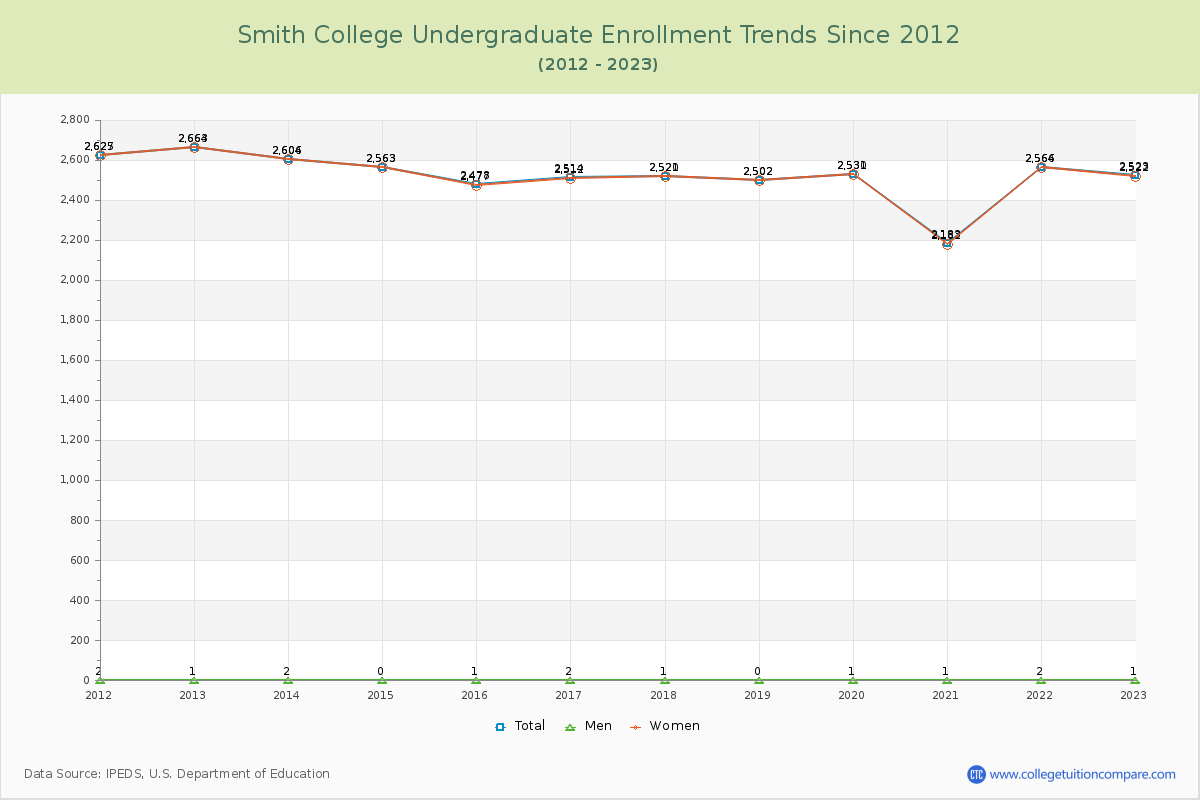
Undergraduate Enrollment Changes
The average number of Undergraduate students over the last 12 years is 2,499 where 2,506 students are attending the Undergraduate school for the academic year 2023-2024. The following table and chart illustrate the changes in Undergraduate enrollment by attending status and gender at Smith College since 2013.
| Year | Total | Full-time | Part-time | ||||
|---|---|---|---|---|---|---|---|
| Total | Men | Women | Total | Men | Women | ||
| 2013-14 | 2,606 | 2,585 | 2 | 2,583 | 21 | 0 | 21 |
| 2014-15 | 2,563 | 2,544 | 0 | 2,544 | 19 | 0 | 19 |
| 2015-16 | 2,478 | 2,460 | 1 | 2,459 | 18 | 0 | 18 |
| 2016-17 | 2,514 | 2,503 | 2 | 2,501 | 11 | 0 | 11 |
| 2017-18 | 2,521 | 2,505 | 1 | 2,504 | 16 | 0 | 16 |
| 2018-19 | 2,502 | 2,490 | 0 | 2,490 | 12 | 0 | 12 |
| 2019-20 | 2,531 | 2,519 | 1 | 2,518 | 12 | 0 | 12 |
| 2020-21 | 2,183 | 2,160 | 0 | 2,160 | 23 | 1 | 22 |
| 2021-22 | 2,566 | 2,554 | 1 | 2,553 | 12 | 1 | 11 |
| 2022-23 | 2,523 | 2,518 | 1 | 2,517 | 5 | 0 | 5 |
| 2023-24 | 2,506 | 2,497 | 5 | 2,492 | 9 | 0 | 9 |
| Average | 2,499 | 2,499 | 1 | 2,484 | 2,499 | 0 | 14 |
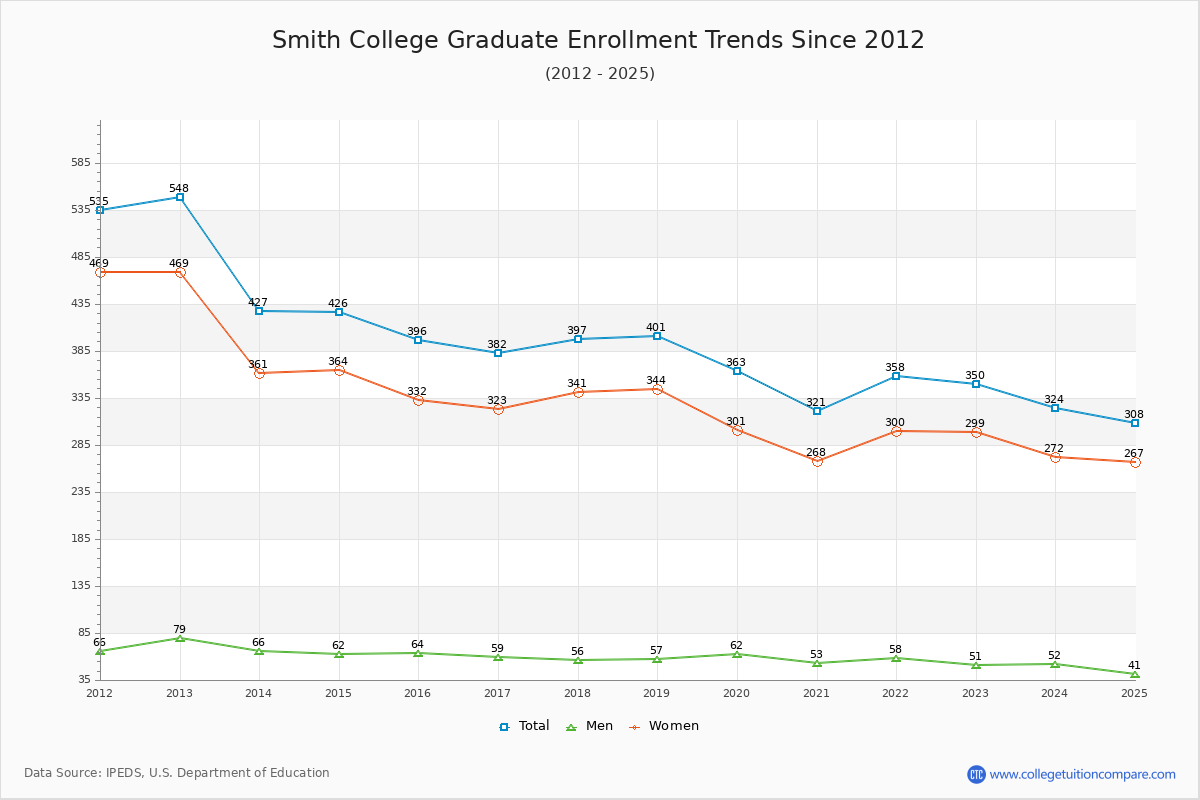
Graduate Enrollment Changes
The average number of Graduate students over the last 12 years is 377 where 324 students are attending the Graduate school for the academic year 2023-2024. The following table and chart illustrate the changes in Graduate enrollment by attending status and gender at Smith College since 2013.
| Year | Total | Full-time | Part-time | ||||
|---|---|---|---|---|---|---|---|
| Total | Men | Women | Total | Men | Women | ||
| 2013-14 | 427 | 352 | 48 | 304 | 75 | 18 | 57 |
| 2014-15 | 426 | 347 | 45 | 302 | 79 | 17 | 62 |
| 2015-16 | 396 | 315 | 48 | 267 | 81 | 16 | 65 |
| 2016-17 | 382 | 306 | 42 | 264 | 76 | 17 | 59 |
| 2017-18 | 397 | 373 | 50 | 323 | 24 | 6 | 18 |
| 2018-19 | 401 | 378 | 53 | 325 | 23 | 4 | 19 |
| 2019-20 | 363 | 344 | 57 | 287 | 19 | 5 | 14 |
| 2020-21 | 321 | 300 | 47 | 253 | 21 | 6 | 15 |
| 2021-22 | 358 | 341 | 52 | 289 | 17 | 6 | 11 |
| 2022-23 | 350 | 317 | 42 | 275 | 33 | 9 | 24 |
| 2023-24 | 324 | 286 | 44 | 242 | 38 | 8 | 30 |
| Average | 377 | 377 | 48 | 285 | 377 | 10 | 34 |
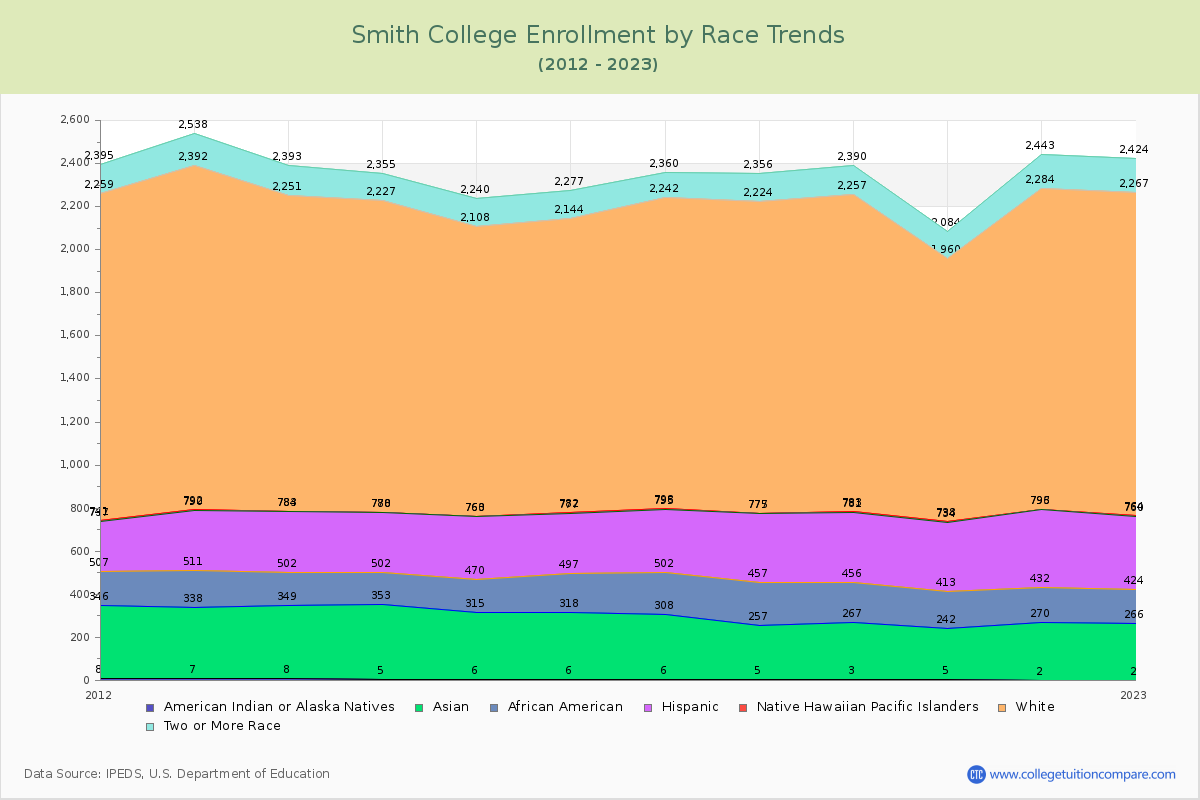
Enrollment by Race/Ethnicity Changes
The percentage of white students is 53.89%. The percentage was 48.37% 10 years ago and Smith still has a high percentage of white students. 9.36% of enrolled students is Asian and 5.16% is black students.
The following table and chart illustrate the student population trends by race/ethnicity at Smith College over the past 12 years (2013-2024).
| Year | American Indian or Native American | Asian | Black | Hispanic | Native Hawaiian or Other Pacific Islander | White | Two or More Races |
|---|---|---|---|---|---|---|---|
| 2013-14 | 8 | 341 | 153 | 281 | 1 | 1,467 | 142 |
| 2014-15 | 5 | 348 | 149 | 276 | 2 | 1,447 | 128 |
| 2015-16 | 6 | 309 | 155 | 290 | 3 | 1,345 | 132 |
| 2016-17 | 6 | 312 | 179 | 280 | 5 | 1,362 | 133 |
| 2017-18 | 6 | 302 | 194 | 293 | 3 | 1,444 | 118 |
| 2018-19 | 5 | 252 | 200 | 318 | 2 | 1,447 | 132 |
| 2019-20 | 3 | 264 | 189 | 325 | 2 | 1,474 | 133 |
| 2020-21 | 5 | 237 | 171 | 321 | 4 | 1,222 | 124 |
| 2021-22 | 2 | 268 | 162 | 361 | 3 | 1,488 | 159 |
| 2022-23 | 2 | 264 | 158 | 336 | 4 | 1,503 | 157 |
| 2023-24 | 1 | 265 | 146 | 339 | 3 | 1,525 | 168 |
| Average | 4 | 287 | 169 | 311 | 3 | 1,429 | 139 |
Distance Learning (Online Courses) Enrollment Changes
Smith College does not offer online degree/certificate programs. All Students have enrolled in on-campus programs.
Ratings & Review
Share your experiences and thoughts about Smith College. It will be a great help to applicants and prospective students!