The student population at Spelman College is 3,633 (all undergraduate). The number of students has increased by 1,504 over the past decade.
1,048 students enrolled in online degree program exclusively and the number of online students has decreased by % since 2014.
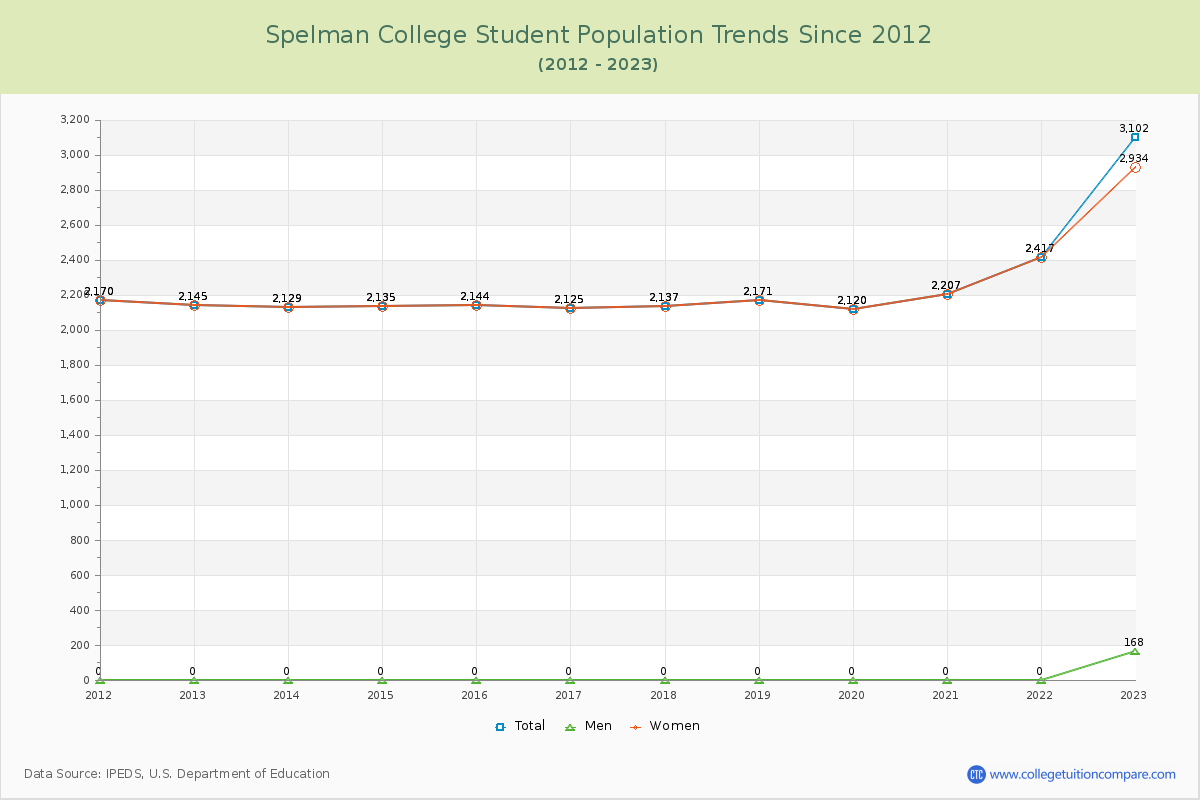
Student Population Changes
The average student population over the last 12 years is 2,393 where 3,633 students are attending the school for the academic year 2023-2024.
The following table and chart illustrate the changes in student population by gender at Spelman College since 2013.
| Year | Total | Men | Women |
|---|---|---|---|
| 2013-14 | 2,129 | 0 | 2,129 |
| 2014-15 | 2,135 6 | 0 | 2,135 6 |
| 2015-16 | 2,144 9 | 0 | 2,144 9 |
| 2016-17 | 2,125 -19 | 0 | 2,125 -19 |
| 2017-18 | 2,137 12 | 0 | 2,137 12 |
| 2018-19 | 2,171 34 | 0 | 2,171 34 |
| 2019-20 | 2,120 -51 | 0 | 2,120 -51 |
| 2020-21 | 2,207 87 | 0 | 2,207 87 |
| 2021-22 | 2,417 210 | 0 | 2,417 210 |
| 2022-23 | 3,102 685 | 168 168 | 2,934 517 |
| 2023-24 | 3,633 531 | 258 90 | 3,375 441 |
| Average | 2,393 | 39 | 2,354 |
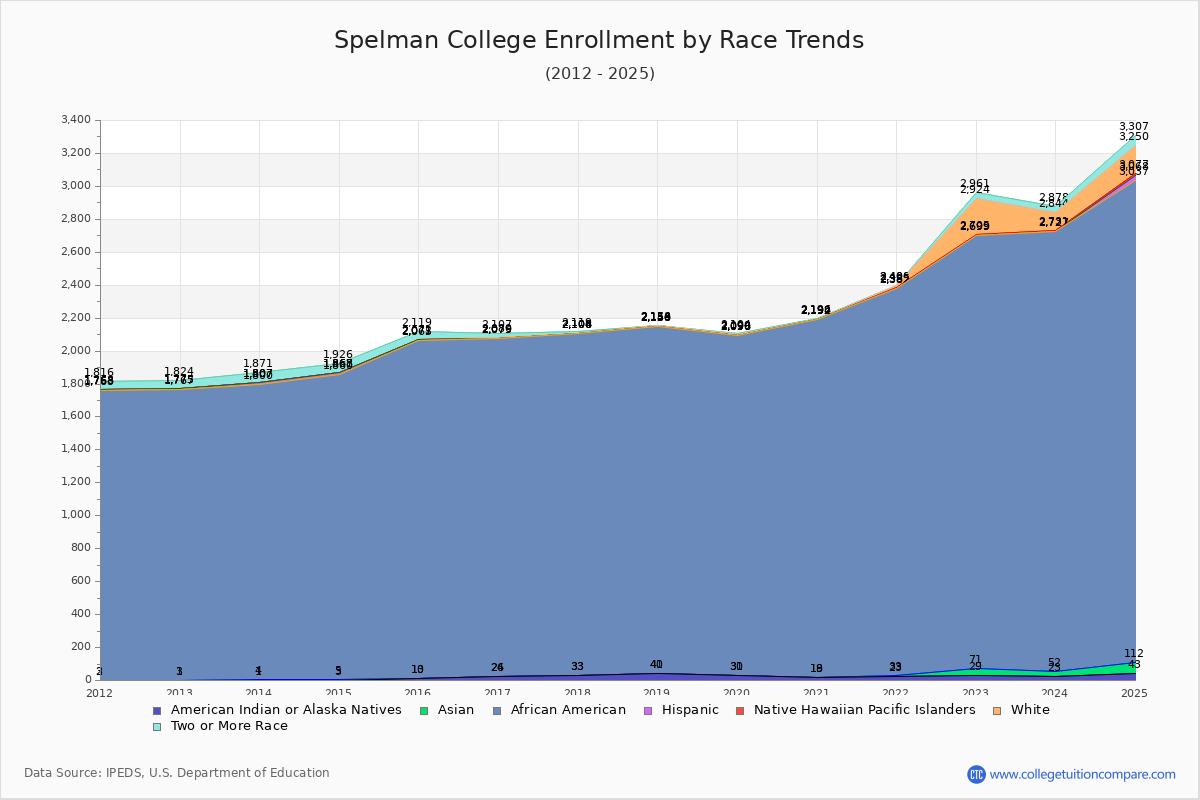
Enrollment by Race/Ethnicity Changes
The percentage of white students is 3.11% and the percentage of black students is 73.63% at Spelman College. 0.80% of enrolled students is Asian.
The following table and chart illustrate the student population trends by race/ethnicity at Spelman College over the past 12 years (2013-2024).
| Year | American Indian or Native American | Asian | Black | Hispanic | Native Hawaiian or Other Pacific Islander | White | Two or More Races |
|---|---|---|---|---|---|---|---|
| 2013-14 | 1 | 3 | 1,796 | 7 | 0 | 0 | 64 |
| 2014-15 | 3 | 2 | 1,855 | 7 | 0 | 1 | 58 |
| 2015-16 | 10 | 3 | 2,052 | 6 | 0 | 1 | 47 |
| 2016-17 | 24 | 2 | 2,049 | 4 | 0 | 1 | 27 |
| 2017-18 | 33 | 0 | 2,071 | 2 | 0 | 2 | 11 |
| 2018-19 | 40 | 1 | 2,107 | 2 | 0 | 3 | 1 |
| 2019-20 | 30 | 1 | 2,065 | 0 | 0 | 3 | 5 |
| 2020-21 | 18 | 1 | 2,173 | 0 | 0 | 2 | 2 |
| 2021-22 | 23 | 10 | 2,349 | 0 | 3 | 15 | 0 |
| 2022-23 | 29 | 42 | 2,628 | 0 | 6 | 219 | 37 |
| 2023-24 | 23 | 29 | 2,675 | 0 | 4 | 113 | 34 |
| Average | 21 | 9 | 2,165 | 3 | 1 | 33 | 26 |
Distance Learning (Online Courses) Enrollment Changes
1,048 students are enrolled in online degree programs exclusively for the academic year 2023-2024, which is 29% of total students. The number of online students has decreased % since 2014. The following table and chart illustrate the changes in the online student population by enrolled type at Spelman College from 2014 to 2024.
| Year | Total Enrollment | Online Completely | Enrolled in Some Online Courses | Not Enrolled in Online Courses |
|---|---|---|---|---|
| 2014-15 | 2,135 | 0 | 0 | 2,135 |
| 2015-16 | 2,144 | 0 | 0 | 2,144 |
| 2016-17 | 2,125 | 0 | 0 | 2,125 |
| 2017-18 | 2,137 | 0 | 0 | 2,137 |
| 2018-19 | 2,171 | 0 | 0 | 2,171 |
| 2019-20 | 2,120 | 0 | 0 | 2,120 |
| 2020-21 | 2,207 | 2,207 | 0 | 0 |
| 2021-22 | 2,417 | 8 | 1,002 | 1,407 |
| 2022-23 | 3,102 | 729 | 618 | 1,755 |
| 2023-24 | 3,633 | 1,048 | 508 | 2,077 |
| Average | 2,419 | 399 | 213 | 1,807 |
Ratings & Review
Share your experiences and thoughts about Spelman College. It will be a great help to applicants and prospective students!