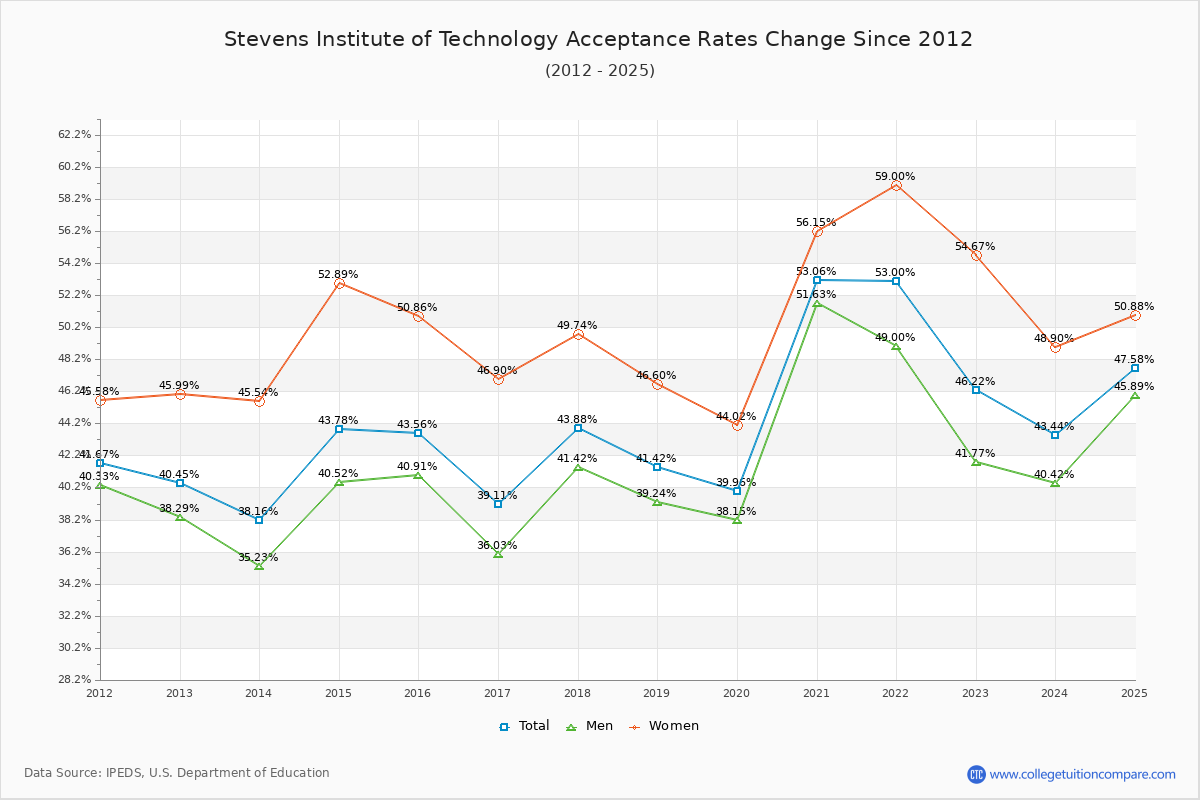
At Stevens Institute of Technology, the average acceptance rate over the past 11 years is 44.15%, and 2024's acceptance rate is 43.44%. Stevens's acceptance rate has been lower every year for the past 3 years. For 2024 admission, it was slightly harder to get into Stevens Institute of Technology than the previous year.
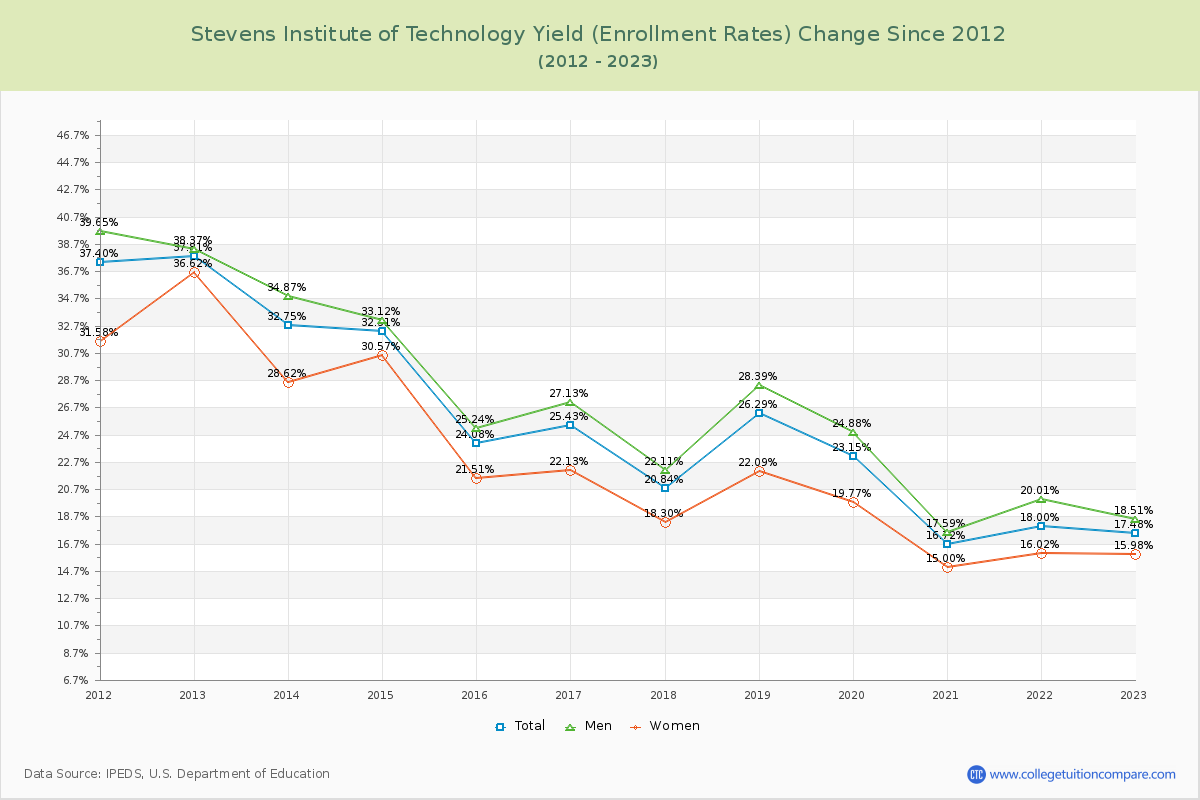
The average yield (enrollment rate) over the period is 23.06%, and the 2024 yield is 16.63%.
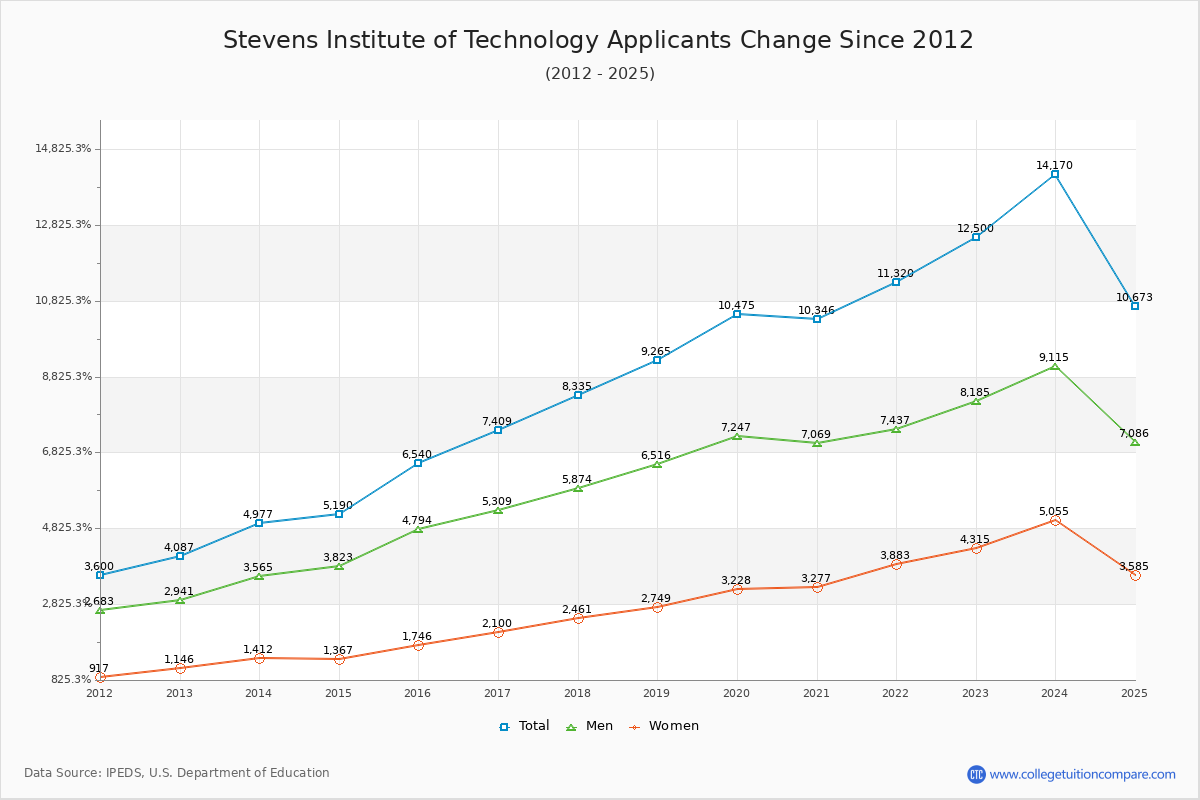
The number of Stevens applicants increased by 13.36% (1,670 applicants) compared to the previous year.
Acceptance Rate Changes
The average acceptance rate over the last 10 years is 44.15%, and this year's acceptance rate is 43.44% at Stevens Institute of Technology. By gender, men students' acceptance rate is 41.30% and women students' rate is 50.48%. For 2024 admission, it was slightly harder to get into Stevens Institute of Technology than the previous year.
The following table and chart illustrate the acceptance rates changes at Stevens Institute of Technology over the past 11 years (2013-2024).
| Year | Total | Men | Women |
|---|---|---|---|
| 2013-14 | 38.16% | 35.23% | 45.54% |
| 2014-15 | 43.78% 5.62% |
40.52% 5.29% |
52.89% 7.35% |
| 2015-16 | 43.56% -0.21% |
40.91% 0.39% |
50.86% -2.03% |
| 2016-17 | 39.11% -4.45% |
36.03% -4.87% |
46.90% -3.95% |
| 2017-18 | 43.88% 4.76% |
41.42% 5.39% |
49.74% 2.83% |
| 2018-19 | 41.42% -2.45% |
39.24% -2.18% |
46.60% -3.14% |
| 2019-20 | 39.96% -1.46% |
38.15% -1.09% |
44.02% -2.58% |
| 2020-21 | 53.06% 13.10% |
51.63% 13.48% |
56.15% 12.13% |
| 2021-22 | 53.00% -0.06% |
49.00% -2.64% |
59.00% 2.85% |
| 2022-23 | 46.22% -6.78% |
41.77% -7.23% |
54.67% -4.33% |
| 2023-24 | 43.44% -2.78% |
40.42% -1.35% |
48.90% -5.77% |
| Average | 44.15% | 41.30% | 50.48% |
Admission Yield (Enrollment Rate) Changes
The average admission yield of the last 11 years is 23.06% where the current academic year yield is 16.63%.
The following table and chart illustrate the changes in yield at Stevens Institute of Technology from 2013 to 2024.
| Year | Total | Men | Women |
|---|---|---|---|
| 2013-14 | 32.75% | 34.87% | 28.62% |
| 2014-15 | 32.31% -0.45% |
33.12% -1.75% |
30.57% 1.95% |
| 2015-16 | 24.08% -8.23% |
25.24% -7.88% |
21.51% -9.06% |
| 2016-17 | 25.43% 1.35% |
27.13% 1.89% |
22.13% 0.62% |
| 2017-18 | 20.84% -4.59% |
22.11% -5.02% |
18.30% -3.83% |
| 2018-19 | 26.29% 5.45% |
28.39% 6.28% |
22.09% 3.79% |
| 2019-20 | 23.15% -3.14% |
24.88% -3.51% |
19.77% -2.32% |
| 2020-21 | 16.72% -6.43% |
17.59% -7.29% |
15.00% -4.77% |
| 2021-22 | 18.00% 1.28% |
20.01% 2.42% |
16.02% 1.02% |
| 2022-23 | 17.48% -0.52% |
18.51% -1.49% |
15.98% -0.04% |
| 2023-24 | 16.63% -0.85% |
18.21% -0.30% |
14.28% -1.70% |
| Average | 23.06% | 24.55% | 20.39% |
Applicants, Admitted, and Enrolled Headcount Changes
Over the past 10 years, The average number of applicants is 9,139, the average number of admitted is 4,093, and the average number of first-year enrolled students is 868.
The number of Stevens applicants increased by 13.36% (1,670 applicants) compared to the previous year.
The following table and chart show the changes of applicants, admitted, and enrolled headcount at Stevens Institute of Technology from 2013 to 2024.
| Year | Applicants | Admitted | Enrolled |
|---|---|---|---|
| 2013-14 | 4,977 | 1,899 | 622 |
| 2014-15 | 5,190 4.28% |
2,272 19.64% |
734 18.01% |
| 2015-16 | 6,540 26.01% |
2,849 25.40% |
686 -6.54% |
| 2016-17 | 7,409 13.29% |
2,898 1.72% |
737 7.43% |
| 2017-18 | 8,335 12.50% |
3,657 26.19% |
762 3.39% |
| 2018-19 | 9,265 11.16% |
3,838 4.95% |
1,009 32.41% |
| 2019-20 | 10,475 13.06% |
4,186 9.07% |
969 -3.96% |
| 2020-21 | 10,346 -1.23% |
5,490 31.15% |
918 -5.26% |
| 2021-22 | 11,320 9.41% |
6,000 9.29% |
1,080 17.65% |
| 2022-23 | 12,500 10.42% |
5,778 -3.70% |
1,010 -6.48% |
| 2023-24 | 14,170 13.36% |
6,156 6.54% |
1,024 1.39% |
| Average | 9,139 | 4,093 | 868 |
Compare Acceptance Rate Change to Similar Colleges
The following table compares acceptance rate changes from last year between Stevens Institute of Technology and similar schools.
| 2024 | 2023 | Change % | |
|---|---|---|---|
| Stevens Institute of Technology | 43.00% | 46.22% | -6.97% |
| Seton Hall University | 79.00% | 75.07% | 5.24% |
| Princeton University | 4.00% | 5.70% | -29.82% |
| Beth Medrash Govoha | - | - | - |
| Fairleigh Dickinson University-Metropolitan Campus | 96.01% | 84.09% | 14.18% |
| Monmouth University | 90.00% | 90.92% | -1.01% |
Ratings & Review
Share your experiences and thoughts about Stevens Institute of Technology. It will be a great help to applicants and prospective students!