Over the past 11 years, the average SAT score of Stevens Institute of Technology is 1388, and current year SAT score is 1440
The SAT score have been increased 140 points since 2013 and it has risen almost every year over the past decade at Stevens. Compared to previous year, the SAT score decreased by 10 points at Stevens. Compared to similar schools, the submitted SAT and ACT scores are competitive and high at Stevens.
You can check and compare colleges with similar SAT scores Stevens by SAT score range 1340-1440, 1390-1490, and 1440-1540.
SAT Scores Over Time
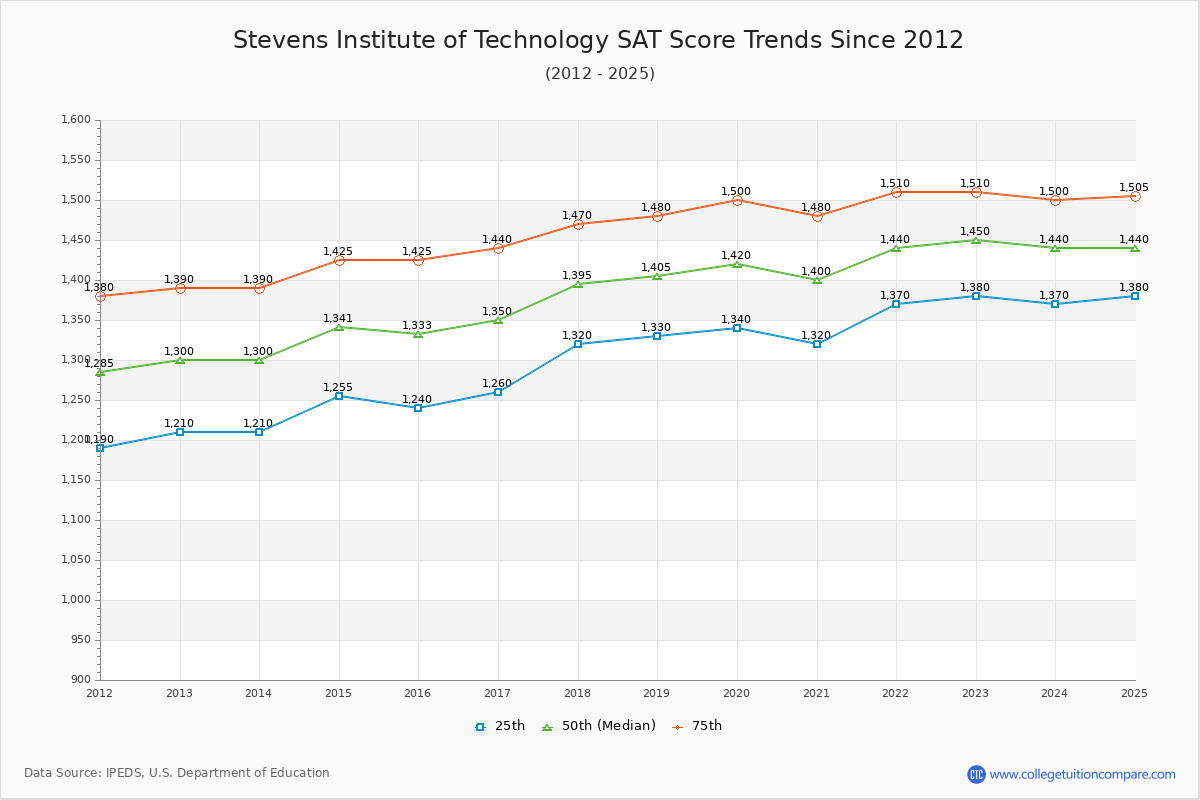
The 2024 SAT score is 1440 at Stevens. Over the past 12 years, the average SAT score is 1309 (25th percentile) and 1466 (75th percentile). Compared to similar schools, the submitted SAT scores are competitive and high at Stevens.
The following table and chart illustrate the changes in SAT scores at Stevens Institute of Technology since 2013.
| Year | Total | Math | Evidence-Based Reading and Writing | ||||||
|---|---|---|---|---|---|---|---|---|---|
| 25th | 50th | 75th | 25th | 50th | 75th | 25th | 50th | 75th | |
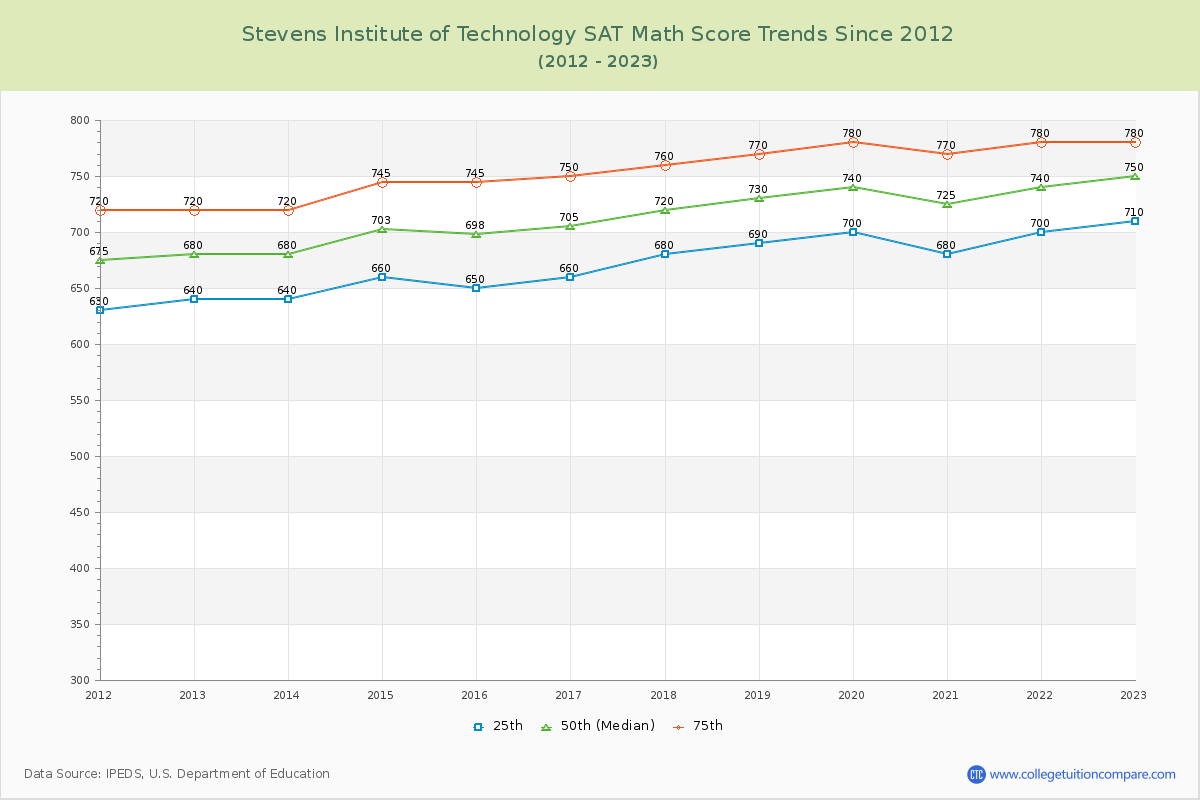
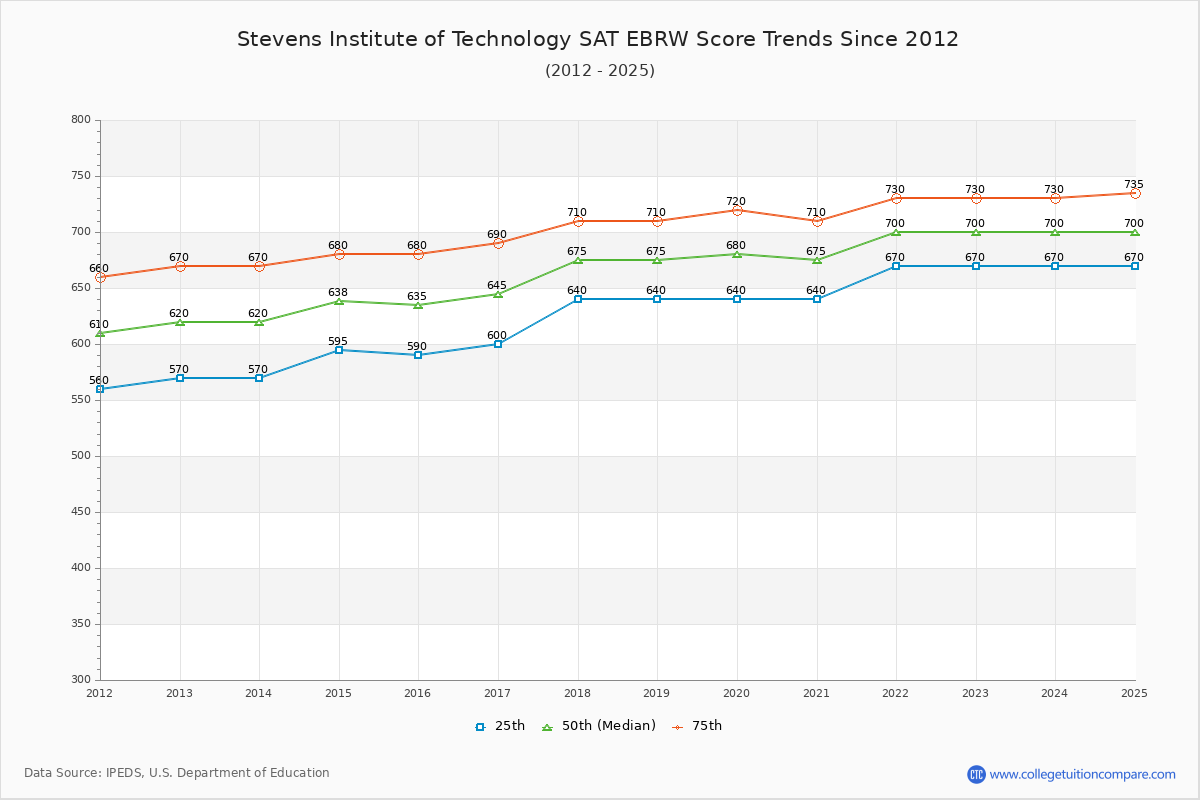
| 2013-14 | 1,210 | 1,300 | 1,390 | 640 | 680 | 720 | 570 | 620 | 670 |
| 2014-15 | 1,255 | 1,340 | 1,425 | 660 | 703 | 745 | 595 | 638 | 680 |
| 2015-16 | 1,240 | 1,333 | 1,425 | 650 | 698 | 745 | 590 | 635 | 680 |
| 2016-17 | 1,260 | 1,350 | 1,440 | 660 | 705 | 750 | 600 | 645 | 690 |
| 2017-18 | 1,320 | 1,395 | 1,470 | 680 | 720 | 760 | 640 | 675 | 710 |
| 2018-19 | 1,330 | 1,405 | 1,480 | 690 | 730 | 770 | 640 | 675 | 710 |
| 2019-20 | 1,340 | 1,420 | 1,500 | 700 | 740 | 780 | 640 | 680 | 720 |
| 2020-21 | 1,320 | 1,400 | 1,480 | 680 | 725 | 770 | 640 | 675 | 710 |
| 2021-22 | 1,370 | 1,440 | 1,510 | 700 | 740 | 780 | 670 | 700 | 730 |
| 2022-23 | 1,380 | 1,450 | 1,510 | 710 | 750 | 780 | 670 | 700 | 730 |
| 2023-24 | 1,370 | 1,440 | 1,500 | 700 | 740 | 770 | 670 | 700 | 730 |
| Average | 1309 | 1388 | 1466 | 679 | 721 | 761 | 630 | 668 | 705 |
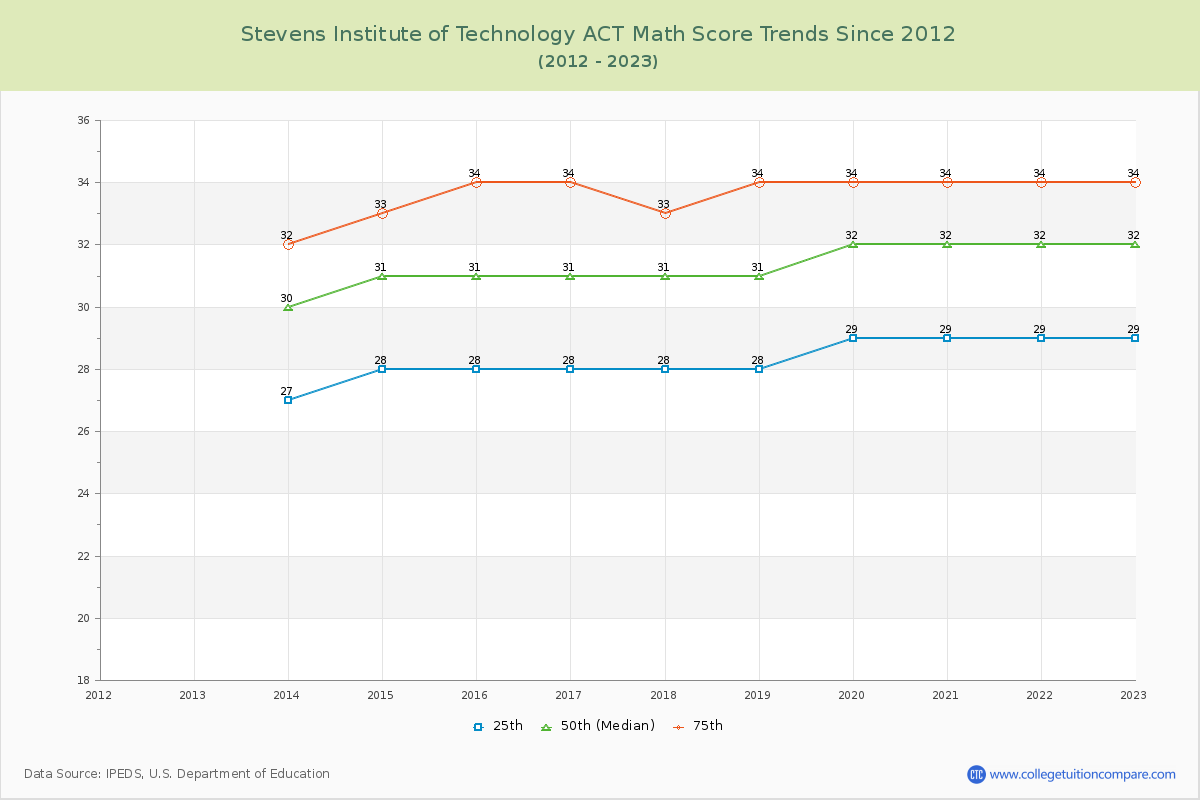
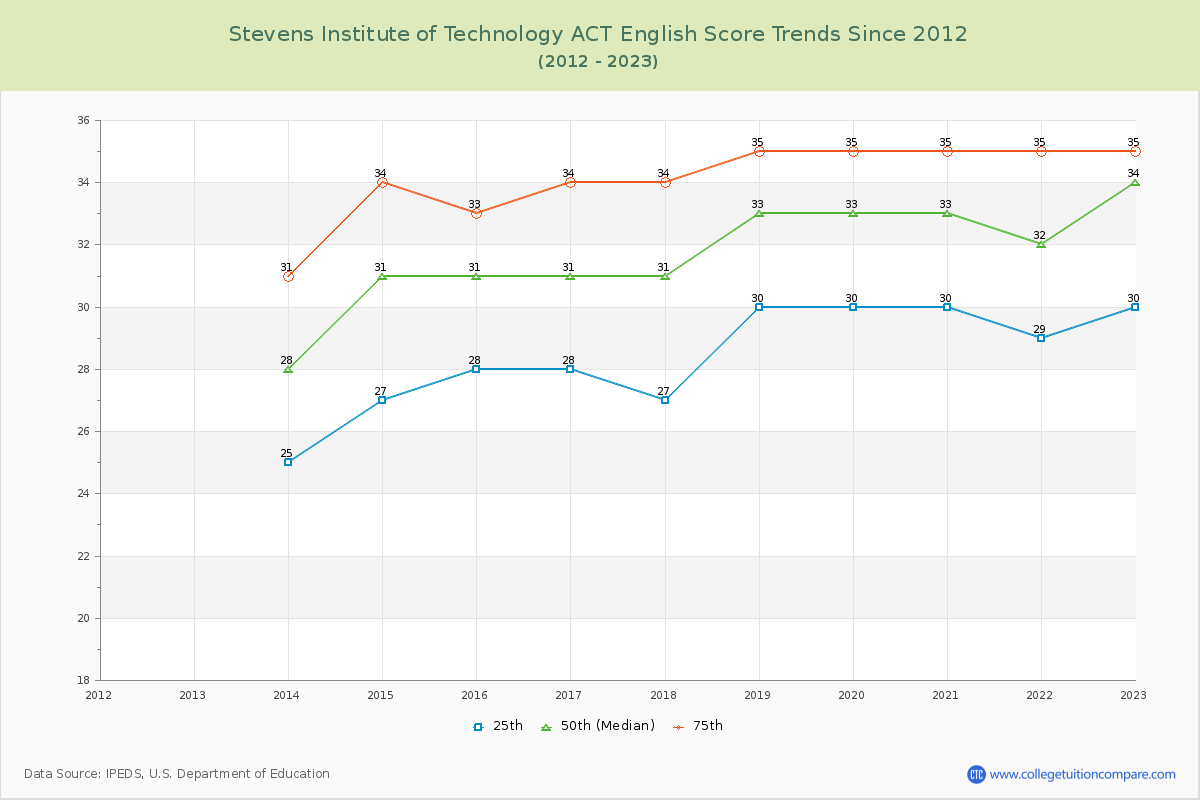
ACT Scores Over Time
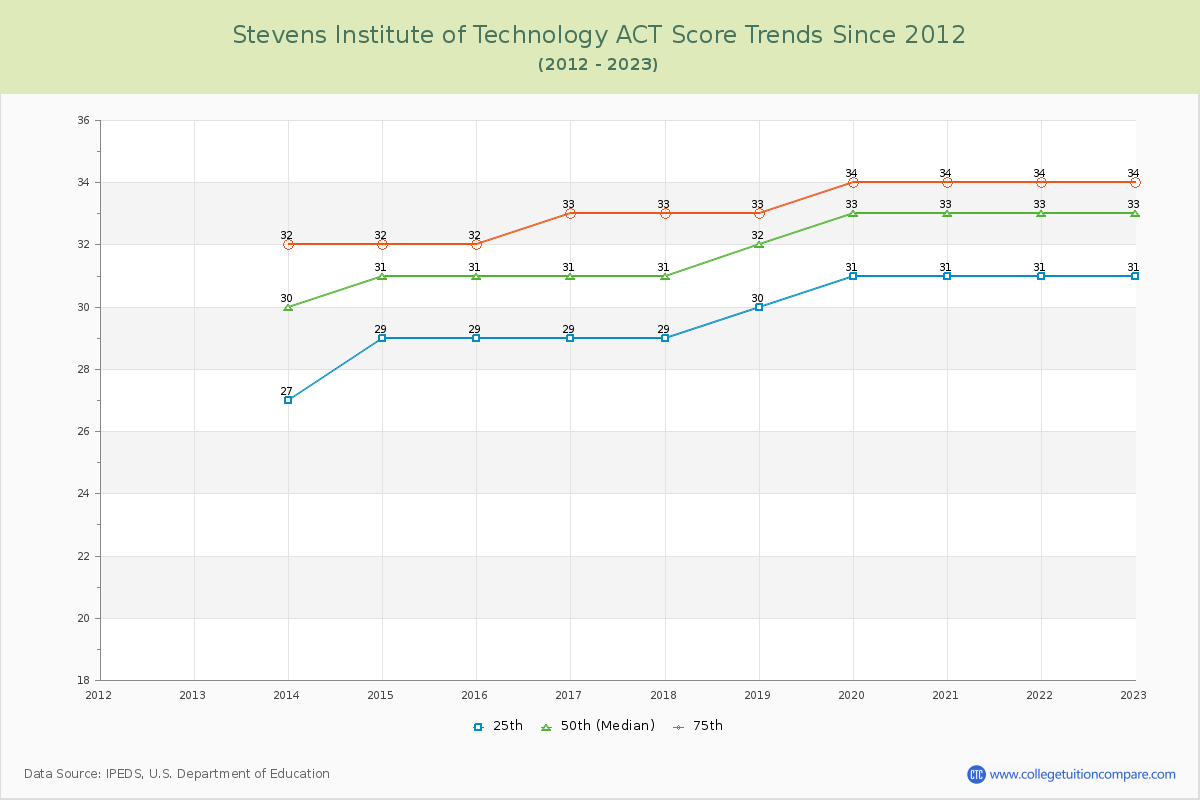
The 2024 ACT score is 33 at Stevens. Over the past 12 years, the average ACT score of the last 12 years is 30 (25th percentile) and 33 (75th percentile). Compared to similar schools, the submitted ACT scores are competitive and high at Stevens.
The following table and chart show the changes in ACT scores at Stevens Institute of Technology since 2013.
| Year | Composite | English | Math | ||||||
|---|---|---|---|---|---|---|---|---|---|
| 25th | 50th | 75th | 25th | 50th | 75th | 25th | 50th | 75th | |
| 2013-14 | 27 | 30 | 32 | 25 | 28 | 31 | 27 | 30 | 32 |
| 2014-15 | 29 | 31 | 32 | 27 | 31 | 34 | 28 | 31 | 33 |
| 2015-16 | 29 | 31 | 32 | 28 | 31 | 33 | 28 | 31 | 34 |
| 2016-17 | 29 | 31 | 33 | 28 | 31 | 34 | 28 | 31 | 34 |
| 2017-18 | 29 | 31 | 33 | 27 | 31 | 34 | 28 | 31 | 33 |
| 2018-19 | 30 | 32 | 33 | 30 | 33 | 35 | 28 | 31 | 34 |
| 2019-20 | 31 | 33 | 34 | 30 | 33 | 35 | 29 | 32 | 34 |
| 2020-21 | 31 | 33 | 34 | 30 | 33 | 35 | 29 | 32 | 34 |
| 2021-22 | 31 | 33 | 34 | 29 | 32 | 35 | 29 | 32 | 34 |
| 2022-23 | 31 | 33 | 34 | 30 | 34 | 35 | 29 | 32 | 34 |
| 2023-24 | 31 | 33 | 34 | 31 | 34 | 35 | 29 | 31 | 34 |
| Average | 30 | 32 | 33 | 29 | 32 | 34 | 28 | 31 | 34 |
Compare SAT Score Change to Similar Colleges
The following table compares SAT score changes from last year between Stevens Institute of Technology and similar schools.
| 2024 | 2023 | Change % | |
|---|---|---|---|
| Stevens Institute of Technology | 1450 | 1440 | 0.69% |
| Seton Hall University | 1310 | 1285 | 1.95% |
| Princeton University | 1540 | 1515 | 1.65% |
| Beth Medrash Govoha | - | - | - |
| Fairleigh Dickinson University-Metropolitan Campus | 1045 | - | - |
| Monmouth University | 1200 | 1160 | 3.45% |
Ratings & Review
Share your experiences and thoughts about Stevens Institute of Technology. It will be a great help to applicants and prospective students!