The student population at Stevens Institute of Technology is 9,314 (4,070 undergraduate and 5,244 graduate students) . The number of students has increased by 3,530 over the past decade.
The percentage of undergraduate students at Stevens is 43.70% which is increased by 1,379 over last 10 years. The graduate student population increased by 2,151 and it has been increasing.
The female to male ratio is 0.42 to 1 which means that majority of population is on male students.
1,079 students enrolled in online degree program exclusively and the number of online students has increased by 44.38% since 2014.
Student Population Changes
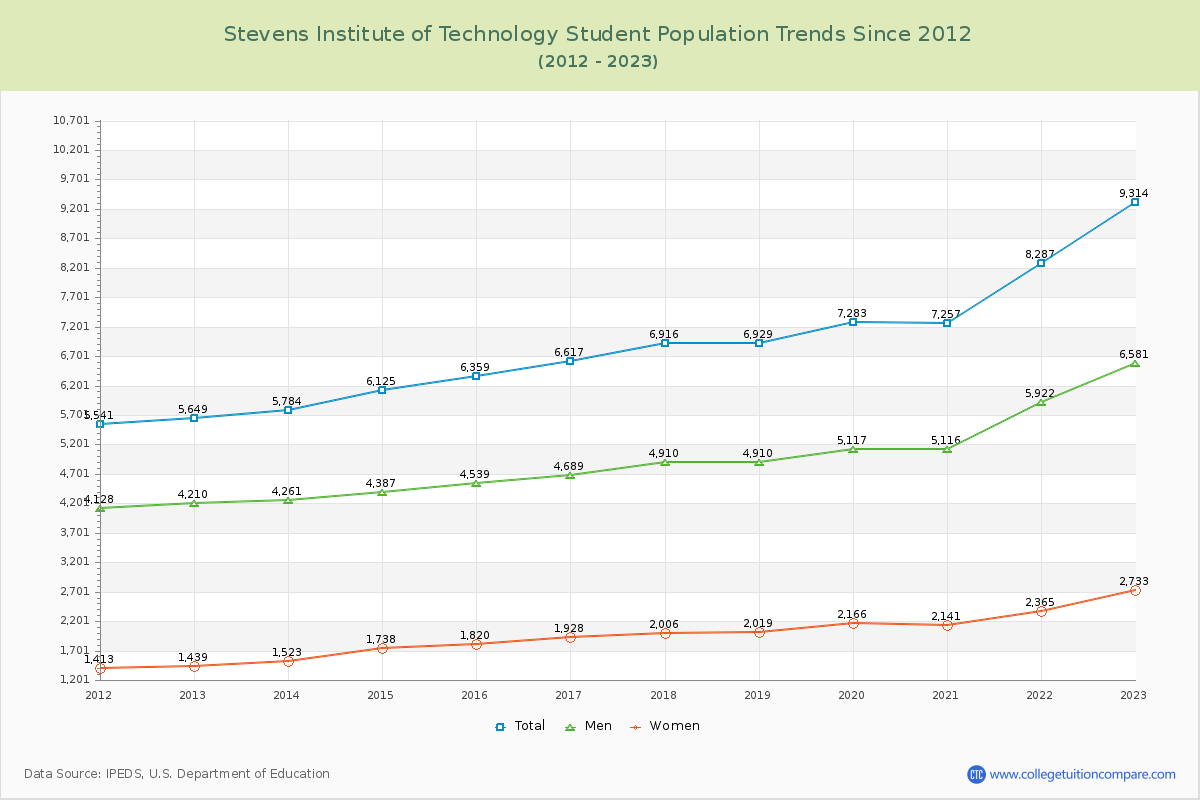
The average student population over the last 11 years is 7,087 where 9,314 students are attending the school for the academic year 2022-2023.
43.70% of total students is undergraduate students and 56.30% students is graduate students. The number of undergraduate students has increased by 1,379 and the graduate enrollment has increased by 2,151 over past 10 years.
The female to male ratio is 0.42 to 1 and it means that there are far more male students enrolled in Stevens than female students.
The following table and chart illustrate the changes in student population by gender at Stevens Institute of Technology since 2013.
| Year | Total | Undergraduate | Graduate | ||||
|---|---|---|---|---|---|---|---|
| Total | Men | Women | Total | Men | Women | ||
| 2013-14 | 5,784 | 2,691 | 1,933 | 758 | 3,093 | 2,328 | 765 |
| 2014-15 | 6,125 341 | 2,892 201 | 2,054 121 | 838 80 | 3,233 140 | 2,333 5 | 900 135 |
| 2015-16 | 6,359 234 | 2,976 84 | 2,101 47 | 875 37 | 3,383 150 | 2,438 105 | 945 45 |
| 2016-17 | 6,617 258 | 3,115 139 | 2,194 93 | 921 46 | 3,502 119 | 2,495 57 | 1,007 62 |
| 2017-18 | 6,916 299 | 3,123 8 | 2,193 -1 | 930 9 | 3,793 291 | 2,717 222 | 1,076 69 |
| 2018-19 | 6,929 13 | 3,431 308 | 2,422 229 | 1,009 79 | 3,498 -295 | 2,488 -229 | 1,010 -66 |
| 2019-20 | 7,283 354 | 3,659 228 | 2,582 160 | 1,077 68 | 3,624 126 | 2,535 47 | 1,089 79 |
| 2020-21 | 7,257 -26 | 3,791 132 | 2,691 109 | 1,100 23 | 3,466 -158 | 2,425 -110 | 1,041 -48 |
| 2021-22 | 8,287 1,030 | 4,064 273 | 2,841 150 | 1,223 123 | 4,223 757 | 3,081 656 | 1,142 101 |
| 2022-23 | 9,314 1,027 | 4,070 6 | 2,768 -73 | 1,302 79 | 5,244 1,021 | 3,813 732 | 1,431 289 |
| Average | 7,087 | 3,381 | 2,378 | 1,003 | 3,706 | 2,665 | 1,041 |
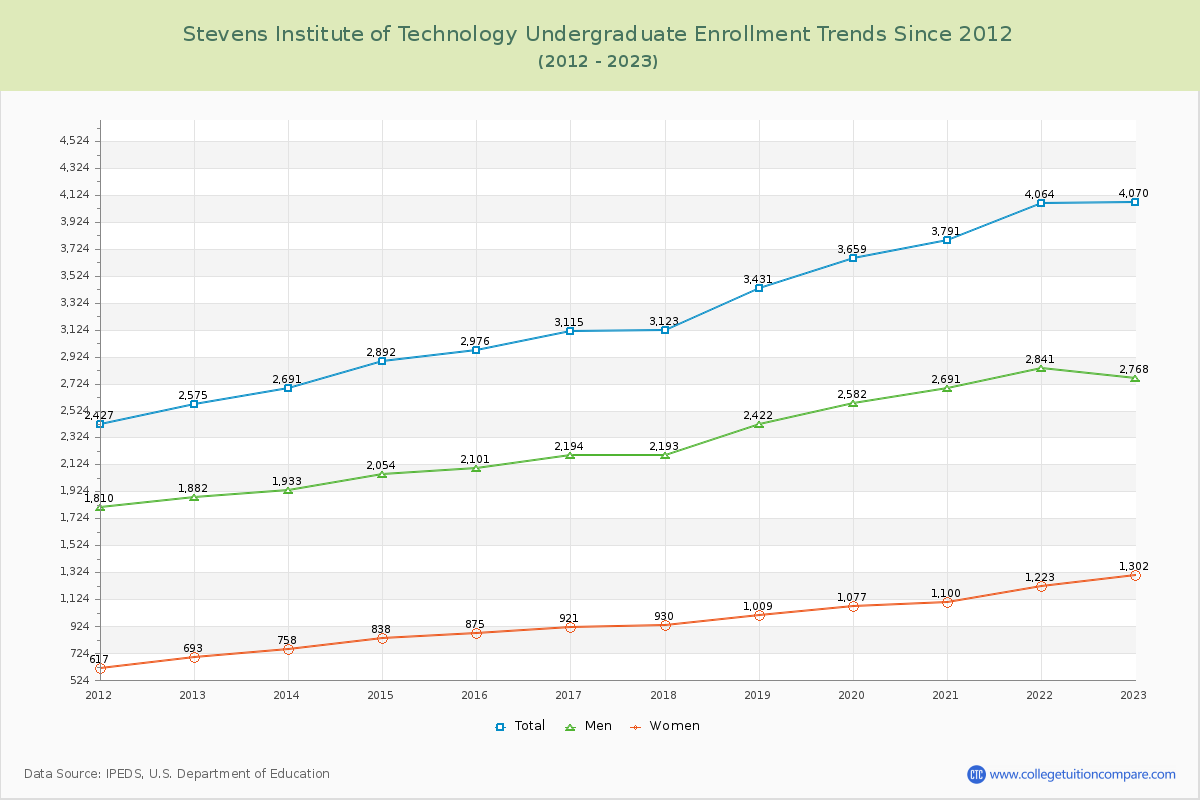
Undergraduate Enrollment Changes
The average number of Undergraduate students over the last 11 years is 3,381 where 4,070 students are attending the Undergraduate school for the academic year 2022-2023. The following table and chart illustrate the changes in Undergraduate enrollment by attending status and gender at Stevens Institute of Technology since 2013.
| Year | Total | Full-time | Part-time | ||||
|---|---|---|---|---|---|---|---|
| Total | Men | Women | Total | Men | Women | ||
| 2013-14 | 2,691 | 2,661 | 1,913 | 748 | 30 | 20 | 10 |
| 2014-15 | 2,892 | 2,842 | 2,017 | 825 | 50 | 37 | 13 |
| 2015-16 | 2,976 | 2,955 | 2,087 | 868 | 21 | 14 | 7 |
| 2016-17 | 3,115 | 3,108 | 2,191 | 917 | 7 | 3 | 4 |
| 2017-18 | 3,123 | 3,113 | 2,185 | 928 | 10 | 8 | 2 |
| 2018-19 | 3,431 | 3,420 | 2,416 | 1,004 | 11 | 6 | 5 |
| 2019-20 | 3,659 | 3,642 | 2,569 | 1,073 | 17 | 13 | 4 |
| 2020-21 | 3,791 | 3,759 | 2,669 | 1,090 | 32 | 22 | 10 |
| 2021-22 | 4,064 | 4,035 | 2,816 | 1,219 | 29 | 25 | 4 |
| 2022-23 | 4,070 | 4,050 | 2,752 | 1,298 | 20 | 16 | 4 |
| Average | 3,381 | 3,381 | 2,362 | 997 | 3,381 | 16 | 6 |
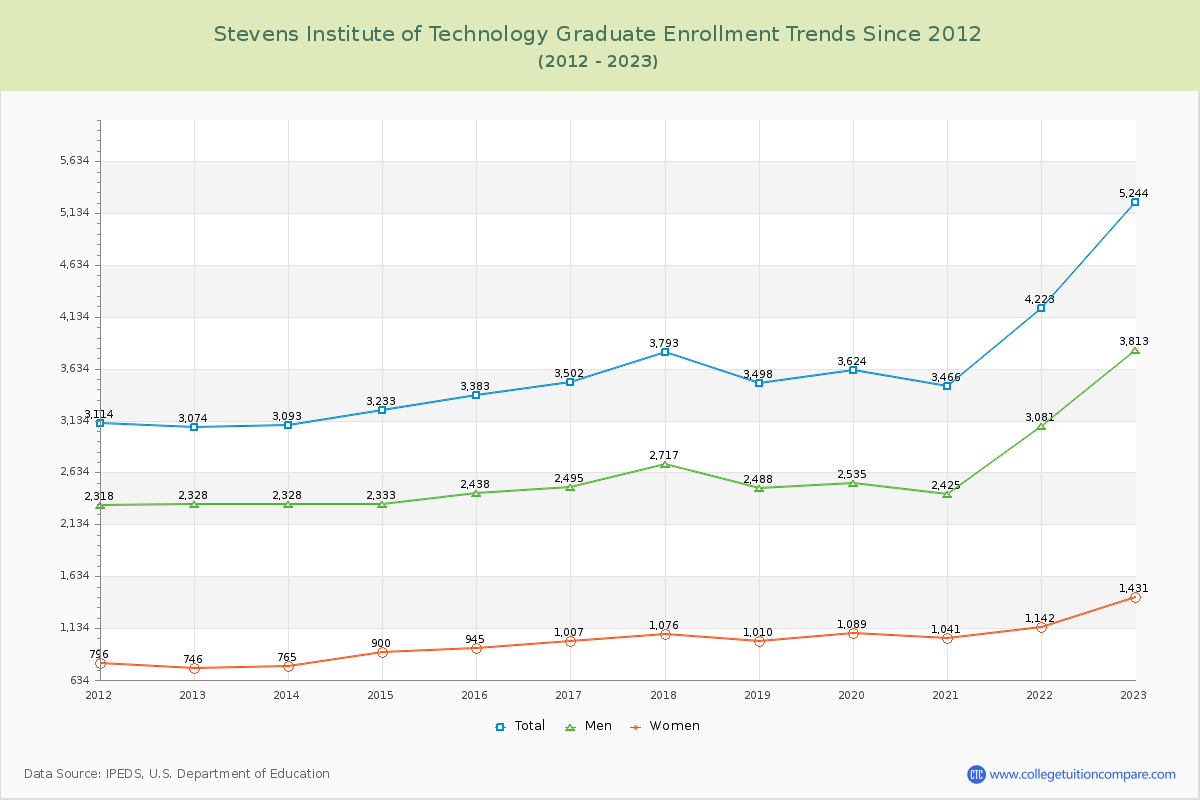
Graduate Enrollment Changes
The average number of Graduate students over the last 11 years is 3,706 where 5,244 students are attending the Graduate school for the academic year 2022-2023. The following table and chart illustrate the changes in Graduate enrollment by attending status and gender at Stevens Institute of Technology since 2013.
| Year | Total | Full-time | Part-time | ||||
|---|---|---|---|---|---|---|---|
| Total | Men | Women | Total | Men | Women | ||
| 2013-14 | 3,093 | 1,519 | 1,100 | 419 | 1,574 | 1,228 | 346 |
| 2014-15 | 3,233 | 2,008 | 1,410 | 598 | 1,225 | 923 | 302 |
| 2015-16 | 3,383 | 2,137 | 1,497 | 640 | 1,246 | 941 | 305 |
| 2016-17 | 3,502 | 2,301 | 1,615 | 686 | 1,201 | 880 | 321 |
| 2017-18 | 3,793 | 2,502 | 1,806 | 696 | 1,291 | 911 | 380 |
| 2018-19 | 3,498 | 2,298 | 1,672 | 626 | 1,200 | 816 | 384 |
| 2019-20 | 3,624 | 2,460 | 1,771 | 689 | 1,164 | 764 | 400 |
| 2020-21 | 3,466 | 2,202 | 1,562 | 640 | 1,264 | 863 | 401 |
| 2021-22 | 4,223 | 2,790 | 2,048 | 742 | 1,433 | 1,033 | 400 |
| 2022-23 | 5,244 | 3,798 | 2,782 | 1,016 | 1,446 | 1,031 | 415 |
| Average | 3,706 | 3,706 | 1,726 | 675 | 3,706 | 939 | 365 |
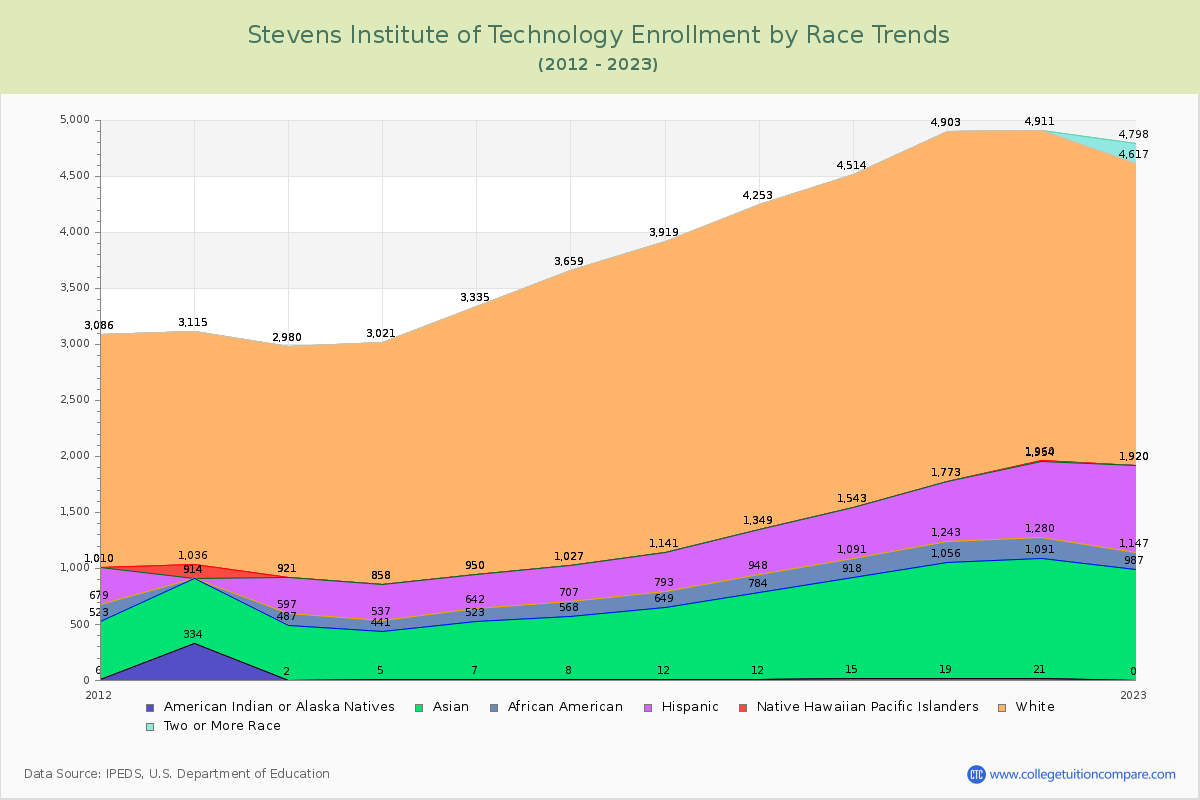
Enrollment by Race/Ethnicity Changes
The percentage of white students is 28.96% and the percentage of black students is 1.72% at Stevens Institute of Technology. 10.60% of enrolled students is Asian.
The following table and chart illustrate the student population trends by race/ethnicity at Stevens Institute of Technology over the past 11 years (2013-2023).
| Year | American Indian or Native American | Asian | Black | Hispanic | Native Hawaiian or Other Pacific Islander | White | Two or More Races |
|---|---|---|---|---|---|---|---|
| 2013-14 | 2 | 485 | 110 | 324 | 0 | 2,059 | 0 |
| 2014-15 | 5 | 436 | 96 | 321 | 0 | 2,163 | 0 |
| 2015-16 | 7 | 516 | 119 | 308 | 0 | 2,385 | 0 |
| 2016-17 | 8 | 560 | 139 | 320 | 0 | 2,632 | 0 |
| 2017-18 | 12 | 637 | 144 | 348 | 0 | 2,778 | 0 |
| 2018-19 | 12 | 772 | 164 | 401 | 0 | 2,904 | 0 |
| 2019-20 | 15 | 903 | 173 | 452 | 0 | 2,971 | 0 |
| 2020-21 | 19 | 1,037 | 187 | 530 | 0 | 3,130 | 0 |
| 2021-22 | 21 | 1,070 | 189 | 674 | 6 | 2,951 | 0 |
| 2022-23 | 0 | 987 | 160 | 773 | 0 | 2,697 | 181 |
| Average | 10 | 740 | 148 | 445 | 1 | 2,667 | 18 |
Distance Learning (Online Courses) Enrollment Changes
1,079 students are enrolled in online degree programs exclusively for the academic year 2022-2023, which is 12% of total students. The number of online students has increased 44.38% since 2014. The following table and chart illustrate the changes in the online student population by enrolled type at Stevens Institute of Technology from 2014 to 2023.
| Year | Total Enrollment | Online Completely | Enrolled in Some Online Courses | Not Enrolled in Online Courses |
|---|---|---|---|---|
| 2014-15 | 6,125 | 0 | 2,600 | 3,525 |
| 2015-16 | 6,359 | 550 | 1,026 | 4,783 |
| 2016-17 | 6,617 | 519 | 1,648 | 4,450 |
| 2017-18 | 6,916 | 548 | 1,453 | 4,915 |
| 2018-19 | 6,929 | 545 | 1,377 | 5,007 |
| 2019-20 | 7,283 | 611 | 1,384 | 5,288 |
| 2020-21 | 7,257 | 752 | 1,685 | 4,820 |
| 2021-22 | 8,287 | 888 | 2,210 | 5,189 |
| 2022-23 | 9,314 | 1,079 | 3,754 | 4,481 |
| Average | 7,232 | 610 | 1,904 | 4,718 |
Ratings & Review
Share your experiences and thoughts about Stevens Institute of Technology. It will be a great help to applicants and prospective students!